Robot Framework Pro

Complete Robot Framework extension for Visual Studio Code
Debugging • Code Analysis • Test Explorer • Real-time Output • Material Theme


✨ Features
🎯 NEW in v2.0: Advanced Stack Traces & Deep Debugging
Deep Stack Trace Analysis - No more guessing where failures happen! When keywords call other keywords, see the complete call hierarchy down to the actual failure point.
Features:
- 📍 Python-style tracebacks showing the full keyword call path
- 🌳 Interactive Tree View - Click any keyword in the stack to jump to its source
- 🎯 Root Cause Detection - Instantly navigate to the exact line that failed
- 🧹 Clean error messages - Selenium/WebDriver stacktraces filtered out
- 📊 Expected vs Actual values clearly displayed
Example Stack Trace:
→ Variable Operations (example.robot:31)
  → Should Be Equal As Numbers (example.robot:39) [FAILED]
    Error: 45.0 != 42.0
    Expected: 42.0
    Actual: 45.0
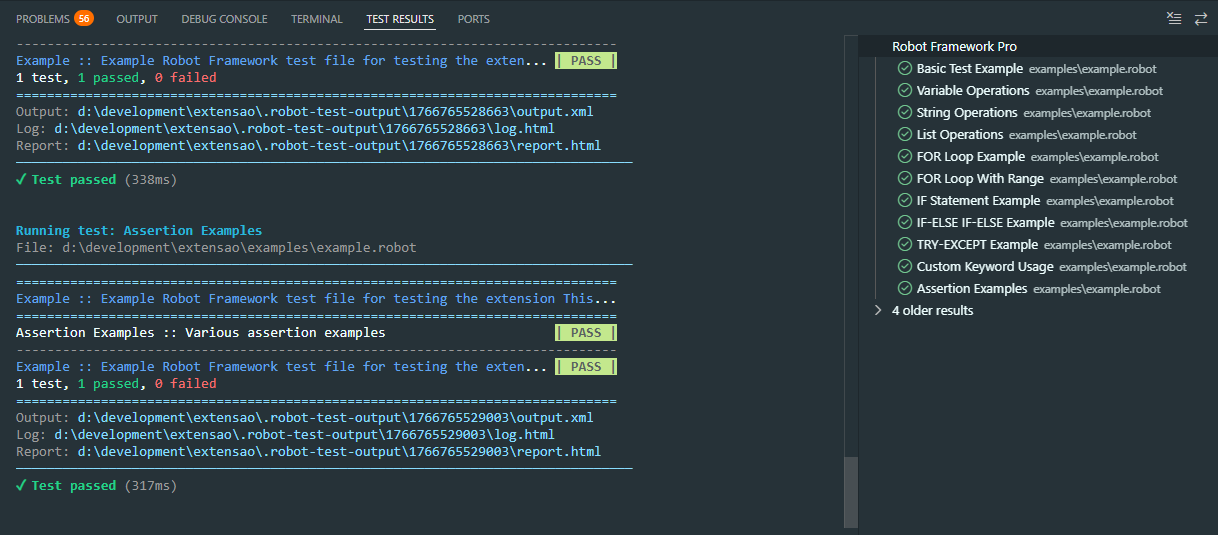
🧪 Test Explorer & Results
Run and debug your Robot Framework tests directly from VS Code's Test Explorer with colored results.
🐛 NEW in v2.0: Professional Debugger with Breakpoints
Real Debugging - Set breakpoints, step through keywords, inspect variables in real-time!
Features:
- 🔴 Breakpoints - Set breakpoints directly in .robot files
- ⏯️ Step Over/Into/Out - Navigate through keyword execution
- 🔍 Variable Inspection - View all Robot Framework variables in real-time
- ⏸️ Pause on Breakpoint - Execution pauses at breakpoints, inspect state
- 📊 Call Stack View - See the complete execution hierarchy
- 🎨 Colored Debug Output - Beautiful terminal output with ANSI colors
How it works:
- Set breakpoints by clicking on line numbers in .robot files
- Press F5 or use Debug commands
- Execution pauses at breakpoints
- Inspect variables in the Variables pane
- Step through keywords one by one
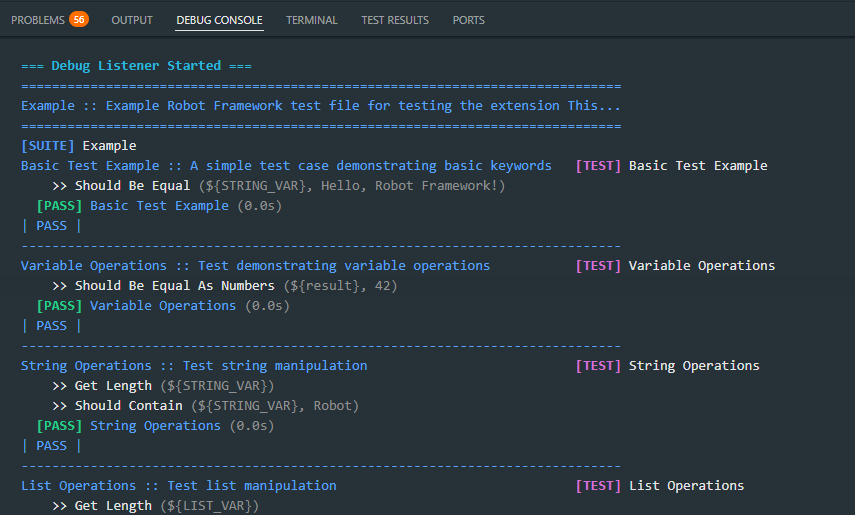
🔍 Real-time Debug Output
See each keyword being executed in real-time with colored output in the Debug Console.
Features:
- 🟢 PASS in green
- 🔴 FAIL in red with error details
- 🟡 SETUP/TEARDOWN in yellow
- 🔵 FOR/IF/TRY control structures in cyan
- Smart filtering of internal keywords (Log, Set Variable, etc.)
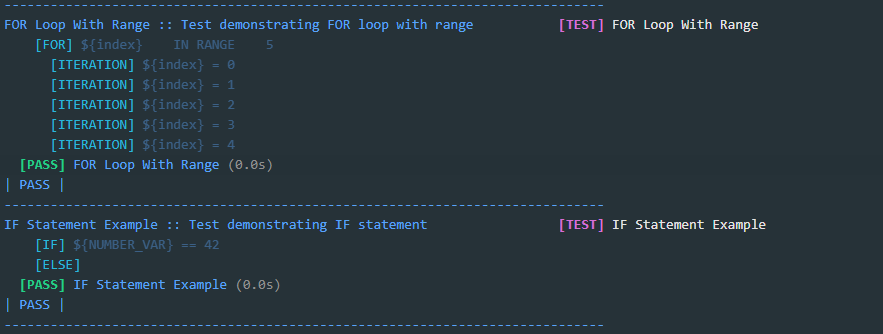
🔄 Control Structures Support
Full support for FOR loops, IF statements, TRY/EXCEPT with real-time iteration display.
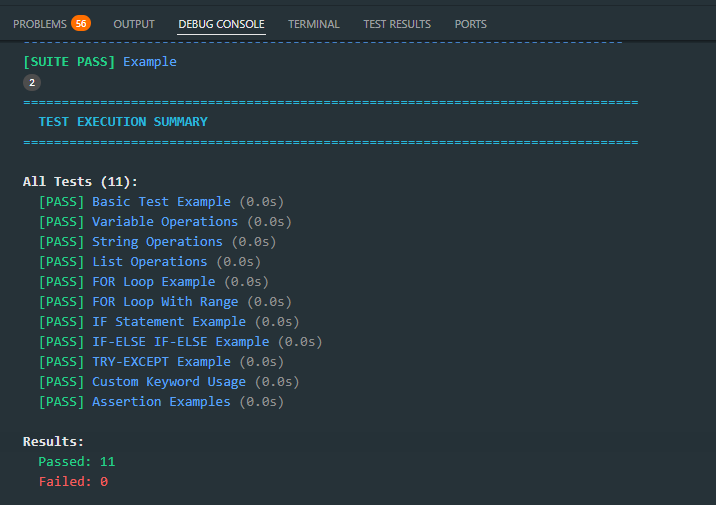
📊 Test Execution Summary
At the end of each test run, see a complete summary with all results and pass/fail counts.
🚀 Quick Start
- Install the extension from the VS Code Marketplace
- Open a folder containing
.robot files
- Open the Test Explorer (beaker icon in the sidebar)
- Click the play button to run tests!
📦 Features List
🎯 NEW - Advanced Debugging & Stack Traces (v2.0)
- ✅ Deep Stack Traces - Python-style tracebacks showing full keyword hierarchy
- ✅ Interactive Tree View - Click to navigate through failure call stack
- ✅ Root Cause Detection - Navigate directly to the exact failure line
- ✅ Real Breakpoints - Set breakpoints in .robot files that actually work
- ✅ Step Over/Into/Out - Step through keyword execution like a pro
- ✅ Live Variable Inspection - View all RF variables during debugging
- ✅ Clean Error Messages - Selenium/WebDriver stacktraces automatically filtered
- ✅ Expected vs Actual - Clear display of assertion failures
Test Explorer & Execution
- ✅ Test Explorer with hierarchical test display
- ✅ Run individual tests or entire files
- ✅ Debug mode with real-time keyword output
- ✅ Three run profiles: Run, Debug, Run Verbose
- ✅ Real-time test status (passed/failed)
- ✅ Test execution summary with failure details
- ✅ Keyword Call Stack view for failed tests
Language Features
- ✅ Go to Definition (F12) - Navigate to keyword definitions
- ✅ Find All References (Shift+F12) - Find all usages
- ✅ Hover Documentation - See documentation on hover
- ✅ Signature Help (Ctrl+Shift+Space) - View keyword arguments
- ✅ Advanced IntelliSense - Smart code completion
- ✅ Rename Refactoring (F2) - Rename across workspace
Code Quality
- ✅ Complete syntax highlighting
- ✅ Code formatting
- ✅ Real-time error detection
- ✅ Robocop integration for linting
- ✅ Import management
Reporting
- ✅ View test reports in VS Code
- ✅ View test logs in VS Code
- ✅ Real-time colored output
⚙️ Requirements
- Visual Studio Code 1.85.0+
- Python 3.8+
- Robot Framework 4.0+ (
pip install robotframework)
Optional:
- Robocop for linting (
pip install robotframework-robocop)
- Robotidy for formatting (
pip install robotframework-tidy)
⌨️ Keyboard Shortcuts
| Shortcut |
Action |
Ctrl+Shift+R |
Run current test file |
Ctrl+Shift+D |
Debug current test file |
F12 |
Go to Definition |
Shift+F12 |
Find All References |
F2 |
Rename Symbol |
Ctrl+Shift+Space |
Signature Help |
🎨 Themes
Includes beautiful Material themes:
- Material Dark - Dark theme for comfortable coding
- Material Light - Light theme for bright environments
📝 Release Notes
2.0.0 (Latest) - Major Update! 🎉
Revolutionary Debugging & Stack Trace Features
This is the biggest update yet! We've completely reimagined how you debug Robot Framework tests.
🎯 Deep Stack Trace Analysis
- ✨ Python-style tracebacks - See complete keyword call hierarchy from test to failure point
- ✨ Interactive Tree View - "Keyword Call Stack" panel in Test Explorer
- ✨ Root cause detection - Click any keyword in the stack to jump to exact source line
- ✨ Clean error messages - Selenium/WebDriver hex stacktraces automatically filtered
- ✨ Smart Expected/Actual parsing - See what was expected vs what happened
🐛 Professional Debugger
- ✨ Real breakpoints - Set breakpoints in .robot files that actually pause execution
- ✨ Step Over/Into/Out - Navigate through keyword execution step-by-step
- ✨ Live variable inspection - View all Robot Framework variables in real-time
- ✨ File-based communication - Innovative pause mechanism using file watchers
- ✨ Colored debug output - Beautiful ANSI-colored terminal output
🔧 Technical Improvements
- ✨ Enhanced test listener with manual call stack tracking
- ✨ Listener v2 API compatibility (RF 6.x+)
- ✨ Stack trace formatter with compact display
- ✨ Debug adapter with DAP protocol implementation
- ✨ Backward compatible JSON format (supports old format)
📊 Enhanced Test Results
- ✨ Failure messages show full call path
- ✨ Line numbers point to actual failure, not parent keyword
- ✨ Clean, readable error messages
- ✨ Expected vs Actual values clearly displayed
Bug Fixes
- 🐛 Fixed nested keyword failures showing wrong line numbers
- 🐛 Fixed verbose Selenium stacktraces in output
- 🐛 Fixed Expected/Actual parsing for complex assertions
1.1.2
- 🎨 New extension icon
- 🐛 Fixed extension activation issues
1.1.0
- ✨ Real-time keyword execution in Debug Console
- ✨ Colored output (PASS/FAIL/TEST/SUITE)
- ✨ Smart filtering of internal keywords
- ✨ Test execution summary with failure details
- ✨ Three run profiles (Run, Debug, Run Verbose)
- 🐛 Fixed "Suite contains no tests" error
1.0.0
📄 License
MIT License - see LICENSE for details.
Enjoy using Robot Framework Pro! 🤖