Visualize Synopsys DC report_area -hierarchical output as an interactive treemap or list directly in VS Code.
What it does
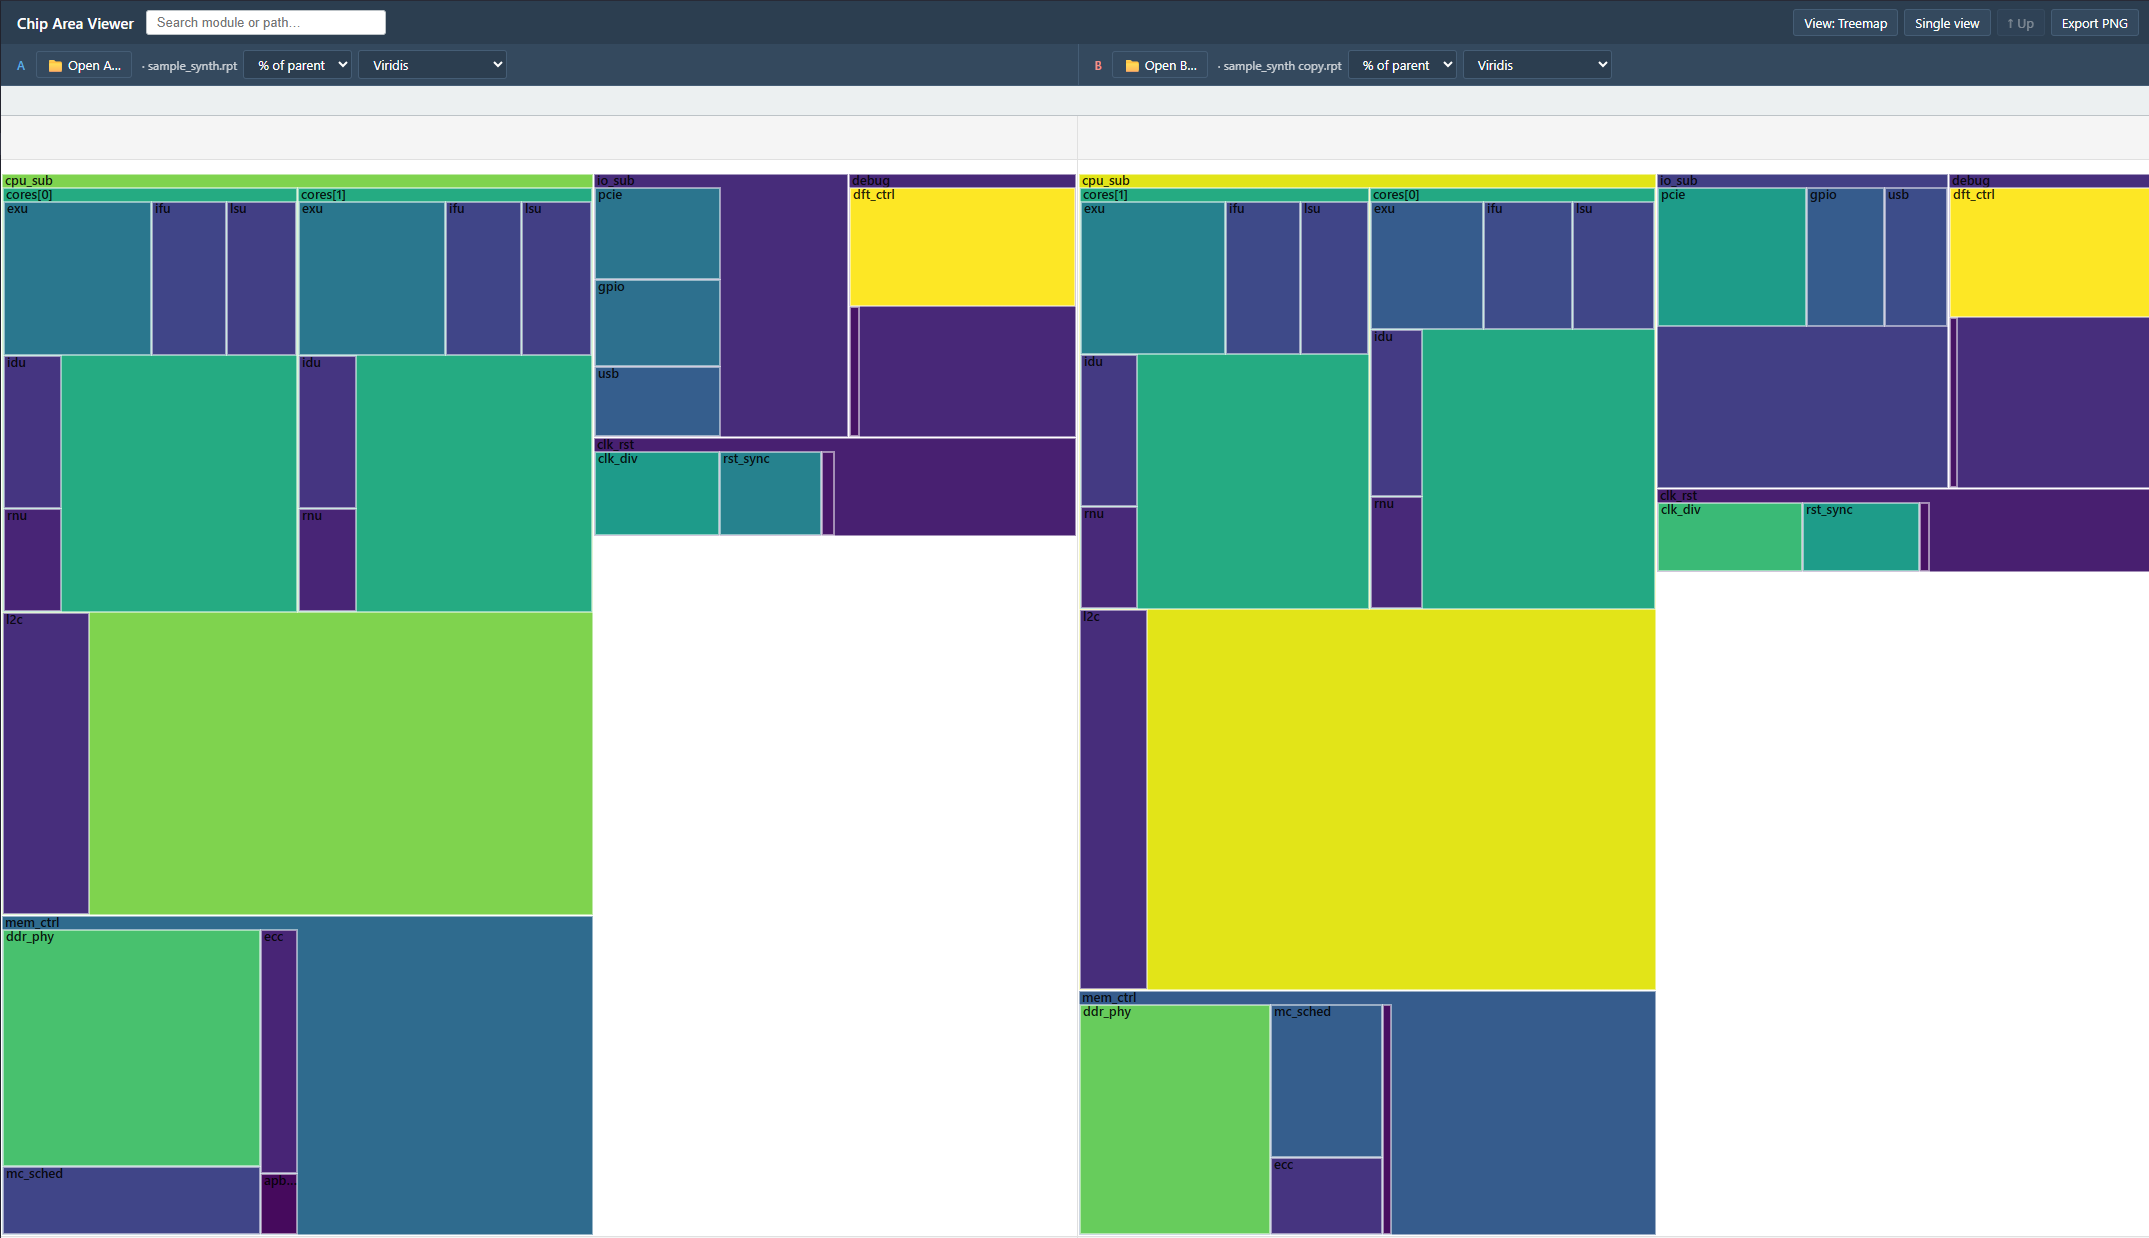
Chip design reports (*.rpt) are usually long text files that show area breakdowns by module. This extension renders them as:
A treemap — squares sized by area, click to drill down (good for spotting hot modules visually)
A list — expandable/collapsible table with Module / Area / % of parent / Cells (good for reading exact numbers)
For comparing two versions (e.g. baseline vs. after a code change), it has a compare mode with a diff column showing the % change per module (red = grew, green = shrunk).
How to use
Right-click any .rpt file in the explorer
Choose Open With → Chip Area View
The file opens in a treemap view
Click any module to drill in; use ↑ Up (or Esc) to go back
To compare two reports:
Click "Compare with another file" in the topbar to enter compare mode
Load the baseline in side A, the second report in side B
Switch to List view to see the diff column
Install
Search "Chip Area View" in the VS Code Extensions panel, or:
Browser mode — also works as a standalone HTML file (no VS Code needed); see the GitHub repo
Privacy
All processing happens locally. The extension reads your .rpt file and renders it inside VS Code. Nothing is sent to any server.
Known limitations
Only the DC report_area -hierarchical format is supported. Other .rpt files (DC timing reports, simulation logs, etc.) will show a "No hierarchical section found" error — open them as text instead.