Ruby Call Flow Visualizer
Understand Ruby and Rails execution flow without leaving VS Code.
Ruby Call Flow Visualizer statically analyzes the method under your cursor and opens an interactive graph showing what it calls next. It is built for navigating Rails codebases where behavior often jumps between controllers, service objects, jobs, mailers, models, and plain Ruby classes.
What It Does
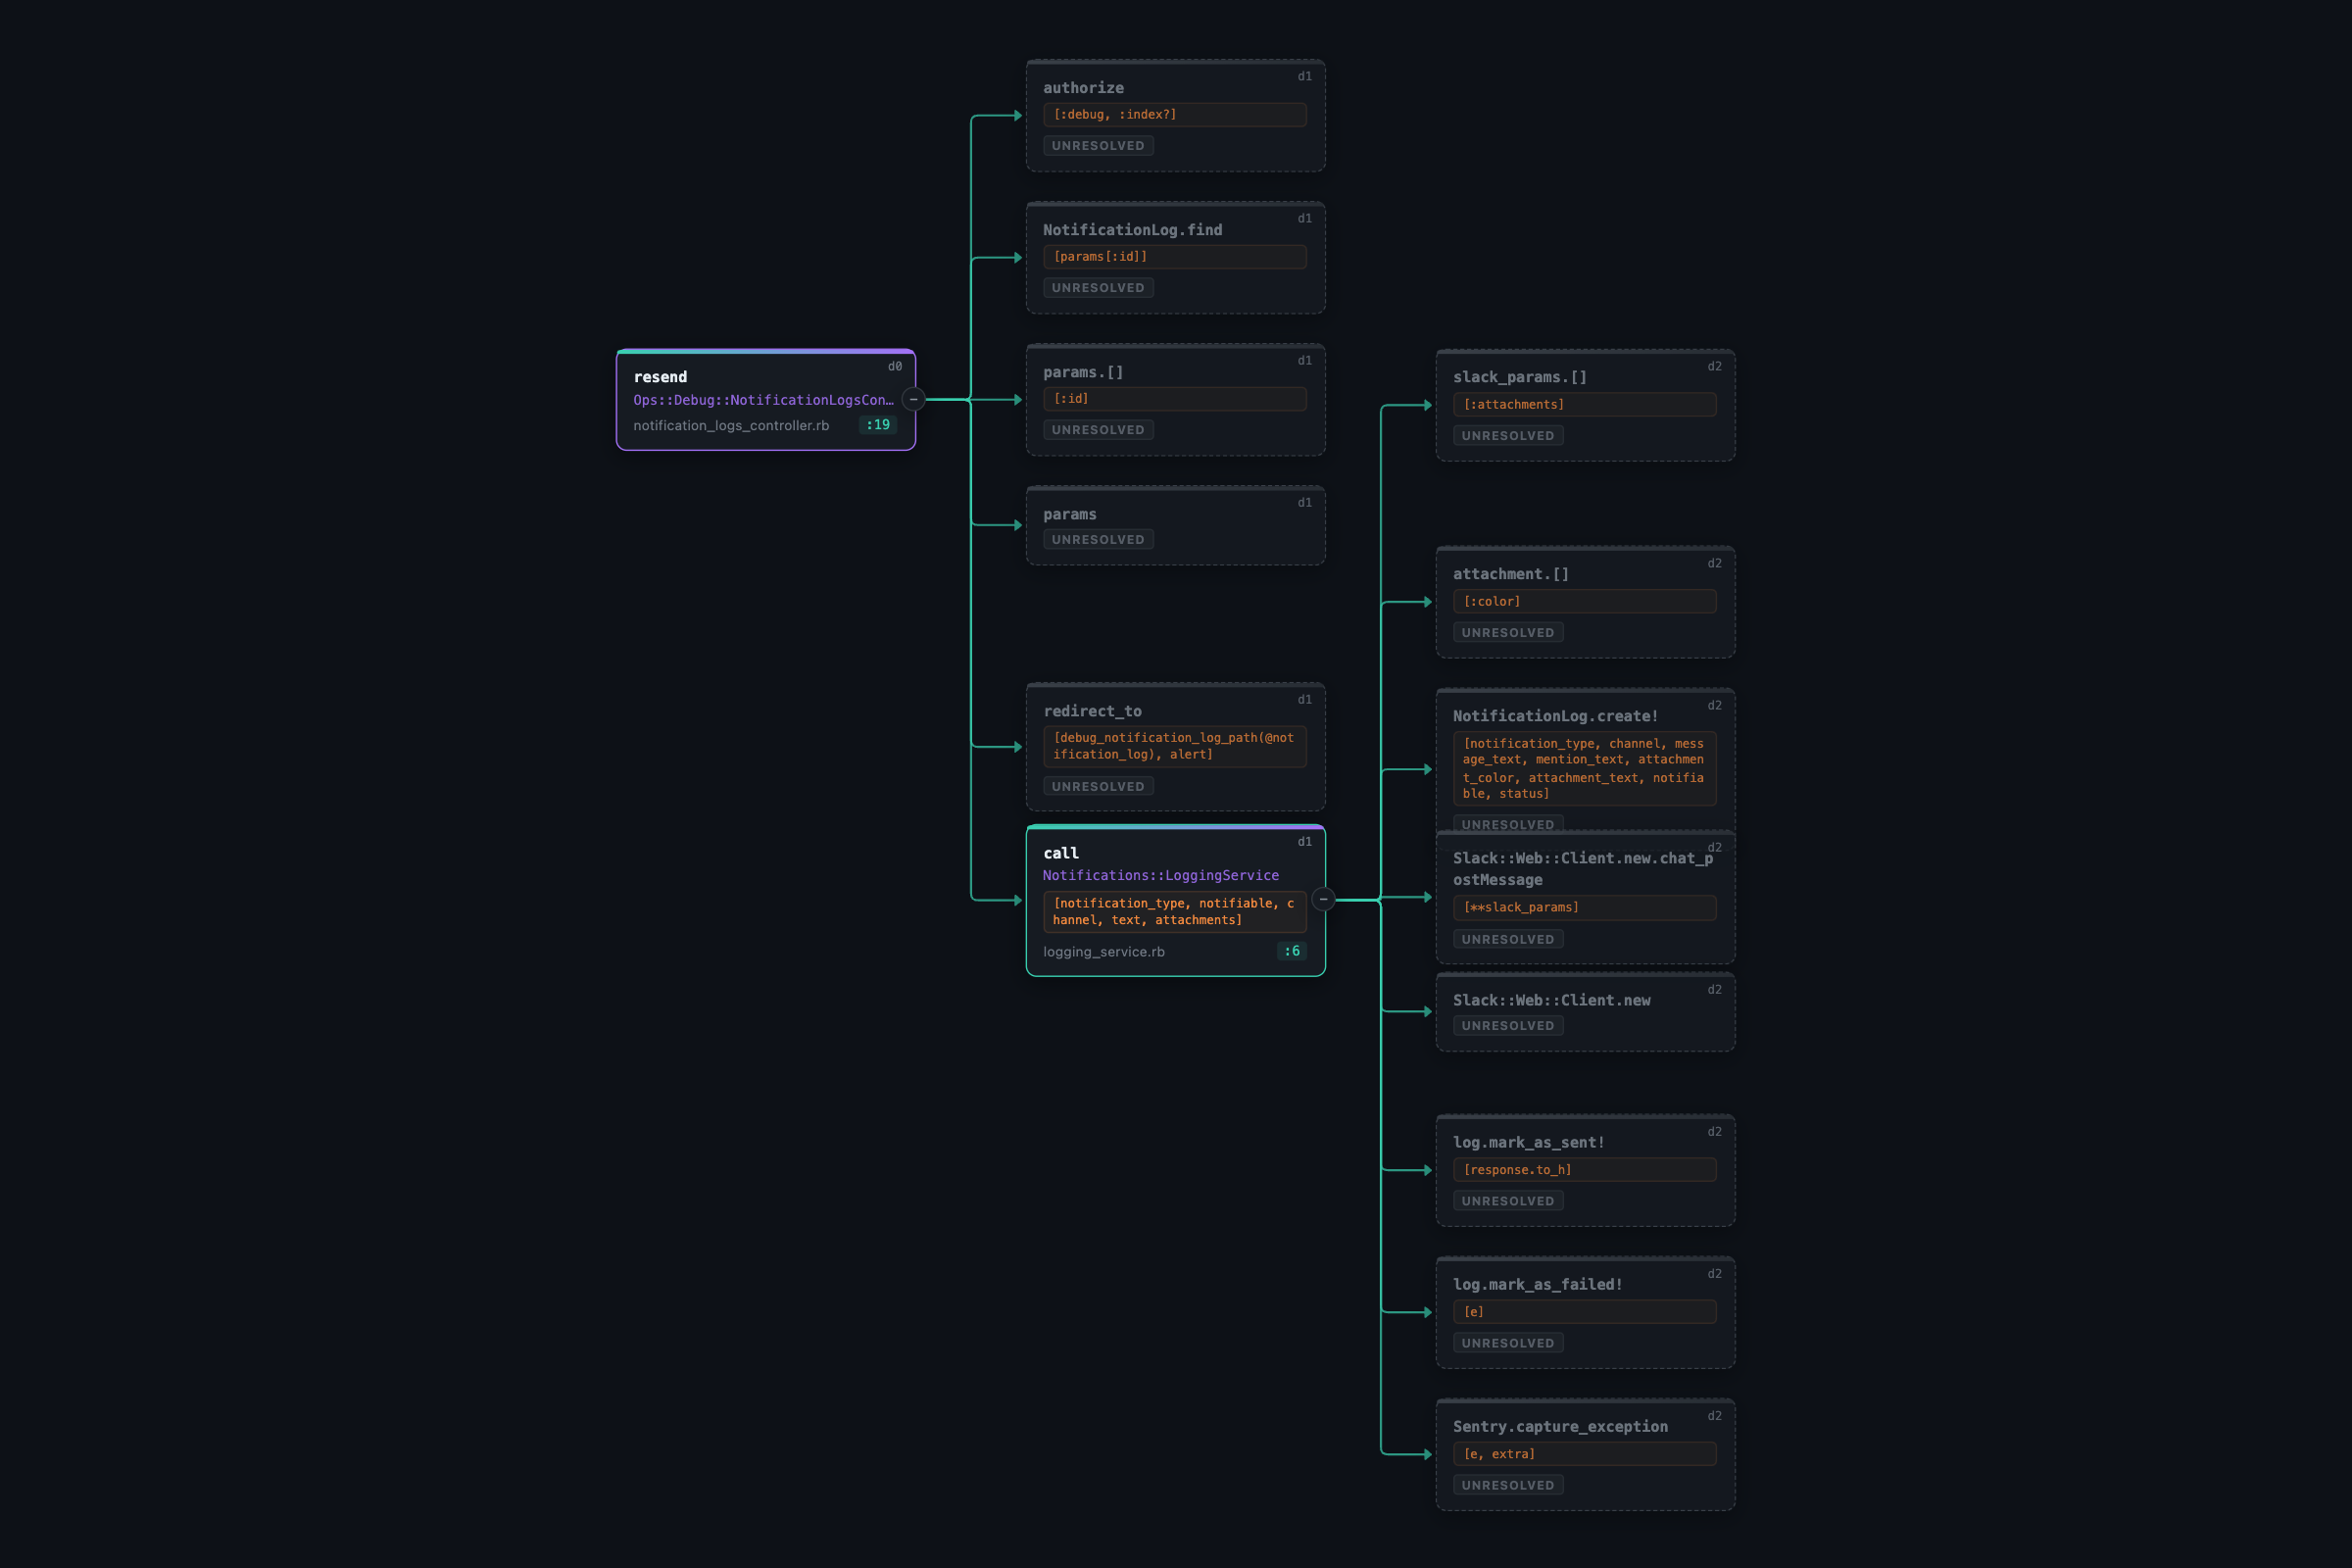
- Builds a call graph from the Ruby method under your cursor.
- Resolves common Ruby and Rails calls across project files.
- Shows nested calls recursively with a configurable max depth.
- Highlights resolved, unresolved, and starting nodes.
- Lets you zoom, pan, inspect, and navigate the graph visually.
- Opens source definitions from graph nodes when the target can be resolved.
Why Use It
Ruby and Rails apps can hide important behavior behind service objects, callbacks, background jobs, and convention-based file names. This extension gives you a fast visual map of the code path so you can answer questions like:
- What happens after this controller action runs?
- Which services, jobs, or mailers does this method trigger?
- Where does this call resolve in the codebase?
- Which calls are unresolved and may need manual inspection?
- How deep does this workflow go?
Usage
- Open a Ruby file in VS Code.
- Place your cursor inside a method.
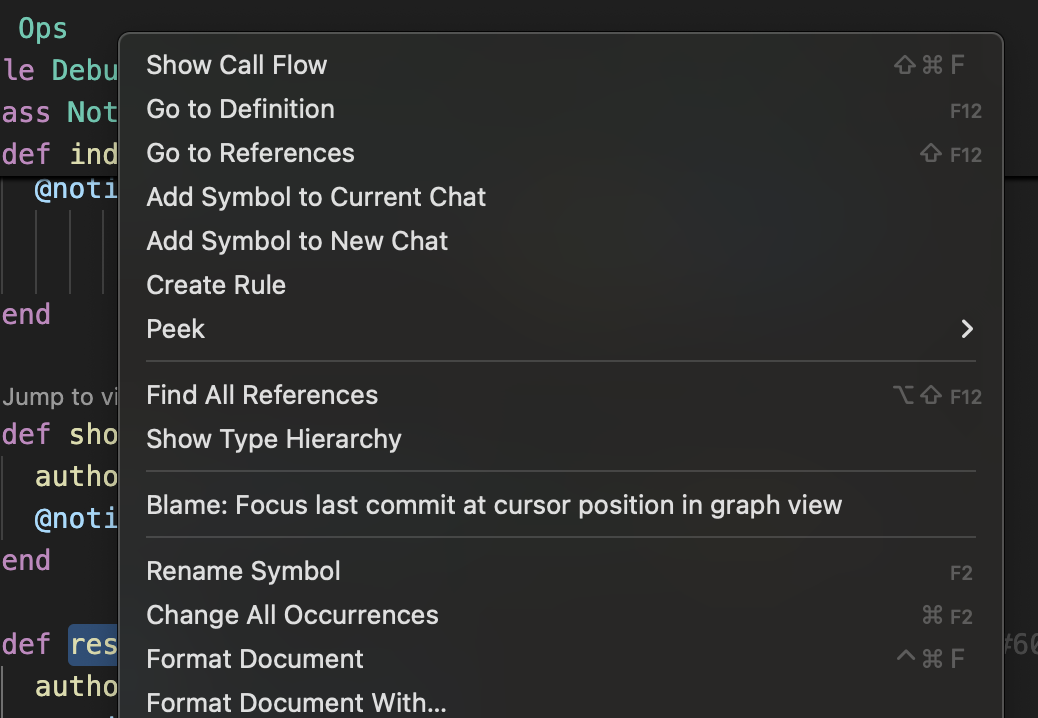
- Run Ruby Flow: Show Call Flow from the command palette, editor title button, or right-click menu.
- Use the graph panel to inspect the flow.
- Double-click a resolved node to jump to its source definition.
Default shortcut:
- macOS:
Cmd+Shift+F
- Windows/Linux:
Ctrl+Shift+F
Graph Legend
| Node style |
Meaning |
| Root node |
The method where analysis starts |
| Resolved node |
The extension found a matching source definition |
| Unresolved node |
The call was detected, but a source definition could not be found |
Supported Projects
Ruby Call Flow Visualizer works best with Ruby and Rails projects that follow common naming and file conventions. It can analyze:
- Controllers
- Service objects
- Jobs
- Mailers
- Models
- Plain Ruby classes and modules
The analyzer uses static analysis, so it does not run your application code.
Requirements
- VS Code 1.85 or newer
- Ruby available on your machine
- The
prism Ruby parser
If your Ruby executable is not available as ruby, set ruby-flow.rubyPath to the absolute path used by rbenv, asdf, mise, or your preferred Ruby manager.
Extension Settings
| Setting |
Default |
Description |
ruby-flow.rubyPath |
ruby |
Path to the Ruby executable |
ruby-flow.maxDepth |
5 |
Maximum recursive call depth |
ruby-flow.showUnresolved |
true |
Show calls that could not be resolved to source |
Notes
This extension uses static analysis. Dynamic Ruby features such as send, metaprogramming, runtime-defined methods, and complex framework magic may not always resolve perfectly. Unresolved nodes are kept visible so you can still see that a call exists and decide where to inspect next.