SlitherSlither: Solidity static analysis framework integration for Visual Studio Installation Launch VS Code Quick Open ( Ctrl+P), paste the following command, and press enter.Copied to clipboard |

Slither (Visual Studio Code Extension)Visual Studio Code integration for Slither, a Solidity static analysis framework. This extension offers Visual Studio Code integration for Slither, a Solidity static analysis framework written in Python 3. With Slither for Visual Studio Code, users can run a suite of vulnerability detectors on their Solidity smart contracts to annotate potentially dangerous code and receive suggested fixes. 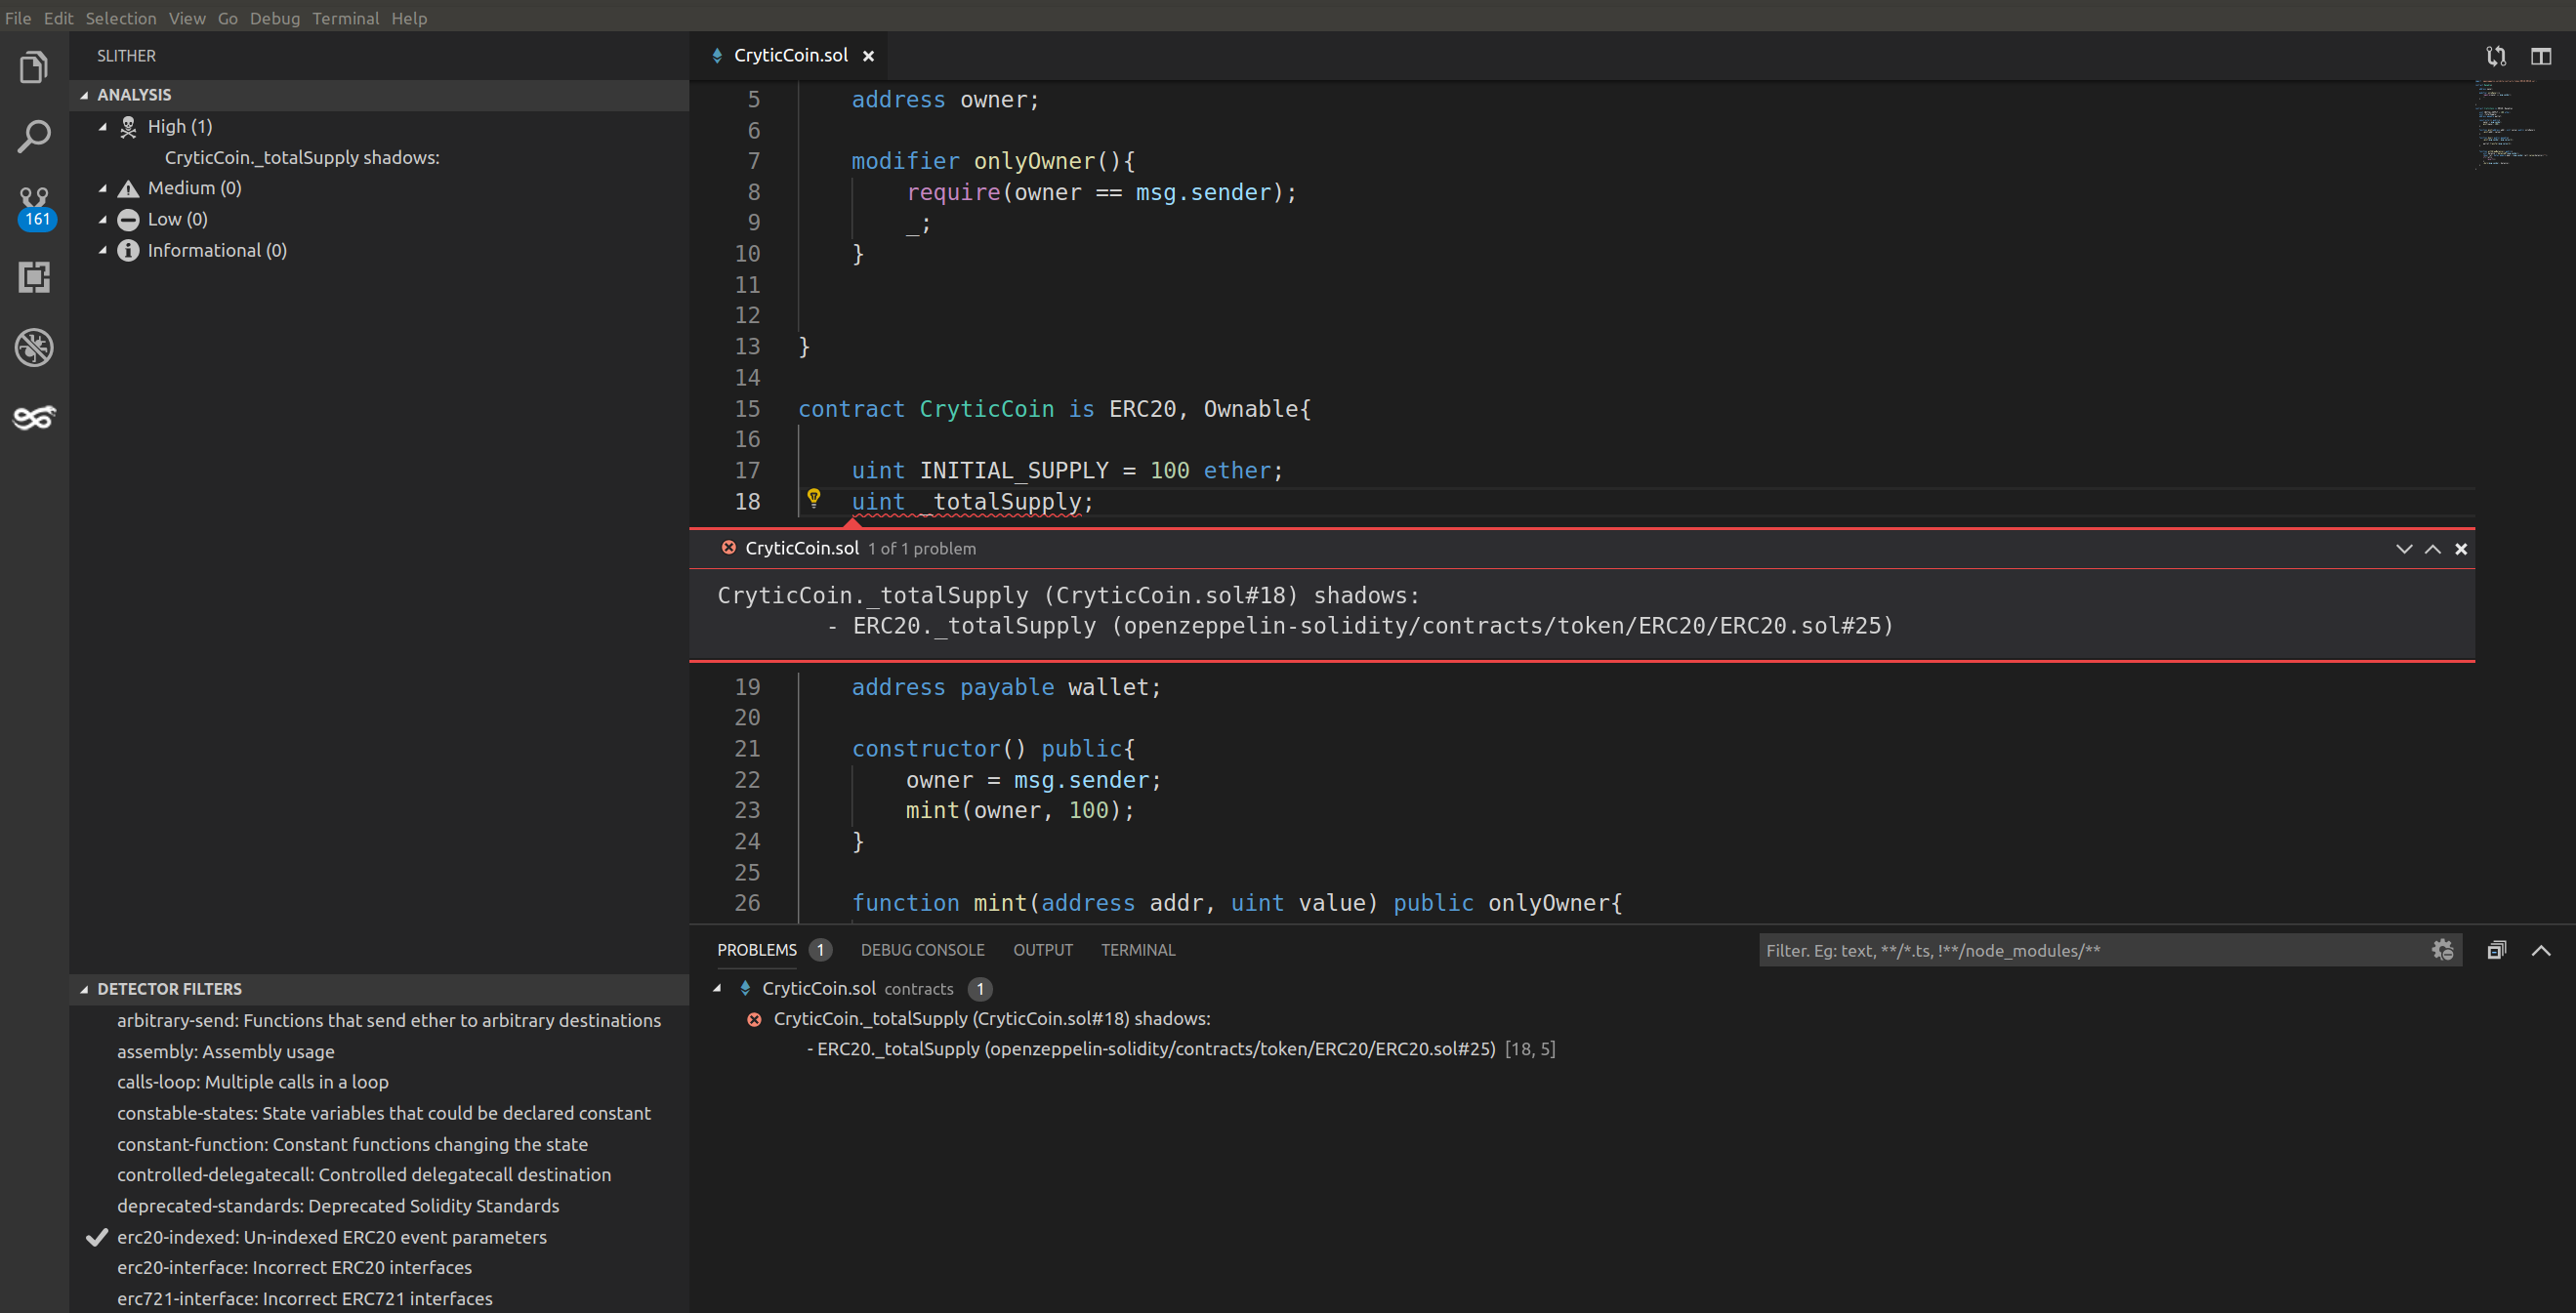
Features
Requirements
** Slither must be accessible via the InstallationFrom the Visual Studio MarketplaceInstall From source
Install the VSIX file in Visual Studio through Getting StartedAfter installing the extension, simply open a workspace containing any Solidity (*.sol) files. The extension will activate, revealing the Slither logo on the action bar. Click it to reveal a new container with a results explorer and detector filter tree. Hovering over the explorer tree will reveal buttons on the top title bar which can be used to run slither, refresh, change viewing mode, and delete results. Clicking a detector filter will toggle its visibility. Hovering over the detector filter tree will reveal a button with a flag icon, which is used as a toggle all button. Left clicking a result in the result explorer will navigate to the result's code. Right clicking it will reveal additional options such as displaying additional information. If source is changed since the previous slither run, and a source mapping mismatch occurs, the problem and its annotations will disappear and an "out-of-sync" icon will appear to the left of the result in the explorer tree, indicating slither analysis should be re-run. LicenseAGPL-3.0 |