Skip to content
| Marketplace
Sign in
Visual Studio Code>Programming Languages>MEM Log ViewerNew to Visual Studio Code? Get it now.
MEM Log Viewer

MEM Log Viewer

Torbenson Consulting

|
2 installs
| (0) | Free
| Sponsor
Finally, human-readable Intune and ConfigMgr (CMTrace-format) log files!
Installation
Launch VS Code Quick Open (Ctrl+P), paste the following command, and press enter.
Copied to clipboard
More Info

MEM Log Viewer

Finally, easy-to-read Microsoft Endpoint Manager (SCCM, Intune, ConfigMgr) logs in VS Code! Provides element and severity highlighting for a log format that isn't well-supported by most editors/viewers.

If you administer Microsoft Intune or SCCM/ConfigMgr, you already know files like IntuneManagementExtension.log, AppActionProcessor.log, smsts.log, and many others the ConfigMgr/Intune client and site servers produce. Their XML-like format is very difficult to read in plain text, and the purpose-built tools for doing so (CMTrace, etc.) aren't great on modern high-resolution displays.

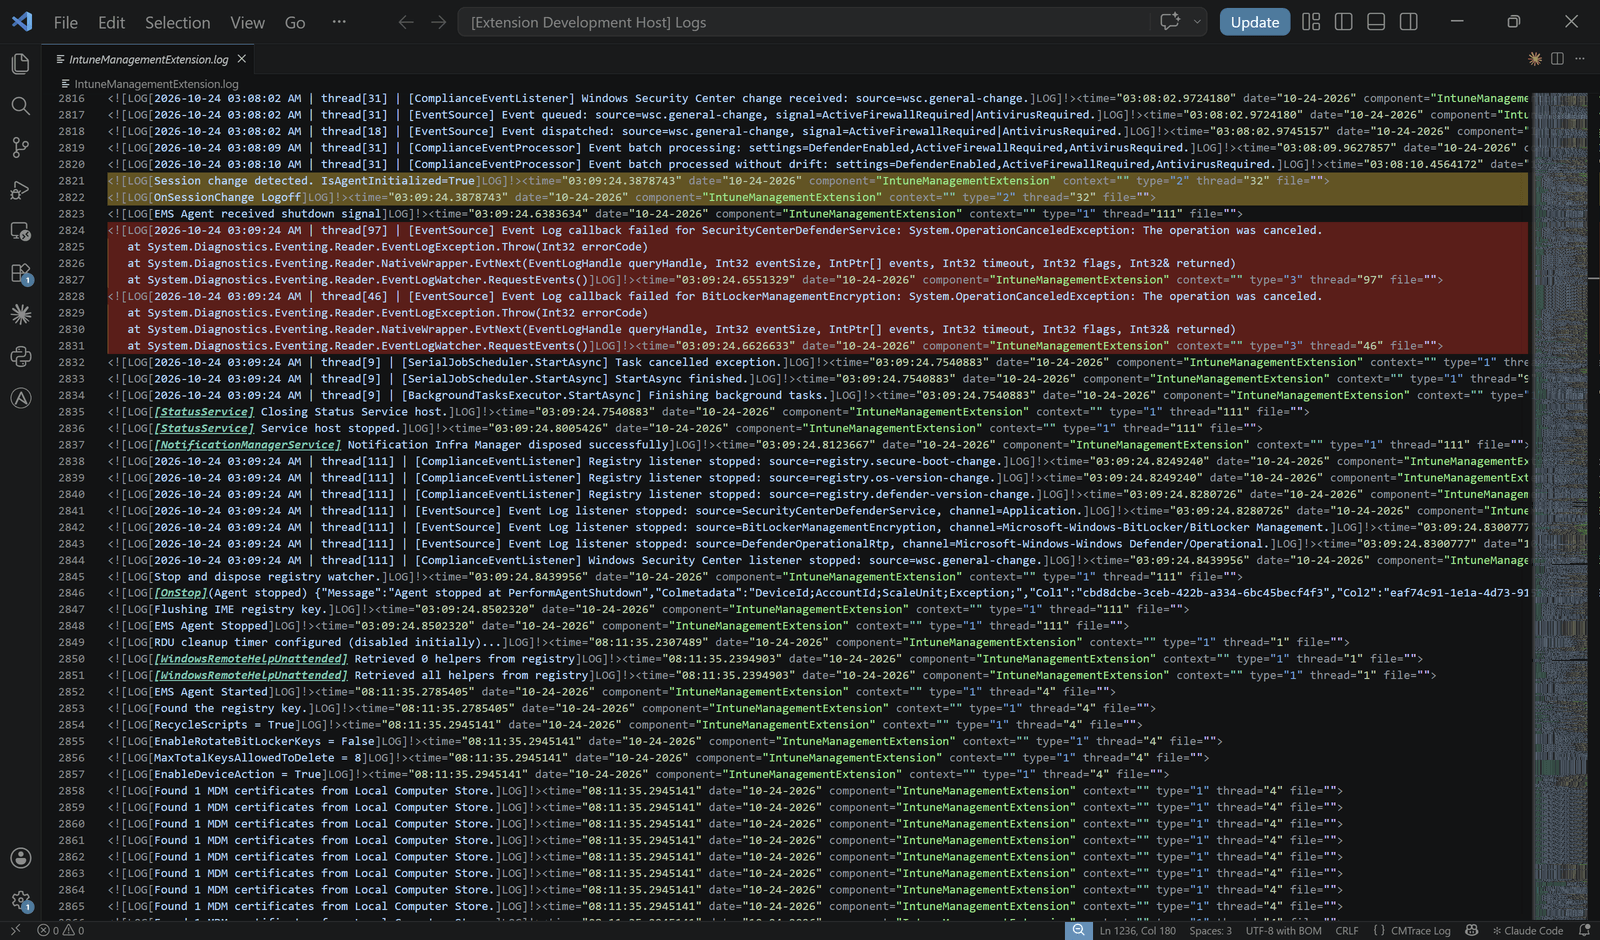
This extension provides VS Code-native coloring/highlighting for this file format, making it easy to quickly read a log in a scalable font size and identify useful information. It's perfect for the use case I often get, where I receive a bundle of Intune Management Extension logs to identify issues on systems I don't have direct access to.

MEM Log Viewer highlighting an IntuneManagementExtension.log file

Features

Tag highlighting for readability: The message body, timestamp, date, component, thread, context, and source file each get their own TextMate scope, so your theme colors them appropriately, saving your vision and sanity.

Sub-component tags are called out: The ConfigMgr/Intune family of products logs many messages with bracketed prefixes such as [Win32App][ActionProcessor]. That leading chain gets its own scope and is bolded by default, so you can scan down a log by sub-component and pick out useful messages.

CMTrace-style Warning and Error Highlighting: Records with type="2" are given a warning background and type="3" an error background, across every line of a multi-line message; large blocks of output that PowerShell writes into IME logs are highlighted in full so they stand out.

Automatic log content detection: VS Code's built-in log language claims the .log extension. This extension looks at the first line of the document and reassigns it to the cmtrace language when it finds a CMTrace regex pattern. It works on every ConfigMgr and Intune log — and on anything else emitting the same format. Rotated logs such as ConfigMgr's .lo_ files are picked up the same way.

Log summary: Run MEM Log: Parse Active Log File from the Command Palette for a count of Info, Warning, and Error records, plus the first few error messages. This is a quick way to find out whether a log is worth reading closely before you start scrolling.

Usage

Open any CMTrace-format log file. Highlighting applies automatically.

For example, in Windows, the Intune Management Extension logs live here:

C:\ProgramData\Microsoft\IntuneManagementExtension\Logs\

For an error summary, open the Command Palette (Ctrl+Shift+P) and run MEM Log: Parse Active Log File.

If a log file is not detected automatically, you can manually select cmtrace as your file language using VS Code's language selection command.

Settings

Setting Default Description
mem-log-viewer.enableHighlighting true Toggle the warning and error background highlighting. Syntax highlighting is unaffected.
mem-log-viewer.warningColor #ffc80033 Background for warning records (type="2"). Any CSS color value, including rgba().
mem-log-viewer.errorColor #ff000033 Background for error records (type="3"). Any CSS color value, including rgba().
mem-log-viewer.subComponentStyle ["bold"] Styles for leading sub-component tags like [Win32App]. Any combination of bold, italic, and underline; [] for none.

The default highlight colors are deliberately less intense so they tint the line rather than obscuring your theme's coloring. If you use a light theme and find them too faint, raise the last two hex digits.

The log format

Each CMTrace record looks like this:

<![LOG[message text]LOG]!><time="14:22:07.123456" date="10-4-2026" component="IntuneManagementExtension" context="" type="3" thread="12" file="">

type is the severity: 1 = Info, 2 = Warning, 3 = Error. Other values (4 = Verbose, for instance) exist but are not highlighted. This renderer currently doesn't rearrange the log file's order, but that's something I'm working on.

Known limitations

  • None yet (this is v1.0!)

Roadmap

  • CMTrace-style bottom panel or text flyout that reorders lines to be more readable and strips extraneous text and tags
  • More functional summarizer command (what's there is basically a placeholder in v1.0)
  • Improvements to rendering speed

Contributing

Issues and pull requests are welcome at github.com/torbenson/MEMLogViewer.

npm install
npm run compile   # or: npm run watch
npm test          # parser unit tests

Press F5 to launch the Extension Development Host, then open a log file in the new window. Ctrl+R reloads the window after a change.

If you change parsing behavior, add a test case to src/test/parser.test.ts. The malformed-input tests there encode defects and can help check for regressions. I ran this against a few Intune hosts and a sample SCCM site server's log directory, but I'm sure others trying this out in the real world will expose more issues and fixes are welcome!

License

MIT © Eric Torbenson

  • Contact us
  • Jobs
  • Privacy
  • Manage cookies
  • Terms of use
  • Trademarks
  • Your Privacy Choices
  • Consumer Health Privacy
© 2026 Microsoft