Token Pie
Will I still be able to work this week? That is the question a developer on
a metered Copilot plan actually has, and nothing GitHub ships answers it — the
billing dashboard is org-scoped, lagging, and silent on what to do differently.
Token Pie runs locally on each developer's machine, reads telemetry Copilot
already writes, and answers three things in order:
- Will I be throttled? Measured burn rate joined to live remaining quota,
projected against the reset date.
- What should I change? Findings derived from that machine's own spend,
each one carrying the measurement behind it.
- Where did it go? By model, by workspace, by whether you or Auto chose
the model, and weighted by what each kind of token actually costs.
Nothing leaves the machine. No server, no account, no telemetry of our own.
The allowance is your account's; the breakdown is only what Copilot Chat
records. The percentage and the meter come from GitHub and cover everywhere
you use Copilot. Everything below them is read from the trace databases
Copilot Chat writes, so any spend Copilot does not record a span for — the
agents window and Copilot CLI appear not to be recorded, github.com and other
computers cannot be — is invisible to the breakdown while still counting
against the allowance. The percentage can therefore fall while the breakdown
does not move. See What is traced, and what is
not.
Not affiliated with GitHub, Microsoft, or the Copilot team. Token Pie is
an independent tool that reads telemetry the Copilot extension writes locally.
Figures are reported by Copilot; the analysis and any advice are ours.
Getting started
Token Pie shows nothing until Copilot is asked to write its trace database
locally, which is off by default. Two commands, once:
Token Pie: Enable Local Trace Collection — writes the two settings
below for you and offers to reload.Token Pie: Check Quota — signs in to GitHub so the panel has a
denominator to project against.
Then use Copilot as usual. The status bar fills in on the next refresh, and
clicking it opens the report.
If you would rather set it by hand, this is all the first command does:
{
  "github.copilot.chat.otel.dbSpanExporter.enabled": true,
  // 0 (the default) means UNLIMITED prompt text on disk. Read "Content
  // capture" below before enabling this anywhere but your own machine.
  "github.copilot.chat.otel.maxAttributeSizeChars": 1
}
Recording starts now, not retroactively. Copilot keeps no cost history from
before the day you switch this on — see What it can and cannot
see.
What you get
The panel answers in the order the questions matter, and the status bar carries
the headline so you do not have to open it to know.
The verdict, first.
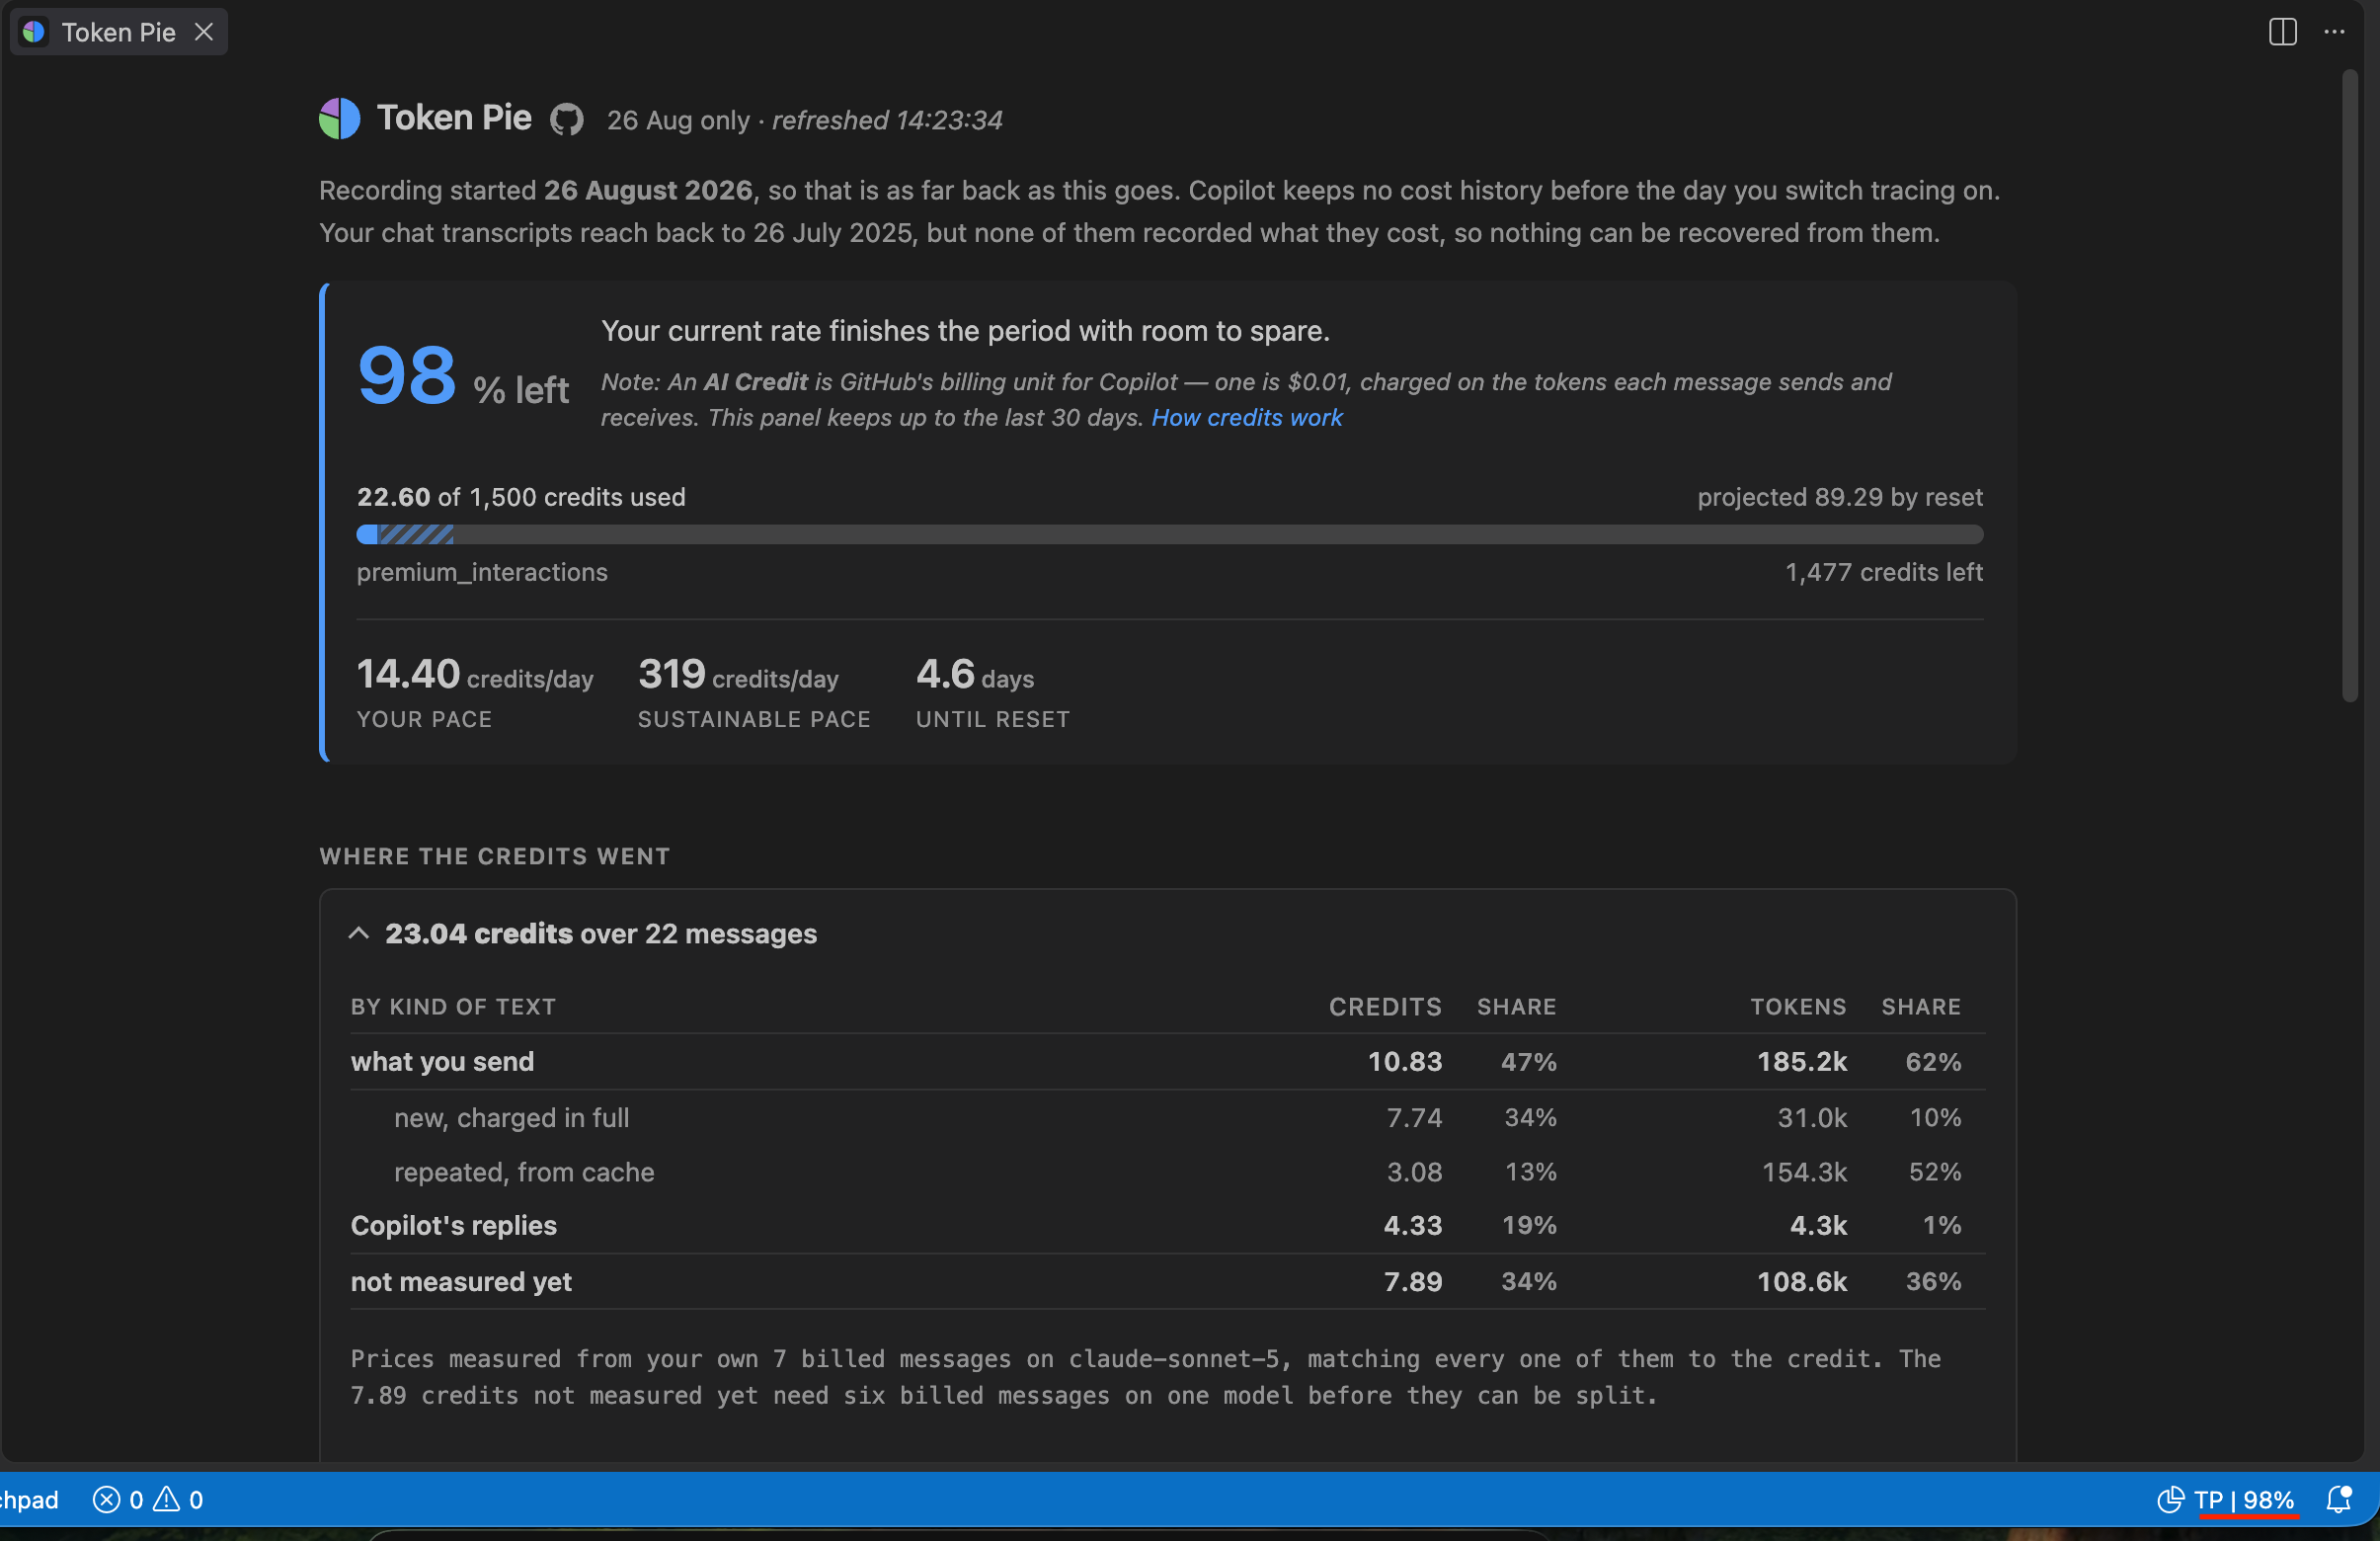
Your measured burn rate against what is actually left on your account, projected
at the reset date. Your pace beside sustainable pace is the comparison that
decides whether you finish the period — 12.50 against 551 credits a day here.
What you can pick, and what it costs.
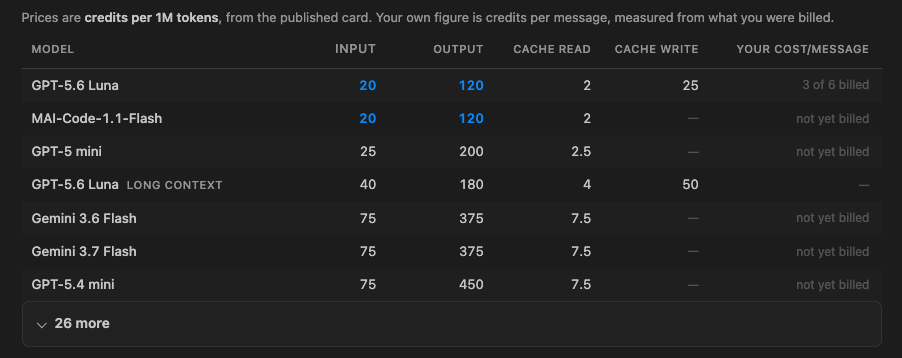
Every other view here is built from what you have already spent, so a model you
have not used appears nowhere — no help at all when an account comes back from a
reset with a different menu. This one lists what your editor says you can
actually pick, priced from the published card, cheapest first. The cheapest is
marked in input and output separately, because a model can be cheap to send to
and dear to hear back from — Luna at 20 in and 120 out against Sonnet 5 at 200
and 1,000. Your own cost per message sits beside the published rates once
enough messages have been billed to measure it, and says how many it still needs
when it cannot. A model you have used but can no longer pick is listed as not
offered rather than quietly dropped.
Without opening anything.
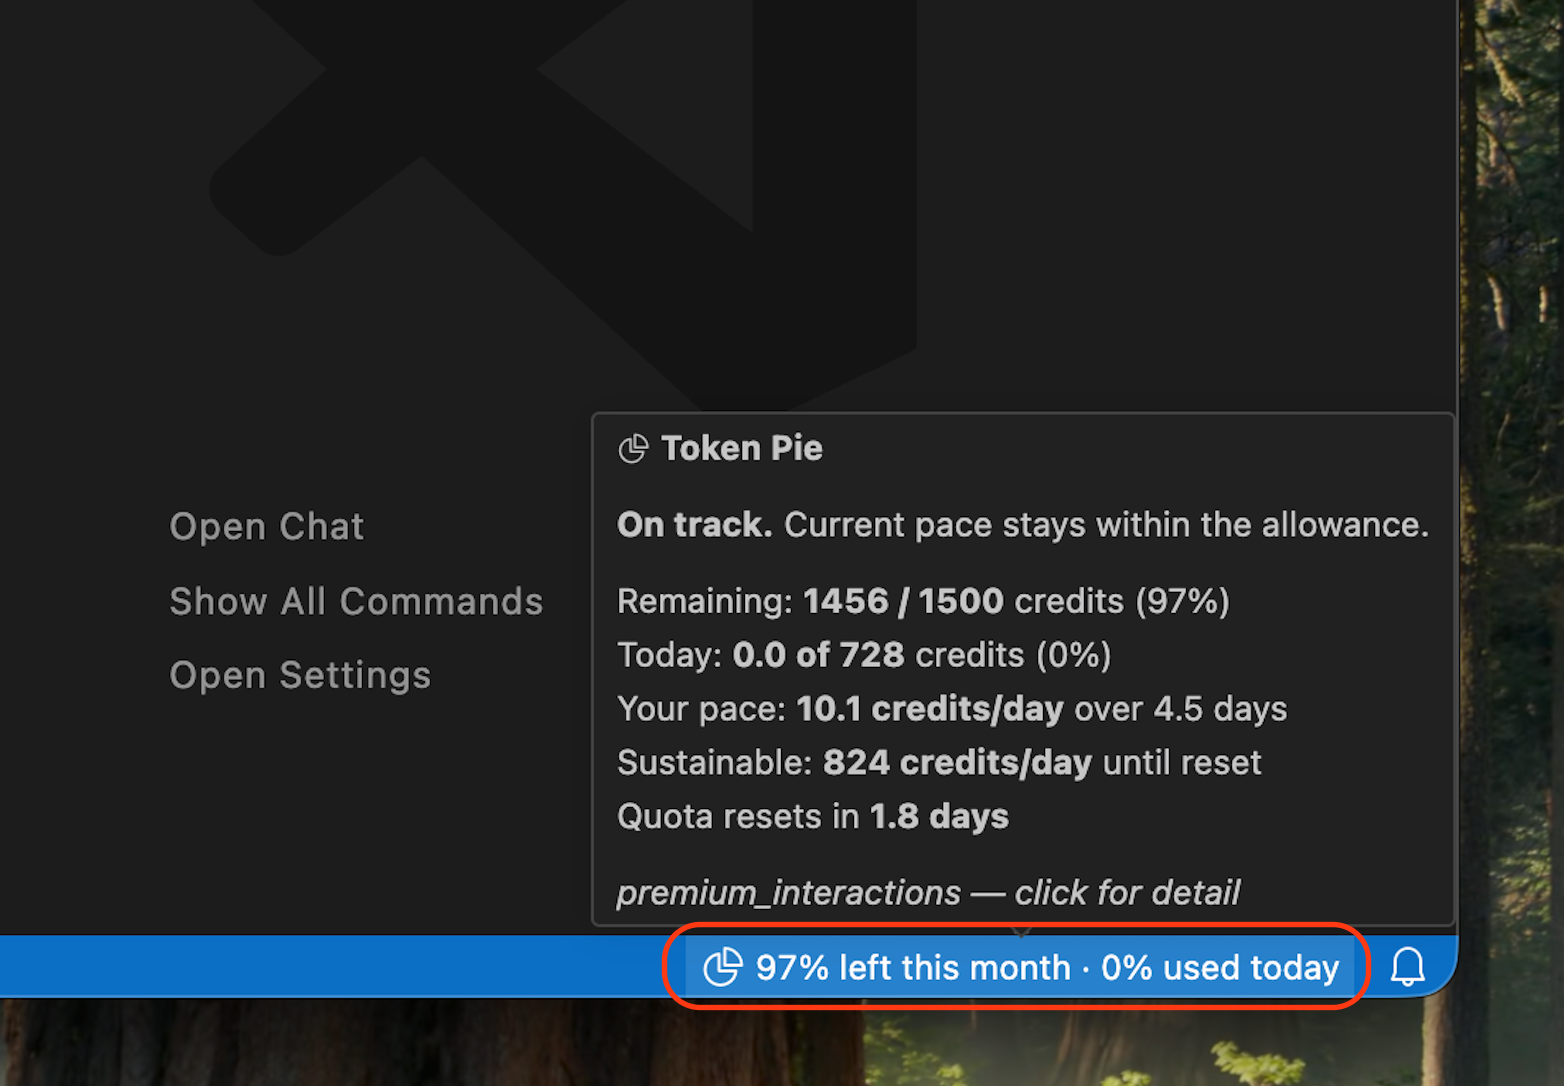
Two horizons on one item — 97% left this month · 0% used today — because the
month is a fact until the reset and the day is the only figure an afternoon can
still move. It takes the editor's warning or error colour when either one is
pressing, and the hover carries the rest: what remains, what today has cost
against its budget, your pace against a sustainable one, and when the allowance
comes back. Clicking it opens the panel above.
Where the credits went.
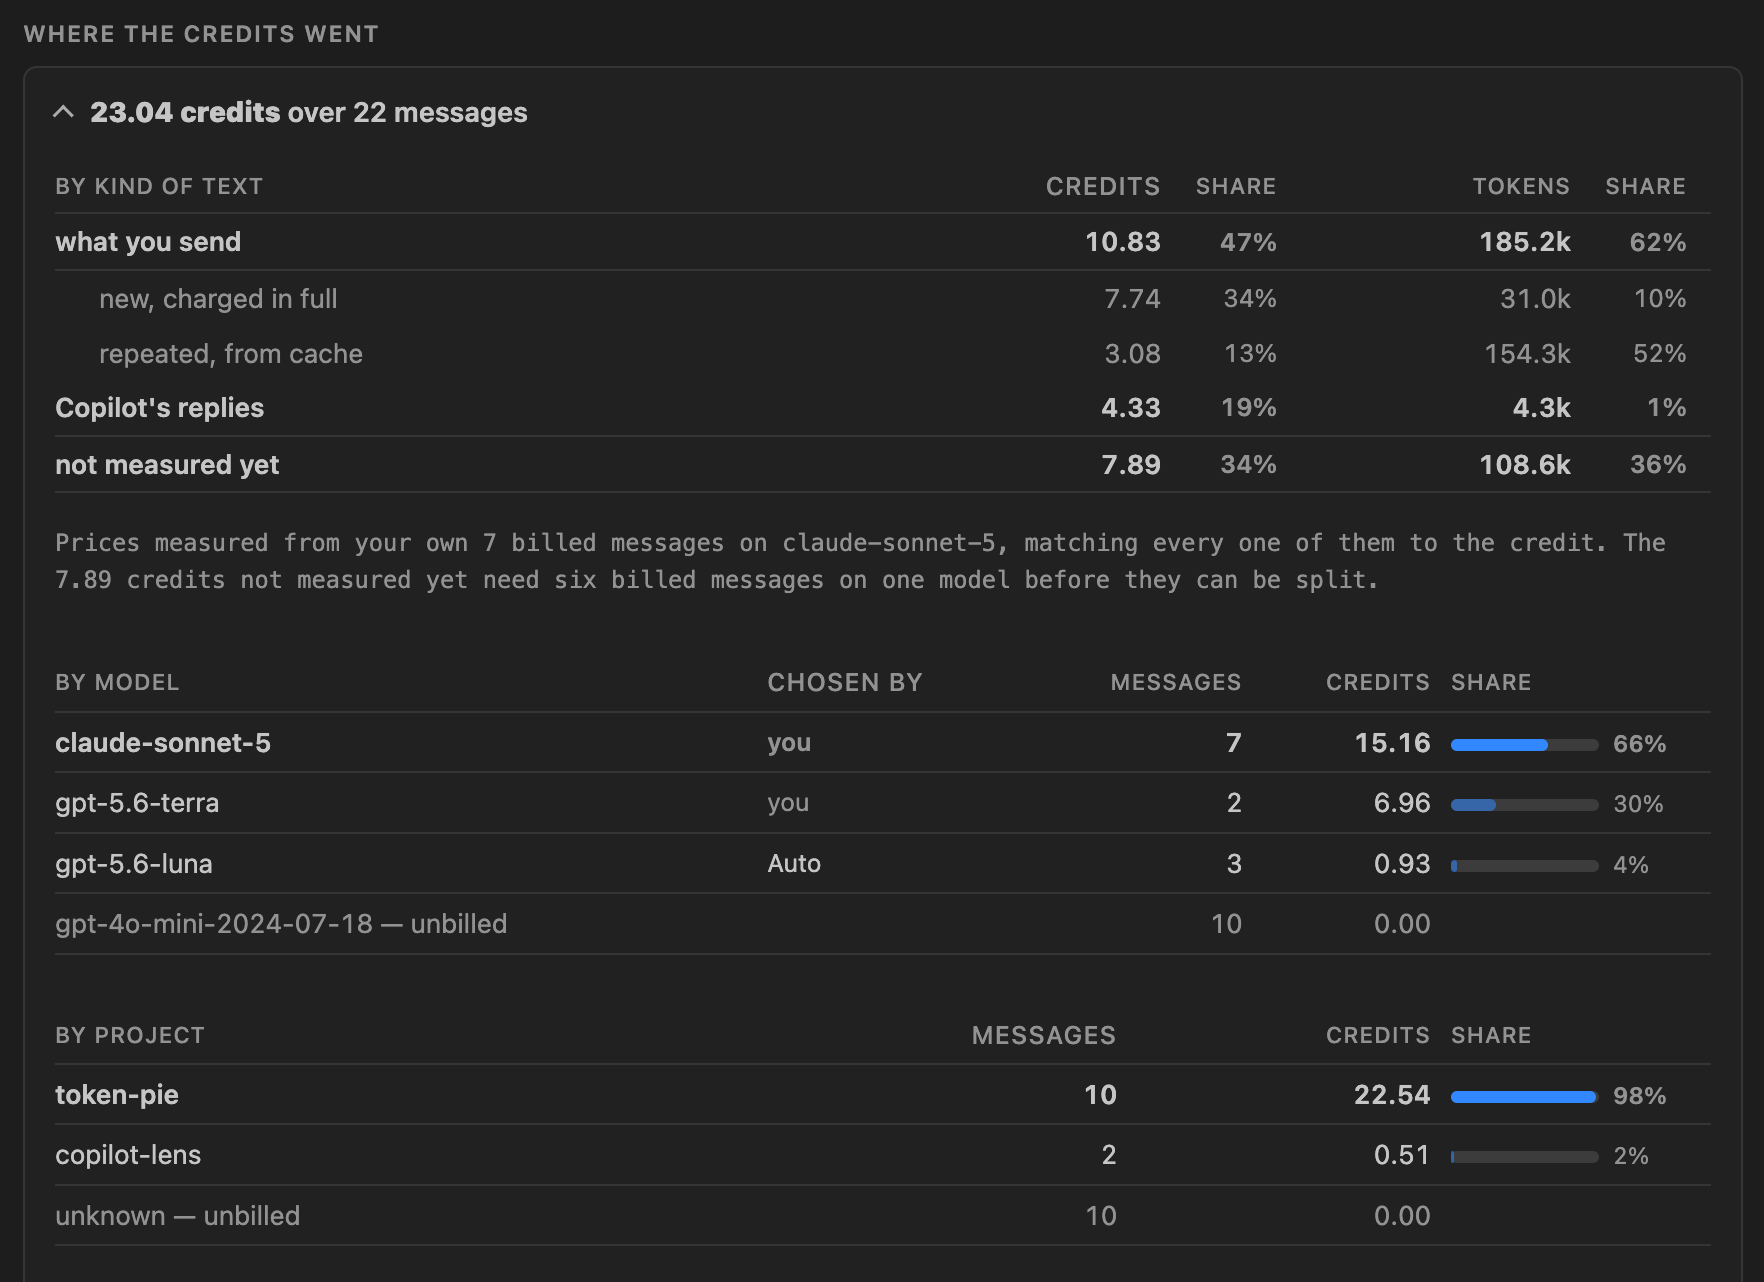
By kind of text, by model, and by project. Chosen by separates the models
you picked from the ones Auto picked for you. Prices are solved from your own
billed messages rather than read off a price list, so composition is weighted by
what each kind of token actually cost you. Per token states each row against
what you send: on claude-sonnet-5 here, cache reads at 0.08× and Copilot's
replies at 4× — which is why 1% of the text is 21% of the bill.
What to change.
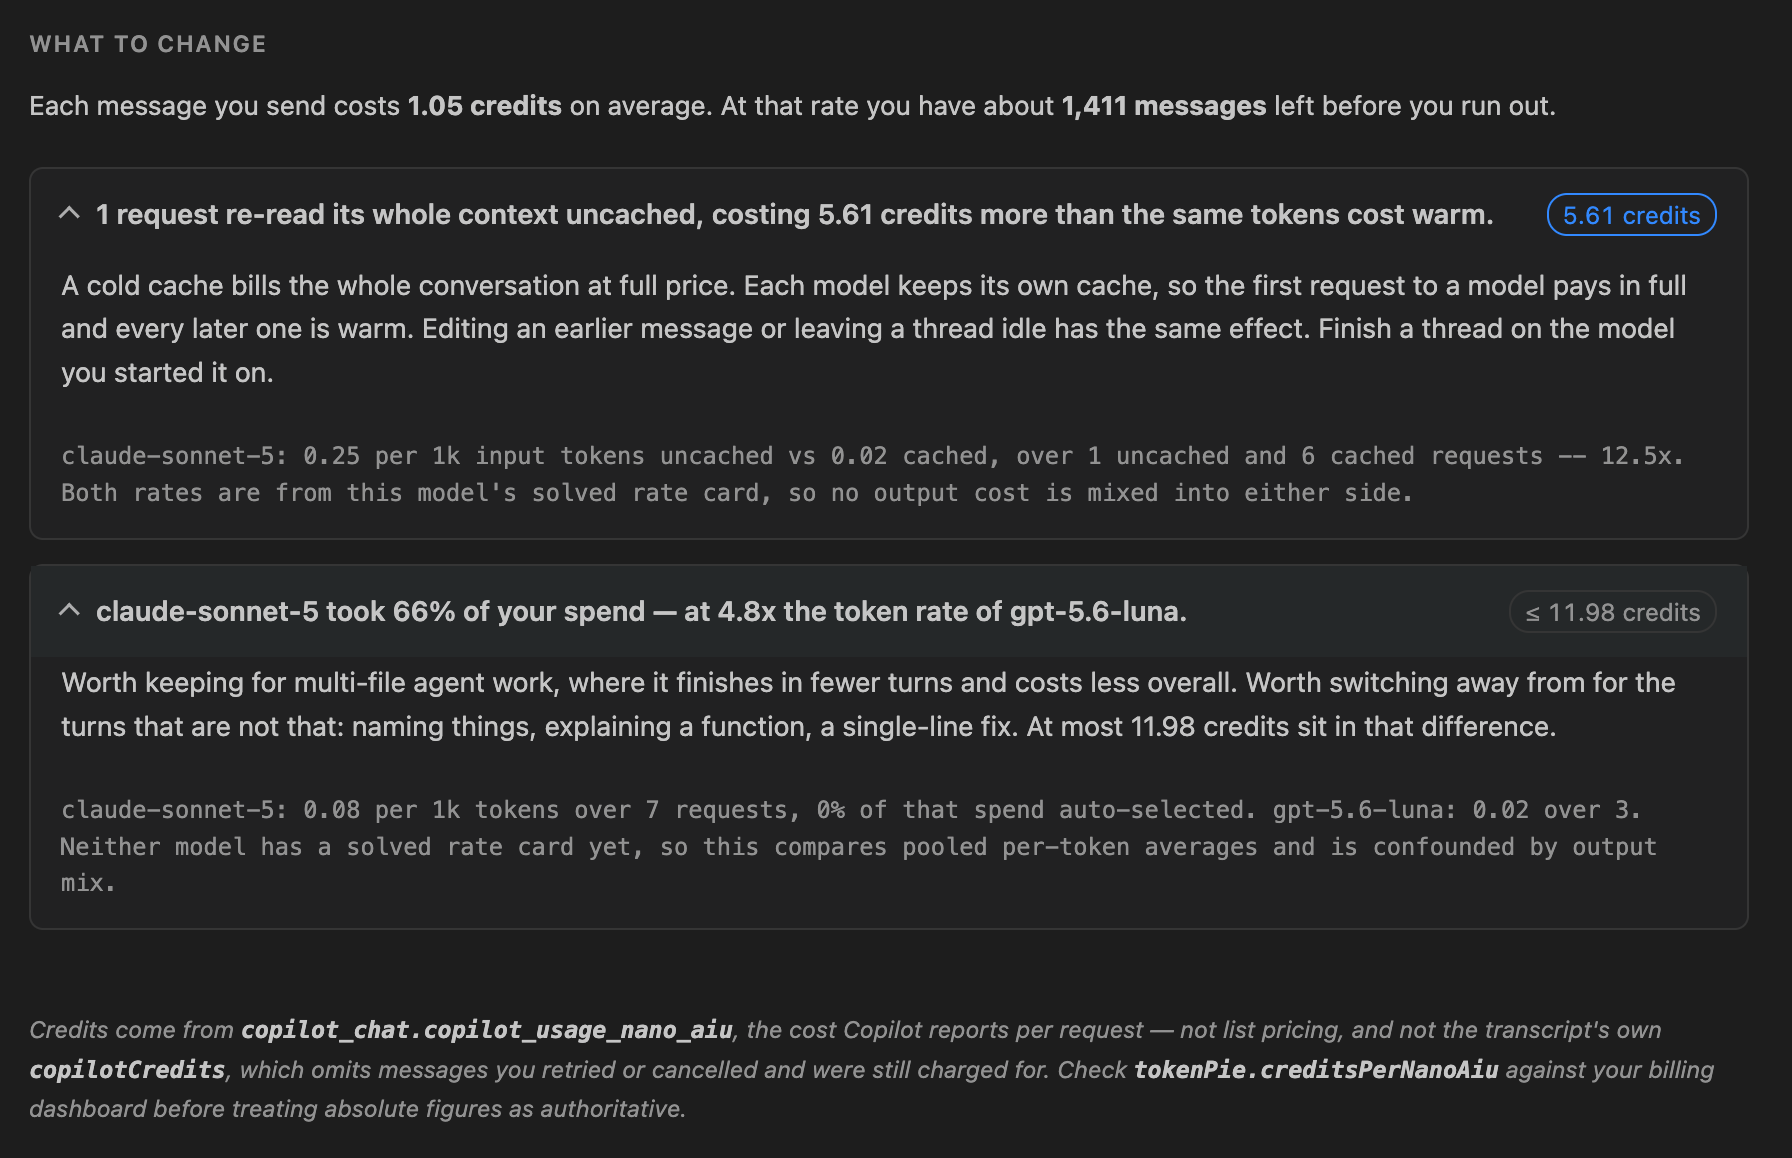
Findings derived from your own recorded spend. Each carries the credits at
stake and the evidence behind it, so you can check the arithmetic rather than
take it on faith. A figure marked ≤ is an upper bound rather than a
measurement, and never outranks something measured — a speculative saving should
not sort above money demonstrably already spent.
What makes the numbers different
Credits come from copilot_chat.copilot_usage_nano_aiu, the cost Copilot itself
reports per request — not estimated from public list pricing, and not
the chat transcript's copilotCredits.
That last distinction is the important one. copilotCredits records only
completed user turns, so retried and cancelled requests you were still billed
for never appear. Measured against a live quota delta on one agent session:
| source |
total |
agent-traces.db (what Token Pie reads) |
13.5631 |
| quota delta (ground truth) |
13.6000 |
chatSessions.copilotCredits |
6.1461 |
A ~55% shortfall on agent-mode work. Trackers built on the session files
inherit it. See docs/DECISIONS.md.
Cost is linear in the three token classes, so the per-class rates can be solved
for from your own requests. In testing this recovered
claude-sonnet-5 exactly — R² = 1.00000, max residual 0.0000 credits, and it
still reproduces to five decimal places on re-checking:
| token class |
credits per 1k |
relative to fresh input |
| fresh input |
0.25000 |
1× |
| cached input |
0.02000 |
0.08× |
| output |
1.00001 |
4.00× |
That changes what the numbers mean. On that same dataset, model output was 2%
of tokens but 16% of spend, and cached context 66% of tokens but 12% —
figures from one developer's month, quoted to show the size of the effect
rather than as a number to expect. Yours will differ: the machine this was
last checked on reads 1% and 19% for output, 84% and 25% for cache. Token Pie weights composition by cost wherever it has solved a card,
and says plainly when it has not. Nothing is taken from a published price list.
What you see
While it works, the status bar says so rather than going blank:
↻ usage             reading local usage
↻ history 24/61     reading chat transcripts
↻ allowance         asking GitHub what is left
The mark at the front is an icon, not a character: a ring that turns while it
reads, a pie once it has an answer, a warning triangle if something breaks.
They are drawn here as ↻ ◑ ⚠ because a page cannot show the real ones.
While it is working the item is not clickable — there is no report to open yet.
If anything goes wrong the mark becomes the warning triangle and clicking opens
the log.
The item appears the moment the extension activates, before any file or network
access, and the work behind it yields to the editor between each unit. Nothing
is ever chained behind the network call.
Status bar, once it settles:
◑ 98% left this month · 12% used today    on track
◑ 6.2d left · 88% used today              tight, yellow background
◑ 2.1d left · 140% used today             will run out first, red
◑ 5.0d to reset                           already used up, red
Two horizons: the month, and today against a daily budget. The month is named
only when it is itself a percentage, since that is the only time the two could
be read as the same measure. Severity is the background colour, not the
icon — there are three icons and they say what the extension is doing, not
how much you have left, so the item stays findable at a glance. Click for
the panel: the projection and allowance meter, ranked findings with the numbers
behind them, cost-weighted composition, and the by-model and by-workspace
breakdowns — one screen, no tabs.
Findings state the measurement they rest on, and whether it is exact:
1 request re-read its whole context uncached, costing 5.95 credits more
than the same tokens cost warm.
claude-sonnet-5: 0.25 per 1k input tokens uncached vs 0.02 cached, over 1 uncached and 6 cached requests — 12.5×. Both rates are from this model's solved rate card, so no output cost is mixed into either side.
A rate card needs six billed requests on one model. Below that, the same cards
fall back to pooled averages and say so.
What it can and cannot see
Copilot's trace database is written only from the moment you enable it and
holds nothing retroactively — a fresh install starts from zero no matter how
long you have used Copilot. Token Pie recovers what it can from VS Code's own
chat transcripts for the preceding 30 days. In testing, 38 of 42 transcripts
recorded no cost figures at all, so most history is simply not there. Recovered days are marked as a floor and never feed the throttle
projection.
What is traced, and what is not
The allowance figures — the percentage, the meter, credits left — come from
GitHub and cover everywhere you use Copilot. Everything below them is read
from agent-traces.db, the OpenTelemetry database Copilot Chat writes. The
question for any given piece of spend is therefore not where it happened but
whether Copilot Chat recorded a span for it.
Where it looks. Every agent-traces.db under your user account on this
computer: each VS Code install it finds (Stable, Insiders, and forks such as
Cursor) and each profile within them, including profiles you are not currently
using. It is not limited to the window it is running in.
What the code determines. These follow from how the extension reads, and
you can check them in src/locate.ts:
|
In the breakdown |
| Another VS Code profile, or Insiders alongside Stable |
Yes — every install and profile under your user account is scanned |
| Another computer, or another OS user account |
No — a different home directory, different databases |
Anything that writes no span to agent-traces.db |
No — there is nothing to read |
What has been observed. Copilot decides what to write a span for, and that
is not documented anywhere we can cite. The rest of this table is inference
from one developer's database, not a test:
|
In the breakdown |
On what basis |
| Copilot Chat panel |
Appears to be |
Billed spans with per-request cost show up while using it |
| The agents window |
Appears not to be |
A session's worth of agent work coincided with a large drop in the allowance and no billed span. Suggestive, not isolated — nothing ruled out concurrent use of another surface |
| Copilot CLI, github.com, coding agents |
Assumed not to be |
Nothing local runs, so nothing local records. Not tested |
| Inline chat, edit mode |
Unknown |
Not tested |
| Inline completions |
Not applicable |
Not billed as premium requests |
If you find one of these is wrong, the reconciliation line under Where the
credits went is the symptom to look for, and an issue with what you were
doing is more useful than any of the above.
When the two disagree, the panel says so rather than splitting the difference:
the reconciliation line under Where the credits went names the shortfall and
refuses to attribute it to anything it has not measured. If your allowance
drops while the breakdown does not move, that gap is the answer — something in
the table above spent it.
Status
Proof of concept, confirmed against a real database — github.copilot-chat
0.62.0, schema_version 1, on VS Code 1.134.0. Ingest, de-duplication,
per-model, per-workspace and Auto-vs-manual attribution all verified on live
spans. 244 automated checks.
Two caveats:
creditsPerNanoAiu is calibrated against one quota delta on one plan.
Evidence, not proof. See Calibration.- Free, Individual and Business quota shapes are covered by recorded fixtures,
including an exhausted Business seat. Enterprise is still unseen.
- Rate cards have so far been solved for a small number of models. The guards mean a
bad fit reports nothing rather than a wrong number, but "reports nothing" is
itself untested at scale.
For contributors and agents
CLAUDE.md — intent, invariants, and the findings that reversed
earlier assumptions. Read before changing anything.docs/ARCHITECTURE.md — module map, data-flow and
join diagrams, UI rules, upstream schema.docs/DECISIONS.md — what was believed, what the data
showed, what changed.
Content capture — read before enabling org-wide
Out of the box, the trace database stores your prompts, Copilot's responses,
system prompts, and tool-call results in plain text. Setting
github.copilot.chat.otel.captureContent to false does not stop it, and
that is not what the docs lead you to expect.
What the docs say
"When OTel export is disabled, the debug panel automatically captures full
prompt and response content. When OTel export is enabled, the
github.copilot.chat.otel.captureContent setting controls content capture for
both the debug panel and OTLP export."
— Monitor agent usage with OpenTelemetry
What copilot-chat 0.62.0 actually does
captureContent resolves correctly to false and is honoured on the BYOK
provider paths (Anthropic, Gemini). But the first-party Copilot chat path
writes content attributes with no captureContent check at all:
span.setAttribute(INPUT_MESSAGES, truncate(JSON.stringify([...]), max));
userRequest && span.setAttribute(USER_REQUEST, truncate(userRequest, max));
systemTexts  && span.setAttribute(SYSTEM_INSTRUCTIONS, truncate(...,  max));
span.addEvent("user_message", { content: truncate(userRequest, max) });
Confirmed empirically: with the startup log reporting captureContent=false,
gen_ai.input.messages held verbatim prompt text and gen_ai.system_instructions
held 1,162 bytes of system prompt. One trivial "hello" produced ~59 KB of
stored content across 6 spans. This looks like a bug against documented
behaviour and is worth reporting upstream.
The control that does work
Every content attribute is passed through a truncator, and that truncator is
driven by maxAttributeSizeChars unconditionally:
function truncate(s, max = 0) {
  if (max <= 0 || s.length <= max) return s;   // 0 = UNLIMITED, not "none"
  ...
}
The default of 0 means unlimited — which is exactly why full prompts land
on disk. So:
{
  "github.copilot.chat.otel.dbSpanExporter.enabled": true,
  "github.copilot.chat.otel.maxAttributeSizeChars": 1
}
1 truncates every string attribute to a single character. Reload to apply.
It covers most, but not all, of the content — see the next section.
Three call sites the setting cannot reach
maxAttributeSizeChars suppresses user prompts, system instructions, tool
arguments and tool results. It does not reach three writers, because they
call the truncator without passing a limit — and the parameter defaults to 0,
which means unlimited:
span.setAttribute(OUTPUT_MESSAGES,  truncate(JSON.stringify([...])))   // no max
span.setAttribute(TOOL_DEFINITIONS, truncate(toolJson))                // no max
span.addEvent("tools_available",  { toolDefinitions: truncate(json) }) // no max
All three are on the agent-loop path, so they fire once per agent turn.
Measured on a real turn:
| Survives truncation |
Size |
What it is |
gen_ai.output.messages |
106 B |
Model response text — actual content |
gen_ai.tool.definitions |
99.6 KB |
Copilot's own static tool schemas |
tools_available event |
103.8 KB |
The same static schemas again |
Worth separating the two problems. The tool schemas are not user data —
they are Copilot's built-in tool definitions, identical every turn — but at
~200 KB per agent turn they are the dominant driver of database growth. Only
gen_ai.output.messages is a genuine content leak, and it is narrow.
No setting suppresses these. Until it is fixed upstream, Token Pie removes
them after the fact — automatically after every ingest, and on demand:
npm run purge # or: Token Pie: Purge Retained Prompt Content
Auto-purge is on by default (tokenPie.autoPurge.enabled). A draft bug
report for the three call sites is in docs/upstream-issue.md.
Why running it constantly is cheap
Measured against a synthetic 400-agent-turn workload:
|
59.6 MB backlog |
steady state |
nothing to do |
DELETE attributes |
19.0 ms |
0.5 ms |
0.4 ms |
DELETE events |
6.0 ms |
0.1 ms |
— |
wal_checkpoint |
4.0 ms |
0.3 ms |
— |
VACUUM |
2.0 ms |
2.0 ms |
— |
| total |
34 ms → 0.56 MB |
2.9 ms |
0.4 ms |
The cost is self-limiting: purging continuously keeps the database near 0.5 MB,
so VACUUM never has a large file to rewrite. Three further guards keep it out
of the way:
- Probe before writing. A cycle with nothing to delete takes no write lock
at all and costs ~0.4 ms.
- Short busy timeout (250 ms). No longer offered as a setting — a
millisecond lock timeout is not a preference anyone can hold — but an
existing
tokenPie.autoPurge.busyTimeoutMs override is still read.
If Copilot holds the lock we skip and retry next cycle rather than stalling
the editor. Verified under a held BEGIN EXCLUSIVE: gives up at the timeout,
reports a skip, never hangs. The purge is idempotent, so a missed cycle costs
nothing.
- Deferred
VACUUM. Free pages are reclaimed only once ~256 KB has
accumulated. The manual command always reclaims.
This is the one place Token Pie writes to a database it does not own, and
the exception is deliberate: none of those rows are read by Token Pie, the
statements are bounded, and SQLite serialises writers. A locked database is
reported rather than retried into contention.
Deleting rows is not sufficient on its own. In WAL mode the superseded pages —
including the content just deleted — stay in the -wal file until a checkpoint
folds them in, so the purge checkpoints, vacuums, then checkpoints again.
Verified on a real database: 210 KB of rows removed, -wal truncated from
800 KB to 0, and no residual plaintext for apply_patch, "role":"assistant"
or system-prompt text anywhere in the file.
Nothing Token Pie needs is affected. Token counts and
copilot_usage_nano_aiu are written as numeric attributes and never passed
through the truncator, and models, session ids and operations are typed columns
on spans. Cost and usage reporting are unchanged.
The trade-off: the Chat Debug View's prompt inspection becomes useless,
since it reads the same truncated attributes. If a developer needs to debug a
prompt, they raise the value temporarily.
Deployment note: like dbSpanExporter.enabled, maxAttributeSizeChars has
no enterprise-policy precedence — it reads from the user setting or the
COPILOT_OTEL_MAX_ATTRIBUTE_SIZE_CHARS environment variable. Ship it via the
environment, settings sync, or let Token Pie write it (its setup command
does, and Diagnostics flags a value of 0).
Setup
1. Enable local trace collection
Add exactly this to your user settings.json:
{
  "github.copilot.chat.otel.dbSpanExporter.enabled": true,
  // 0 (the default) means UNLIMITED. See "Content capture" above.
  "github.copilot.chat.otel.maxAttributeSizeChars": 1
}
Then reload the window. Or run Token Pie: Enable Local Trace Collection,
which writes the setting and checks for the conflicts below.
Do not also set github.copilot.chat.otel.enabled.
Copilot resolves a local database-only mode as
dbSpanExporter && !enabledExplicitly && !fileExporterPath && exporterType !== "console".
Setting otel.enabled flips enabledExplicitly, which builds a real OTLP
HTTP exporter pointed at localhost:4318. The database is still written —
the SQLite processor is attached independently — but Copilot also retries
every span against a port nobody is listening on, for no benefit. The setting
description reads as though you should set both. You should not.
Leave github.copilot.chat.otel.captureContent at its default of false —
but do not rely on it alone. It does not gate the first-party chat path; see
Content capture.
2. Generate some data
Use Copilot Chat normally for a few requests. Spans are written as you go.
3. Confirm the schema
npm install
npm run probe
This prints the real table shape, every attribute key it finds, how many spans
carry a billed-cost attribute, and which attribute identifies the workspace.
Use the output to confirm or correct the candidate lists in
src/schema.ts and src/ingest.ts.
Troubleshooting: the log line that looks wrong
On startup Copilot logs something like:
[OTel] Instrumentation enabled — exporter=otlp-http endpoint=http://localhost:4318/ captureContent=false
This is cosmetic and expected, even in database-only mode. The message
interpolates config.exporterType and config.otlpEndpoint unconditionally,
regardless of which exporter was actually constructed. When database-only mode
wins, the span exporter Copilot builds is a no-op:
class { export(spans, done) { done({ code: 0 }); } ... }
Nothing is sent to localhost:4318. The SQLite processor is attached
separately and does the real work. Seeing that line means instrumentation came
up — which is what you want.
The database is created lazily on the first span flush, so it will not exist
until you send a Copilot Chat request. The setting also requires a reload, and
only windows started after the change pick it up — restart VS Code rather
than reloading a single window.
npm run probe distinguishes these cases and tells you which one you are in.
4. Run it
npm run compile
Then press F5, or package with npx vsce package.
Commands
| Command |
Does |
Token Pie: Enable Local Trace Collection |
Writes the setting, warns about conflicts, offers reload |
Token Pie: Show Usage Report |
The panel: throttle projection, allowance meter, ranked findings, composition, by-model and by-workspace |
Token Pie: Refresh Now |
Forces an ingest |
Token Pie: Diagnostics |
Settings state, databases found, detected schema, ingest counts |
Token Pie: Check Quota |
Reads copilot_internal/user for your live entitlement |
Token Pie: Purge Retained Prompt Content |
Deletes model output and tool schemas the truncation setting cannot reach, and reclaims the space |
Token Pie: Token Specs |
Every price, threshold and conversion behind the panel, and which of them is currently withholding something |
Token Pie: Refresh Published Prices |
Fetches the published rate card now instead of waiting for the weekly check |
Token Pie: Show Logs |
The output channel, where ingest problems are recorded |
The status bar shows the same figures in every window — the month's remainder
or the days of headroom, and today against its budget. Click for the panel.
How it works
agent-traces.db  ──read-only──▶  ingest  ──▶  rollup.json  ──▶  projection  ──▶  panel
(written by Copilot)             schema        (day × model ×     advice        status bar
                                 detection      workspace ×          ▲
                                                operation ×          │
                                                selection)     copilot_internal/user
Full diagrams in docs/ARCHITECTURE.md.
agent-traces.db lives in the Copilot extension's globalStorage, not
workspaceStorage:
~/Library/Application Support/Code/User/globalStorage/github.copilot-chat/agent-traces.db
That is the reason this is useful. Global storage is per profile, so every
window, folder and repository on the machine writes to one database. A developer
with eight windows open across eight repos produces one unified stream, and
spans still carry workspace attributes — so you get per-repo breakdown without
per-repo fragmentation.
Token Pie enumerates every install channel (Stable, Insiders, forks) and
every profile, plus the tmpdir fallback the exporter uses when globalStorage is
unavailable.
The actual schema
spans carries first-class typed columns — no JSON parsing needed:
span_id  trace_id  parent_span_id  name  start_time_ms  end_time_ms
status_code  status_message  operation_name  provider_name  agent_name
conversation_id  request_model  response_model  input_tokens  output_tokens
cached_tokens  reasoning_tokens  tool_name  tool_call_id  tool_type
chat_session_id  turn_index  ttft_ms
Only the long tail lives in span_attributes (span_id, key, value). Copilot
Lens reads the columns directly and dips into that table for exactly one thing:
copilot_chat.copilot_usage_nano_aiu, the billed cost.
Design notes
Only the billable span is counted, and its name is discovered. This is
load-bearing. An agent turn also emits an invoke_agent span that repeats its
child's token counts verbatim — the same 18,183 input tokens on both — while
carrying no cost attribute. Counting every span with tokens would double every
agent turn. execute_tool spans carry no tokens at all.
The filter used to be the literal chat, which matched nothing on a machine
holding execute_tool, embeddings and invoke_agent and no chat — and
said nothing, because the query reporting when recording began is unfiltered.
The name was never what separated them: only the billable span carries the
cost attribute, so Token Pie asks each database which operation names carry it
and counts those.
Workspace comes from a session bridge, not an attribute. No span records
the workspace. Spans carry chat_session_id, and VS Code stores chat sessions
per workspace, so:
workspaceStorage/<hash>/chatSessions/<session-id>.jsonl
workspaceStorage/<hash>/workspace.json  ->  { "folder": "file:///path/to/repo" }
Sessions that cannot be resolved report unknown rather than a guess. Copilot's
auxiliary calls have no session id, so they legitimately land there.
agent_name is the most interesting dimension. It separates the request you
made (panel/editAgent) from the calls Copilot makes on your behalf (title,
progressMessages). On real data those auxiliary calls run on gpt-4o-mini and
report zero cost — which is exactly the kind of thing a report should show
rather than leave people guessing about.
Read-only, always. Every open VS Code window runs its own extension host
writing to that database. Token Pie never opens it for writing.
Rollup, not re-query. Ingest is incremental against a watermark, with a
five-minute overlap window and timestamp-keyed span-id de-duplication. Results
collapse to (day, model, workspace, agent) in our own store, which bounds our
storage regardless of how large the upstream database grows.
BigInt everywhere. start_time_ms is milliseconds and fits in a double, but
token counts and nano-AIU are INTEGER, and node:sqlite throws outright on
anything past Number.MAX_SAFE_INTEGER rather than truncating. Every statement
opts into setReadBigInts(true).
Schema verified, not assumed. Required columns are checked at runtime and
schema_version is recorded. Missing optional columns degrade to zero or
unknown; missing required ones fail loudly rather than reporting confidently
wrong numbers.
Coverage and limits
Know these before promising anything org-wide.
- Per profile. Multiple VS Code profiles produce multiple databases. Handled
— but worth knowing they are separate.
- Per install channel. Stable, Insiders and forks have separate roots.
- Remote work is the real gap. Under Remote-SSH, devcontainers or
Codespaces, the Copilot extension host runs remotely, so the database is
written on the remote machine. Install Token Pie there to capture it.
- VS Code only. Copilot CLI, JetBrains, Xcode and github.com chat are
invisible.
- Chat and agent operations only. Inline completions and next-edit
suggestions are not in this stream. They are also not credit-billed on paid
plans, so cost coverage stays close to complete even though usage coverage
does not.
Stability
Depend freely on gen_ai.* attributes — that is the OTel GenAI semantic
convention and it is stable.
Treat these as versioned internal surface that can move in any monthly Copilot
release, and feature-detect accordingly:
copilot_chat.copilot_usage_nano_aiu — the only source of real billed cost- the
spans table shape and schema_version
- the globalStorage path
- the
chat_session_id → workspaceStorage bridge
Verified against github.copilot-chat 0.62.0, schema_version 1, on
VS Code 1.134.0. When the cost attribute goes missing the report says so
rather than quietly reporting zero, and token counts still work.
Calibration
tokenPie.creditsPerNanoAiu defaults to 1e-9, which assumes nano-AIU means
10⁻⁹ AI Credits. This has not been verified against a real bill. On observed
data, one 18,183-token request on gpt-5.6-luna reported 456,240,000 nano-AIU
— 0.456 credits, or about $0.0046, under that assumption. Compare a
day's reported total against your GitHub billing dashboard and adjust before
treating absolute figures as authoritative. Relative figures — which model,
which repo, which day — are unaffected by the constant.
Development
npm run selftest   # end-to-end against a synthetic database
npm run probe      # dump the real schema
npm run verify     # prove content is suppressed AND usage data survives
npm run purge      # delete the content truncation cannot reach
npm run watch
npm run build
npm run verify is the one to hand a security reviewer. It asserts both halves
at once — that no content-bearing attribute exceeds a single character, and
that token counts, models, session ids and billed cost are all still present —
and exits non-zero if either fails.
scripts/selftest.mjs builds a fixture database and asserts schema detection,
tool-span exclusion, de-duplication, incremental ingest, persistence across
restart, graceful degradation when the cost attribute is absent, and report
rendering.

