Stack Trace Analyzer — clickable stack traces





Analyze Stack Trace, like in IntelliJ IDEA — for VS Code. Copy any stack trace or traceback, run one
command, and every frame becomes a link straight to the line in your code. Any language, any source:
CI logs, Sentry, Slack, a colleague's message.
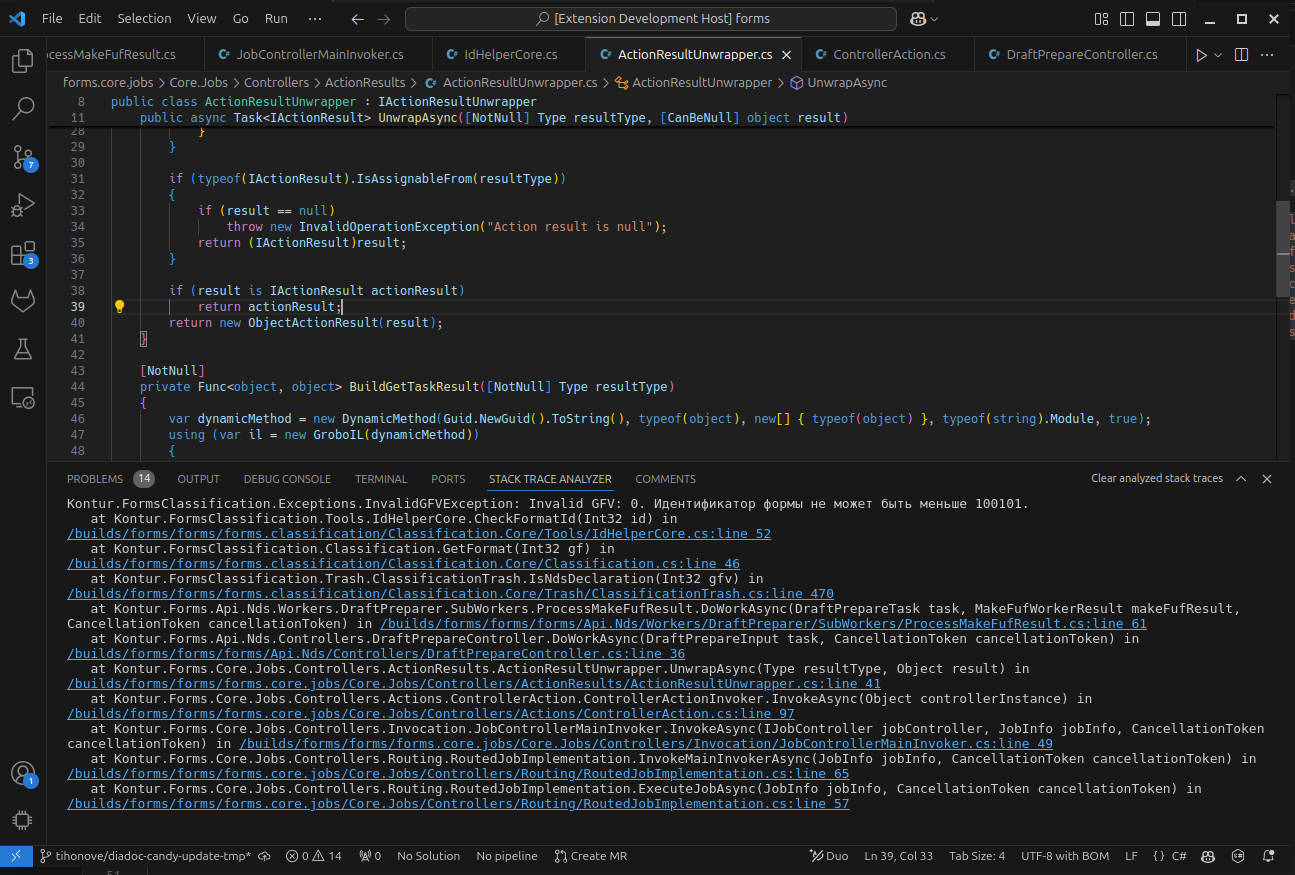
Note the paths in that trace: /builds/forms/forms/…. They come from a build agent and do not exist on
this machine — the frames are links anyway.
Why
A stack trace almost never arrives inside your editor. It arrives as dead text: pasted into a chat, sitting
in a CI job log, quoted in a bug report.
Reading it means doing the same thing by hand thirty times — eyeball a path, guess which local file it
means, open it, scroll to the line number. By the tenth frame you have lost the thread you were actually
chasing.
How it works
- Copy a stack trace to the clipboard — the whole thing, however messy.
- Run Stack Trace Analyzer: Analyze stack from clipboard.
- The panel renders the trace immediately as text, so you can start reading right away.
- Links and git tooltips fill in as resolution completes, frame by frame.
Pasting a JSON log line works too: if the trace is embedded in a JSON string, it is unwrapped and unescaped
automatically, so a Sentry or Loki payload can go in whole.
When the paths don't match
This is the part that usually matters, and it is why the extension exists.
A trace produced on a build agent, in a container, or on a teammate's machine carries paths that do not
exist on yours. Stack Trace Analyzer never requires them to. For each frame it:
- looks for your workspace folder's — or repository's — directory name inside the trace path, and if it
finds it, builds the local path directly and checks it with a single
stat. So
C:/BuildAgent/work/<hash>/my-repo/src/Utils/Helper.cs resolves to /home/you/my-repo/src/Utils/Helper.cs
with no searching at all;
- otherwise asks git for the file name via
git ls-files — per repository, honouring .gitignore, and
handling the awkward layouts: several repositories inside one workspace folder, repositories nested
inside a repository, and a workspace folder that is only a subdirectory of a much bigger repository
(the search widens to the repository root);
- walks the filesystem only where git cannot reach, including git-ignored directories that hold generated
code;
- ranks whatever it found by the longest matching path suffix, so
src/Utils/Helper.cs wins over an
unrelated Helper.cs elsewhere in the tree.
Using the git index rather than a workspace-wide file search is what makes this usable on a large
repository: on a Java monorepo, one 30-frame trace went from 82 seconds to 5. It is on by default; see
stack-trace-analyzer.search.gitIndex below.
Coming from IntelliJ IDEA?
This is the "Analyze Stack Trace" feature you are missing, with the same job and a few different habits:
|
IntelliJ IDEA |
Stack Trace Analyzer |
| Entry point |
A dialog you paste into |
A command that reads the clipboard |
| Results |
One analysis at a time |
A panel keeping the last 10 traces, with next/previous |
| Unmatched paths |
Resolved within the project's modules |
Matched by path suffix against the git index — CI and container paths resolve with no configuration |
| Thread dumps |
Analyzes thread dumps and deadlocks |
Not supported |
| Language |
A frame it recognises |
| C |
/workspaces/postgres/src/backend/main/main.c:199 |
| C# |
at Tools.IdHelperCore.CheckFormatId(Int32 id) in /builds/forms/Tools/IdHelperCore.cs:line 52 |
| Go |
/home/user/project/main.go:15 +0x39 |
| Java |
at Example.printLength(NullPointerExceptionExample.java:3) |
| JavaScript / TypeScript |
at Object.<anonymous> (C:\path\to\file.js:10:15), ModelNormalizer.ts:125:18 |
| PHP |
C:\sites\wonderfulproject\script.php:40, /var/www/html/lib/helper.php(25) |
| Python |
File "/home/user/project/src/main.py", line 42, in main |
| Ruby |
from maths_is_hard.rb:2:in `divide' |
| Rust |
src/main.rs:10:9 |
These nine have dedicated test suites, but the list is not a limit: the general matcher picks up anything
shaped like path:line or path:line:column, so other languages and plain log formats usually work too.
If yours does not, open an issue with a
sample — a new format is usually a small, self-contained addition.
Commands and settings
Everything lives in the Command Palette; the extension does not claim any keyboard shortcuts of its own.
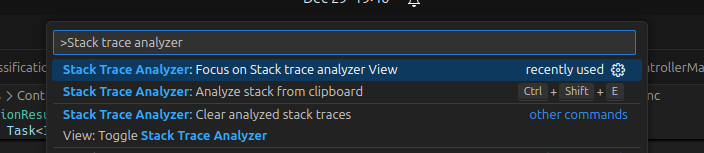
| Command |
What it does |
Stack Trace Analyzer: Analyze stack from clipboard |
The main one: parse the clipboard and show the trace |
Stack Trace Analyzer: Previous stack trace / Next stack trace |
Step through the last 10 analyzed traces |
Stack Trace Analyzer: Clear analyzed stack traces |
Empty the panel and the history |
Stack Trace Analyzer: Enable VCS Integration / Disable VCS Integration |
Turn the last-commit tooltips on and off |
Stack Trace Analyzer: Show logs |
Open the extension's log — start here if a search is slow |
| Setting |
Default |
What it does |
stack-trace-analyzer.search.gitIndex |
true |
Resolve paths through the git index. Turning it off falls back to VS Code's workspace search, which is markedly slower on large repositories. |
FAQ
My stack trace isn't recognised.
Open an issue and paste the trace.
Parsing is per-format and the formats are independent of each other, so adding one rarely disturbs the rest.
The frames aren't linked — my paths don't match.
Run Stack Trace Analyzer: Show logs. At the default level it reports which search strategy ran and how
long each phase took. For the full picture — the search plan, every git query and every directory scan with
its duration — set the level to Debug first via Developer: Set Log Level… → Stack Trace Analyzer, then
analyze the trace again. That log is also the most useful thing to attach to an issue.
Does it send anything anywhere?
No. There are no HTTP calls anywhere in the extension, no telemetry, and no runtime dependencies at all.
Git runs as a local command, and the last-commit tooltips come from VS Code's own built-in git extension.
Your stack traces never leave your machine.
What is the tooltip on a resolved frame?
With VCS integration on, each resolved file is looked up in git history and the commit that last touched it
is shown — often enough on its own to tell you who to ask.
Contributing
Issues and pull requests are welcome at
github.com/tihonove/vscode-stack-trace-analyzer.
New stack-trace formats are the most useful contribution — see
ARCHITECTURE.md for how
the parser is put together.
Changelog ·
Report a problem ·
Rate it on the Marketplace
License
MIT — see LICENSE.md.

