Shader Studio
A VS Code extension for live previewing, editing, and debugging Shadertoy-style GLSL shaders. It gives you a real-time preview inside your editor, a visual debugger that lets you see what every line computes, and a full pipeline for multi-pass effects.
📖 Full documentation: teaqu.github.io/shader-studio
Quick Start
- Open any Shadertoy-style
.glsl file in VS Code (or run Shader Studio: New Shader from the Command Palette for a template).
- Click the
 Shader Studio icon on the VS Code status bar to choose how to view your shader — as a panel, a separate window, or in the browser.
You can launch as many panels, windows, or browser tabs as you want simultaneously.
The preview updates in real time as you edit — by default it recompiles on every keystroke.
See the Quick Start guide for a full walkthrough.
Features
| Feature |
Description |
| Live Preview |
Edit GLSL and see the result instantly, in a panel, window, or browser |
| Buffers & Channels |
Multi-pass pipelines with textures, video, audio, cubemaps, buffers, and keyboard input |
| Visual Debugging |
Inspect what every line computes — pixel inspector, inline rendering, variable inspector |
| Time & Playback |
Scrub, loop, pause, and change playback speed |
| Recording |
Capture screenshots or record video and GIF directly from the preview |
| Resolution |
Scale the canvas, set custom dimensions, or change aspect ratio |
| Editor Overlay |
Edit shader code inline over a full-screen preview |
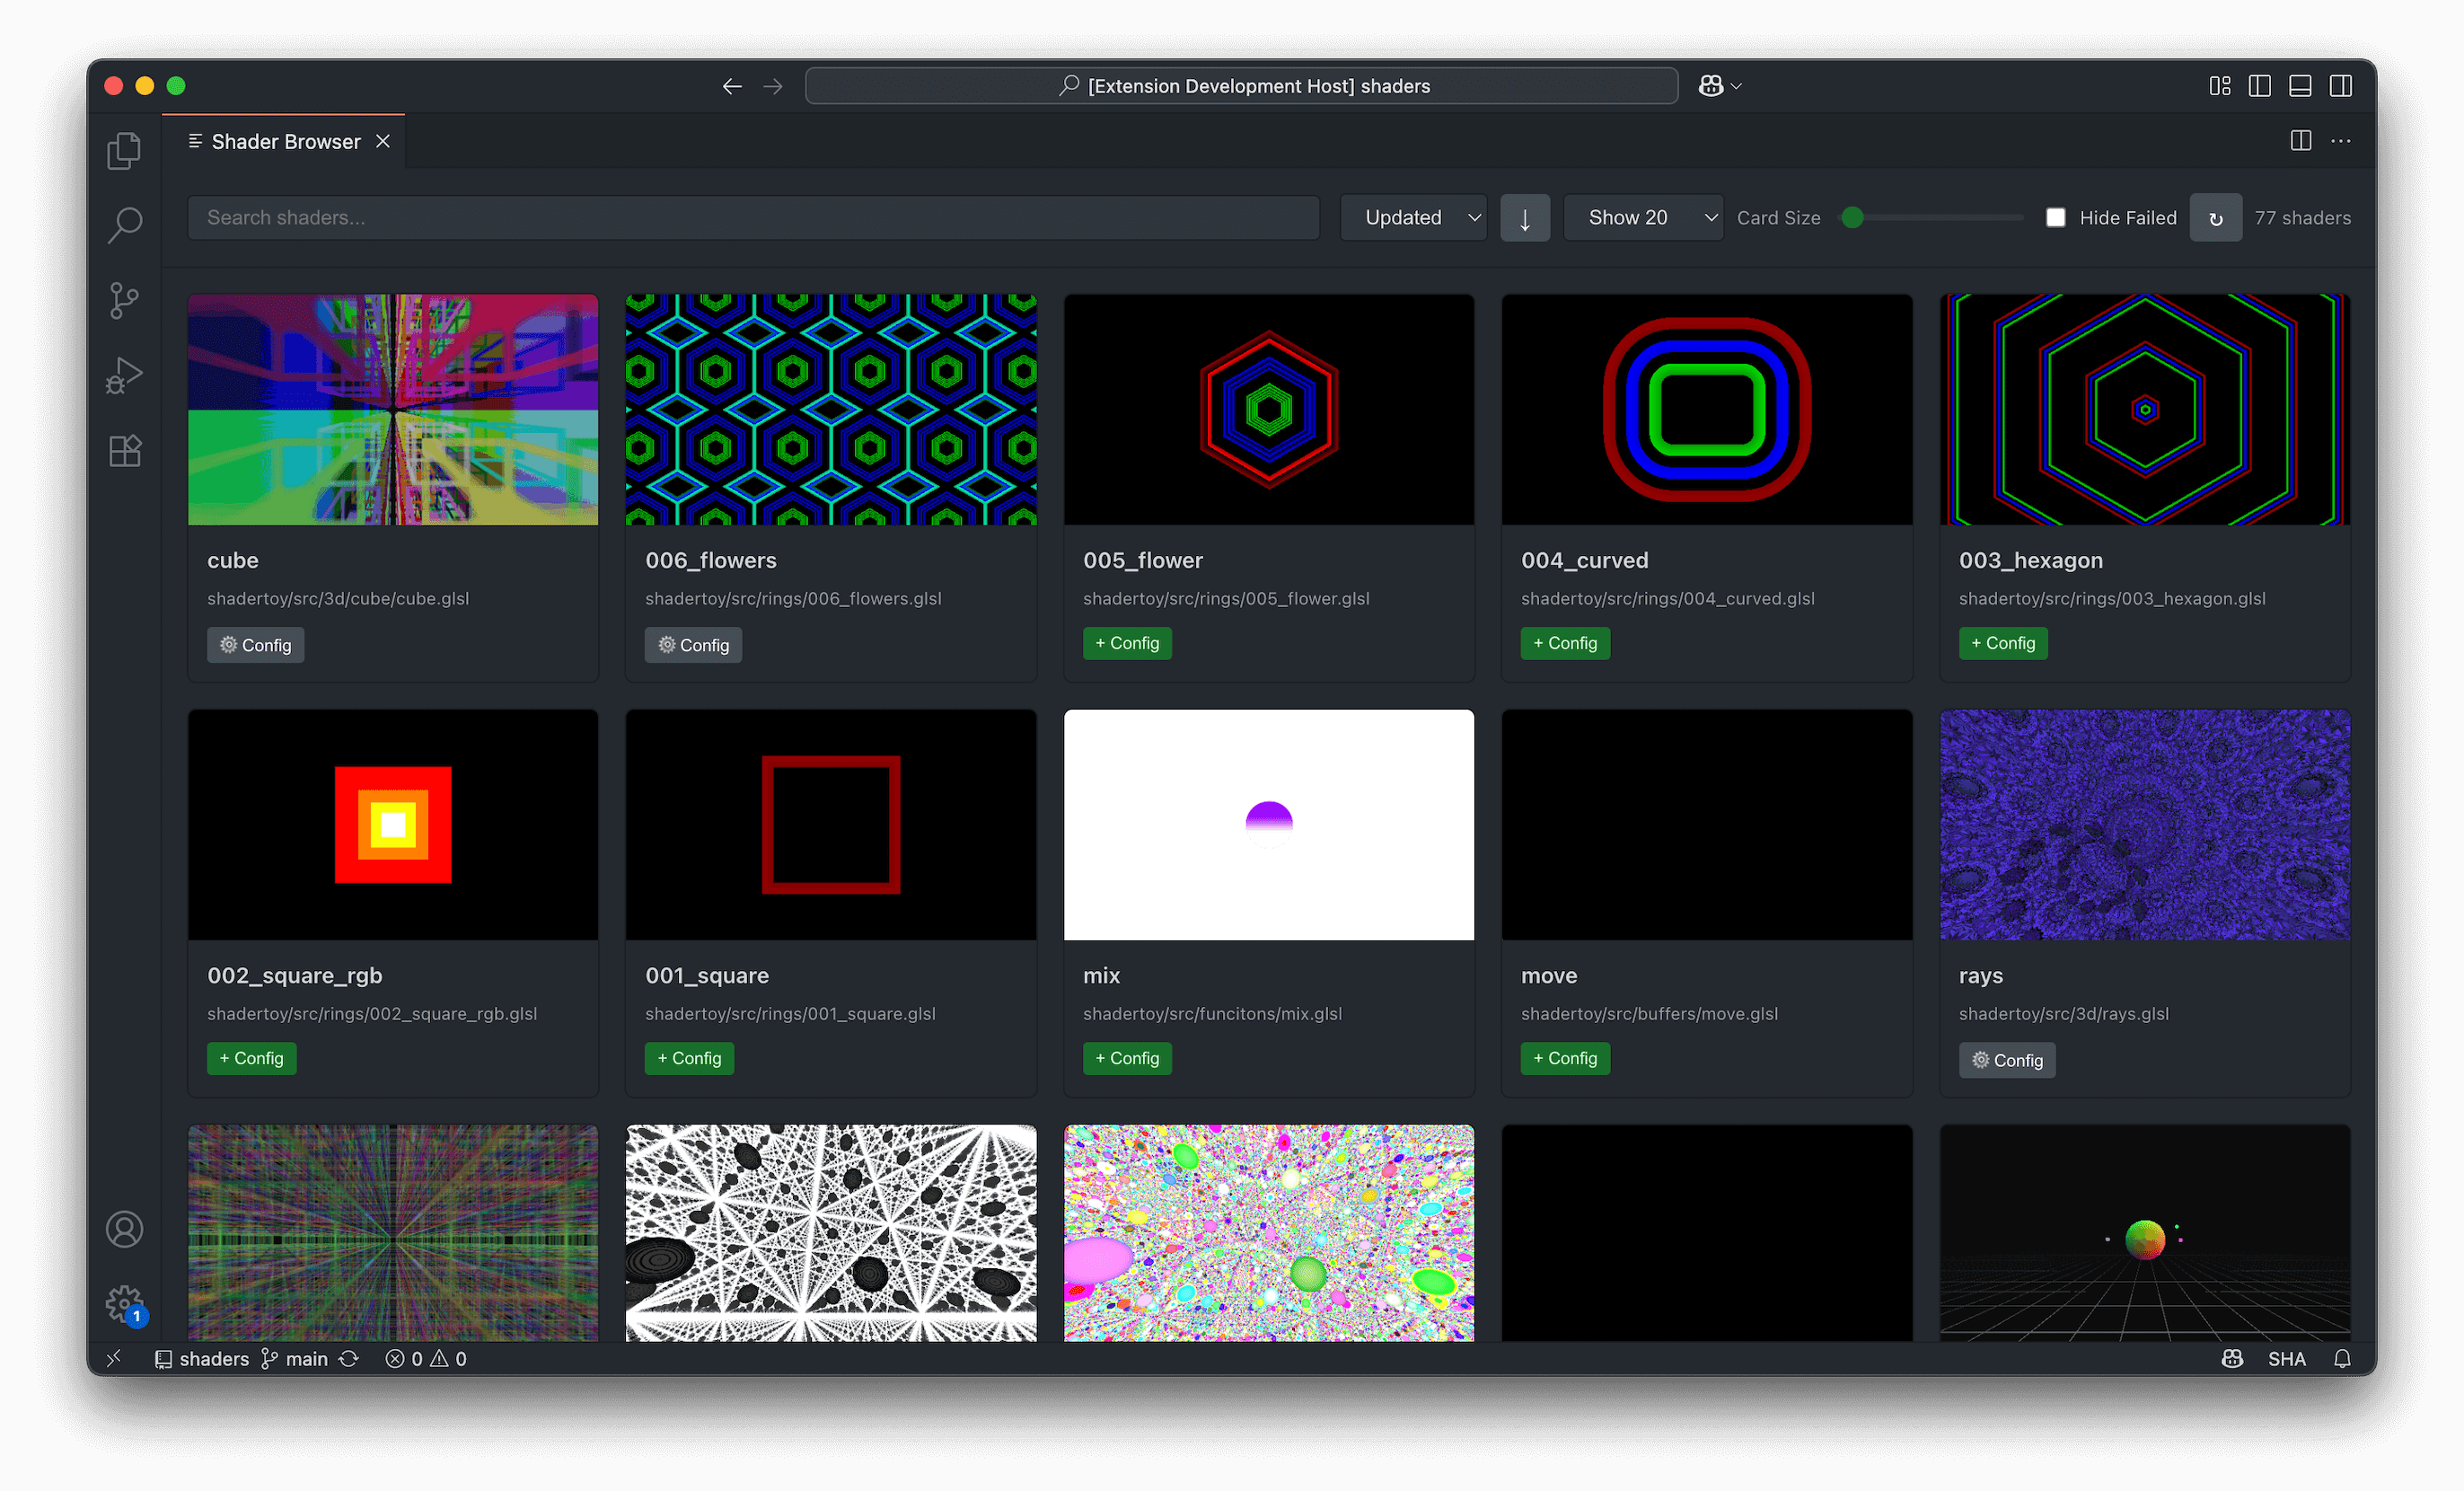
| Shader Explorer |
Browse and switch between your shaders |
| Snippet Library |
Insert common GLSL patterns — noise, SDFs, color utilities, and more |
| Compile Modes |
Compile on every keystroke, on save, or manually |
| Locking |
Pin the preview to a shader while you edit buffer files |
| Performance |
Cap the frame rate or open a detailed frame-time panel |
Viewing Modes
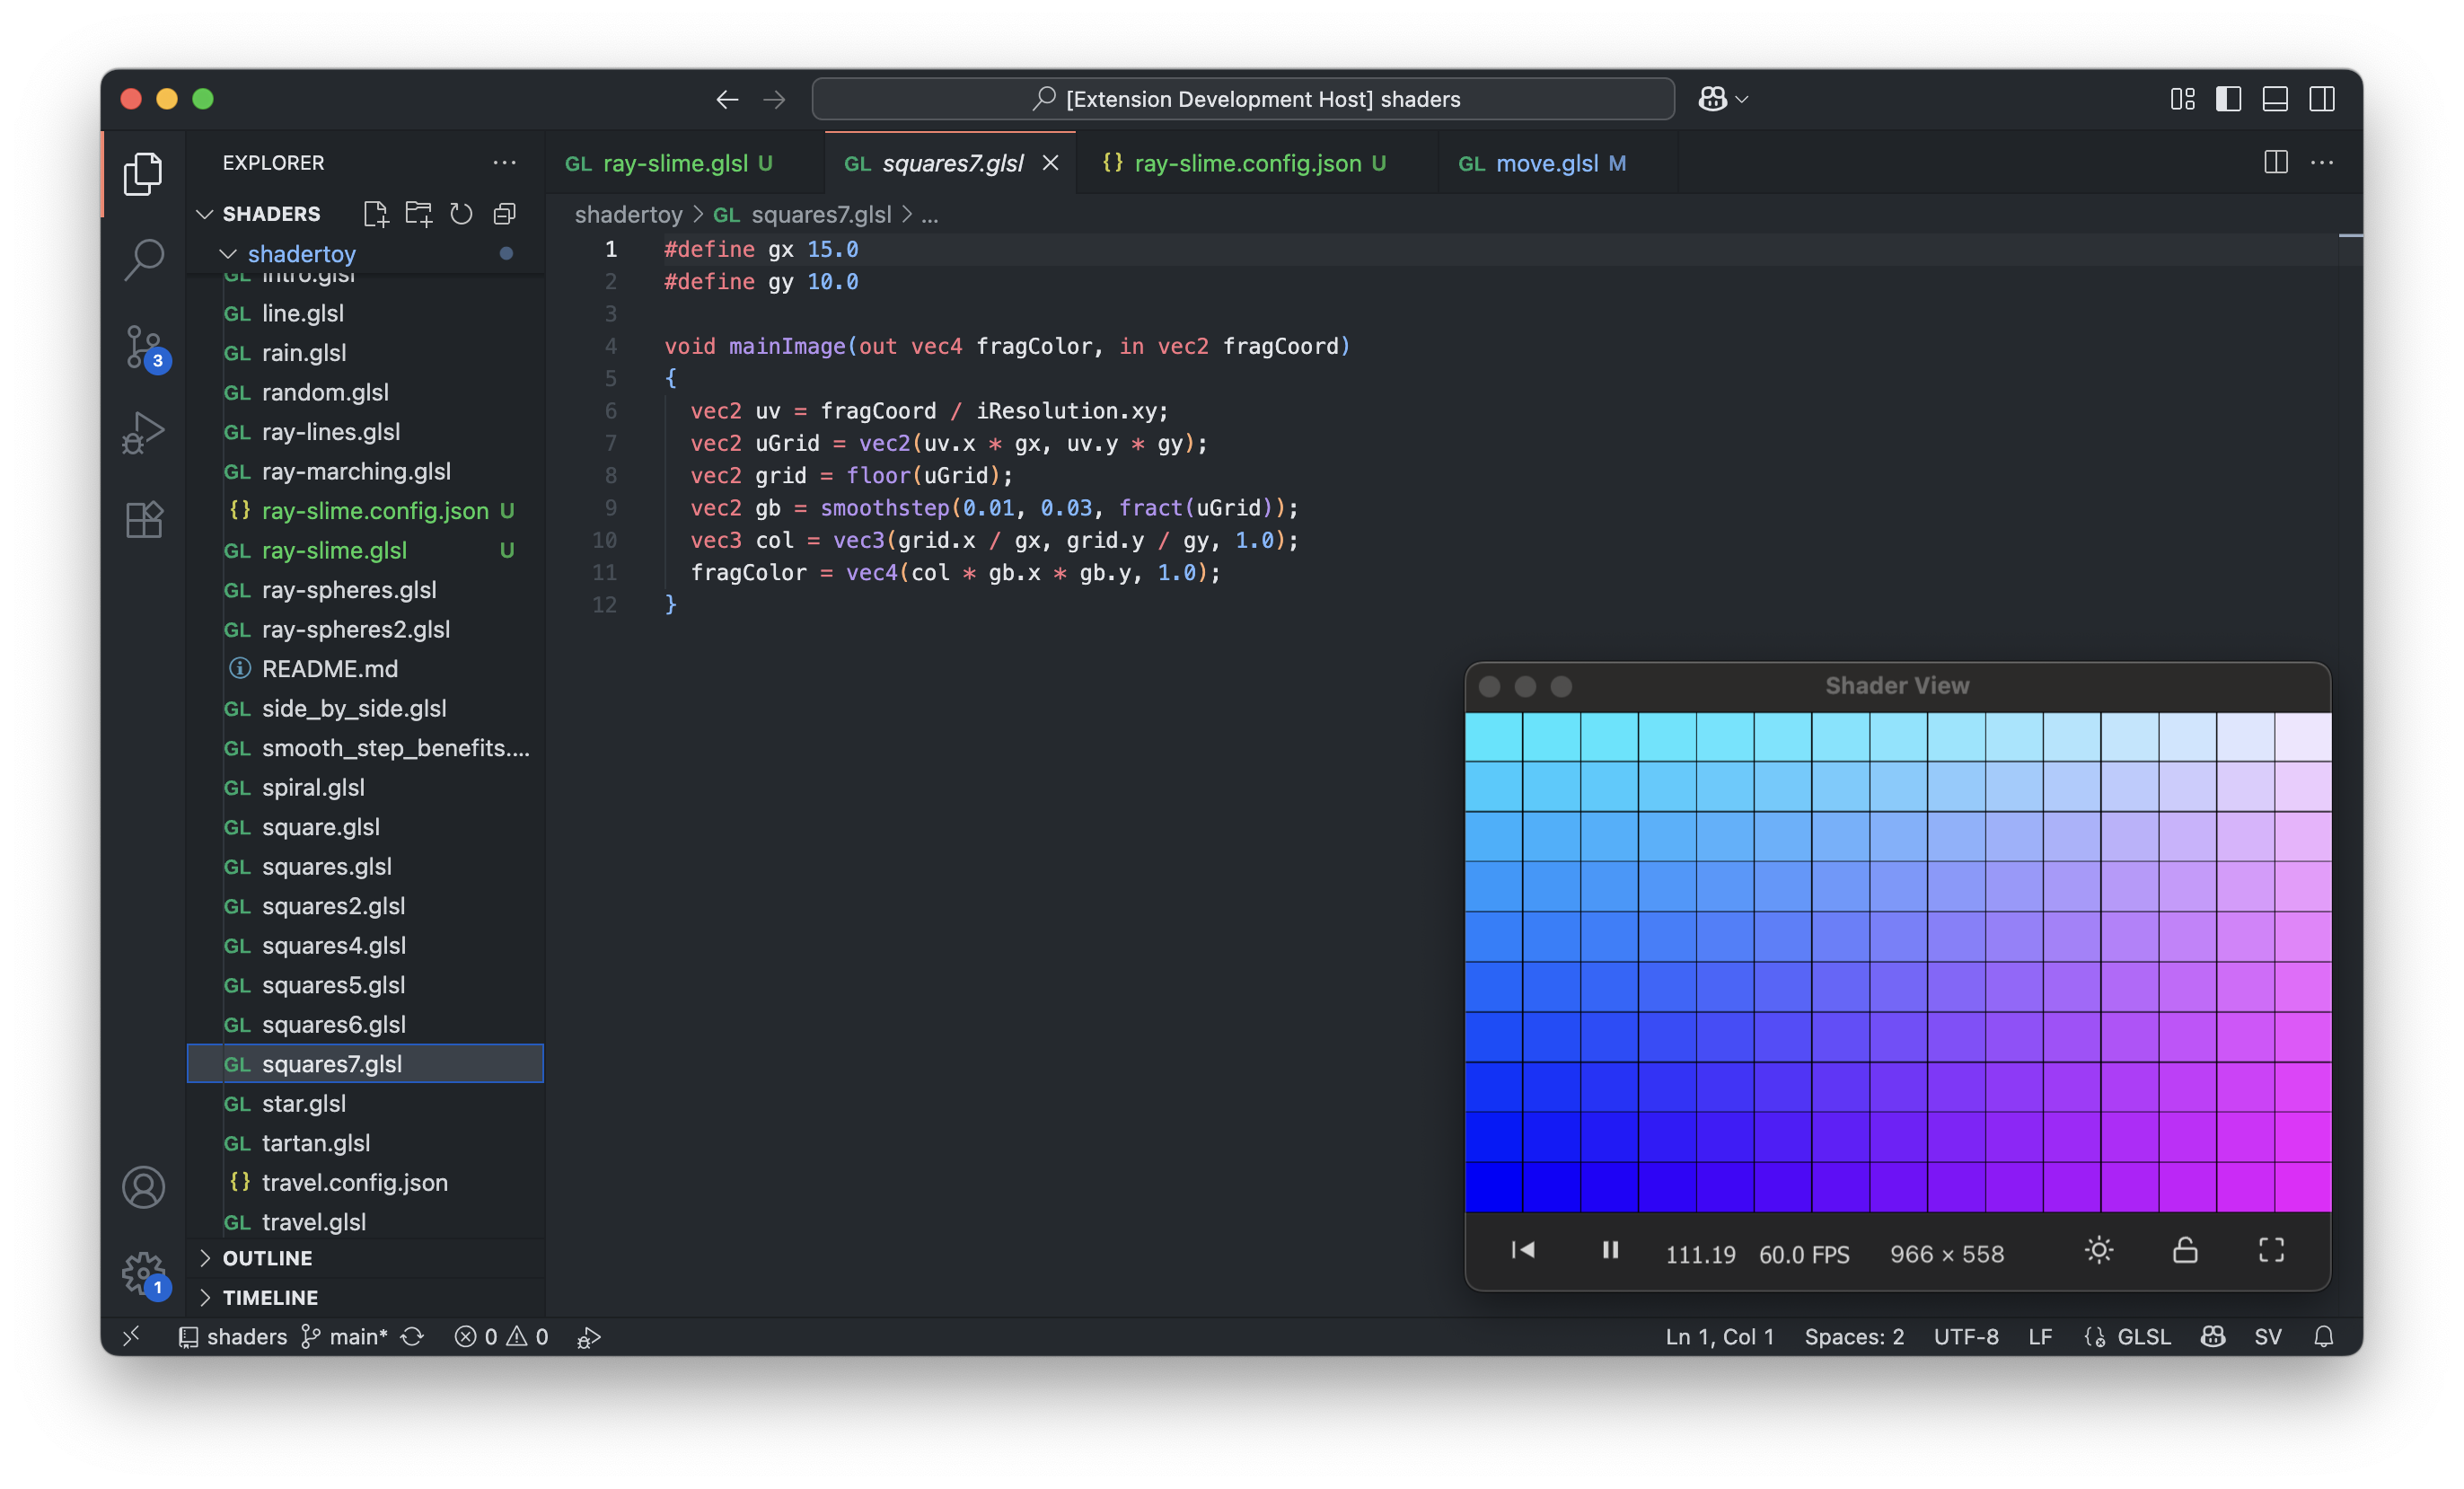
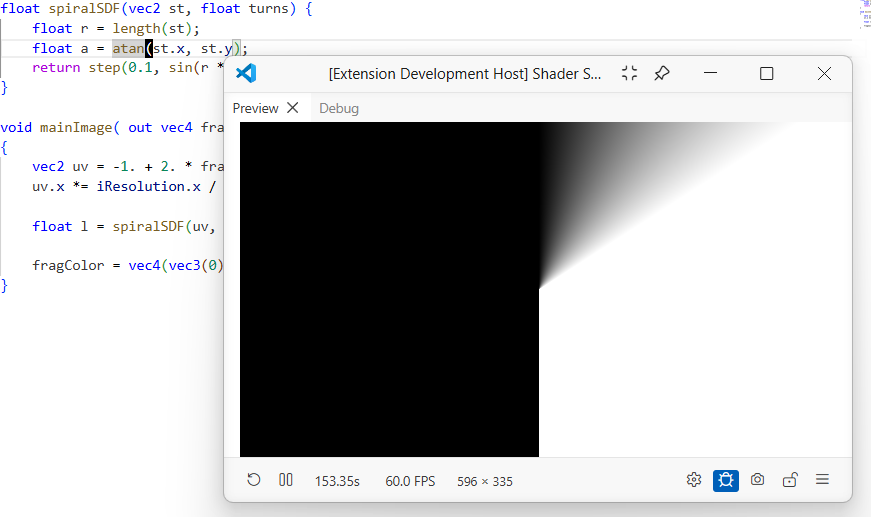
Panel
Runs the shader within a panel in VS Code, so you can view your shader alongside your code. Panels can be dragged, split, and resized; the layout saves automatically. See Panel Layout.
Web Browser
For the best performance, run the preview in your web browser. Browsers tend to have better GPU optimizations and higher-priority rendering than VS Code panels. See Open in Browser.
Visual Config Editor
The Config panel is a visual editor for setting up multi-pass pipelines and binding assets to your shader inputs — no manual uniform declarations or hand-written config required. Open it with the gear icon in the toolbar.
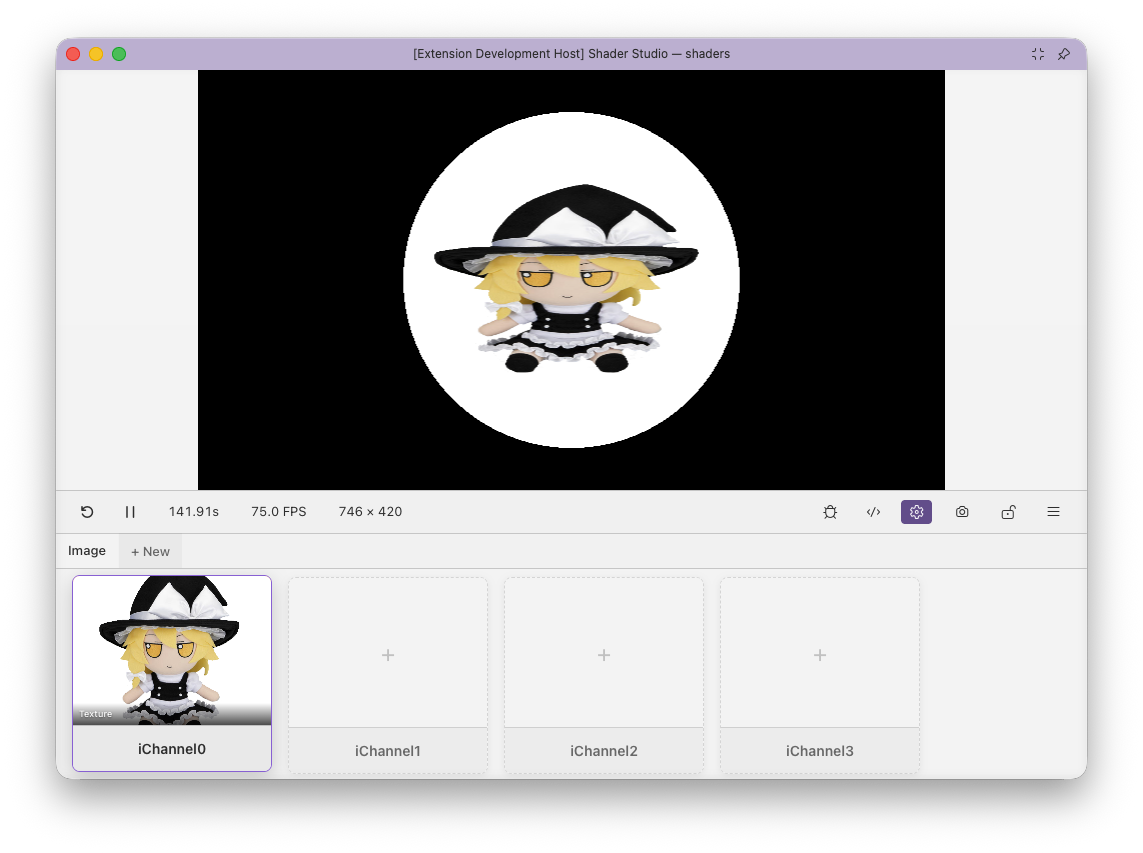
A tab bar lets you add and switch between passes: Image, BufferA–BufferD, a shared Common pass, and a Script pass for driving custom uniforms. For each pass you get a channel grid (iChannel0–iChannel15) where you click a slot, pick an input type, and bind it visually:
- Textures — images, noise maps, lookup tables
- Video — sampled like a texture, synced to play/pause
- Audio — FFT spectrum and waveform data (matches Shadertoy's audio texture layout)
- Cubemaps — cross-layout images bound as
samplerCube
- Buffers — the output of another pass, including self-reference for feedback loops
- Keyboard — held, pressed, and toggle state per key
The editor writes a .sha.json file next to your shader and keeps it in sync; you can also toggle to a raw JSON view if you prefer to edit it by hand.
See Configure Buffers and Inputs and Channels for the full guides, and my shaders repository for examples.
Visual Debugging
Enable debug mode with the bug icon in the toolbar to open a panel of tools for inspecting your shader while it runs:
- Pixel Inspector — hover the canvas to read exact RGB, float, hex, fragCoord, and UV values
- Inline Rendering — visualize the value of the variable on your current line across the whole screen
- Variable Inspector — capture and inspect every variable in scope, sampled across the canvas or at a single pixel
- Normalize & Step — remap value ranges and apply binary thresholds to make small variations visible
- Parameters & Loops — control function arguments and cap loop iterations
Debug mode works inside mainImage, helper functions, and buffer passes. See Debug Mode Overview.
JavaScript Transpilation (Experimental)
Shader Studio can transpile your GLSL into JavaScript (using glsl-transpiler) so you can step through it with the standard VS Code debugger, set breakpoints, and inspect variables. Run Shader Studio: Transpile GLSL to JavaScript (for debugging) from the Command Palette. See JavaScript Transpilation.
Time Controls
Click the time display in the menu bar to access playback controls:

- Time Scrubbing — seek to any point within the current range
- Time Range Presets — 2π, 10s, 30s, 1m, or 2m
- Loop Mode — repeat the shader over the selected range
- Playback Speed — 0.25× to 4×
See Time and Playback Controls.
Shadertoy Compatibility
Shader Studio aims to support the full Shadertoy feature set. Your shader must define a mainImage function.
| Uniform |
Description |
iTime |
Elapsed time in seconds |
iTimeDelta |
Time since last frame in seconds |
iFrameRate |
Frames per second |
iFrame |
Frame counter |
iMouse |
Mouse position (xy = current, zw = click) |
iResolution |
Canvas dimensions |
iChannel0–15 |
Input channels (textures, video, audio, cubemaps, buffers, keyboard) |
iChannelResolution[N] |
Resolution of each input channel |
iChannelTime[N] |
Playback time for each audio/video channel |
iDate |
Year, month, day, seconds since midnight |
iSampleRate |
Audio sample rate |
Shader Studio also adds non-Shadertoy uniforms iCameraPos and iCameraDir for a built-in WASD/mouse-controlled camera.
Not Yet Supported
- Webcam input
- Microphone / real-time audio input
- VR/AR rendering modes
See the full Shadertoy Compatibility reference.
Documentation
The complete user guide lives at teaqu.github.io/shader-studio, including troubleshooting, keyboard shortcuts, and settings.
Contributing
Found a bug or want to contribute? Visit the GitHub repository to report issues or submit pull requests.