CodeMap Visualizer
Interactive flowcharts, call graphs, and AI-narrated code understanding for VS Code.
CodeMap Visualizer turns your source files into navigable visualizations: flowcharts of
individual functions, file-level flowcharts that include top-level execution
and local function references, file call graphs, and workspace-level overviews.
It also layers optional Copilot narration and debug-time introspection on top.
Supports Python, JavaScript / TypeScript, and IDL (.pro).
Features
Flowcharts
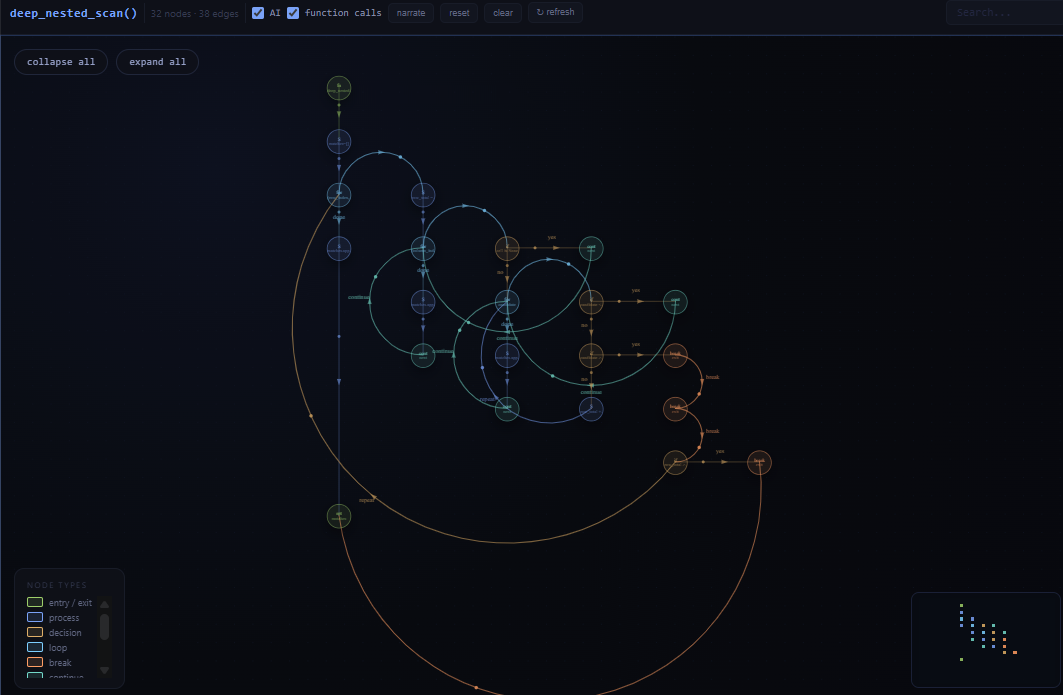
Render the function under your cursor as an interactive flowchart showing
control flow, branches, and loops. Click nodes to jump to source.
CodeMap Visualizer also supports file flowcharts for Python, JavaScript/TypeScript,
and IDL. These show top-level execution together with compact local function
reference nodes and local call edges when they can be resolved statically.
Call graphs
- File call graph: a file-scoped call graph centered on the active file,
including local symbols and external dependencies that connect to them.
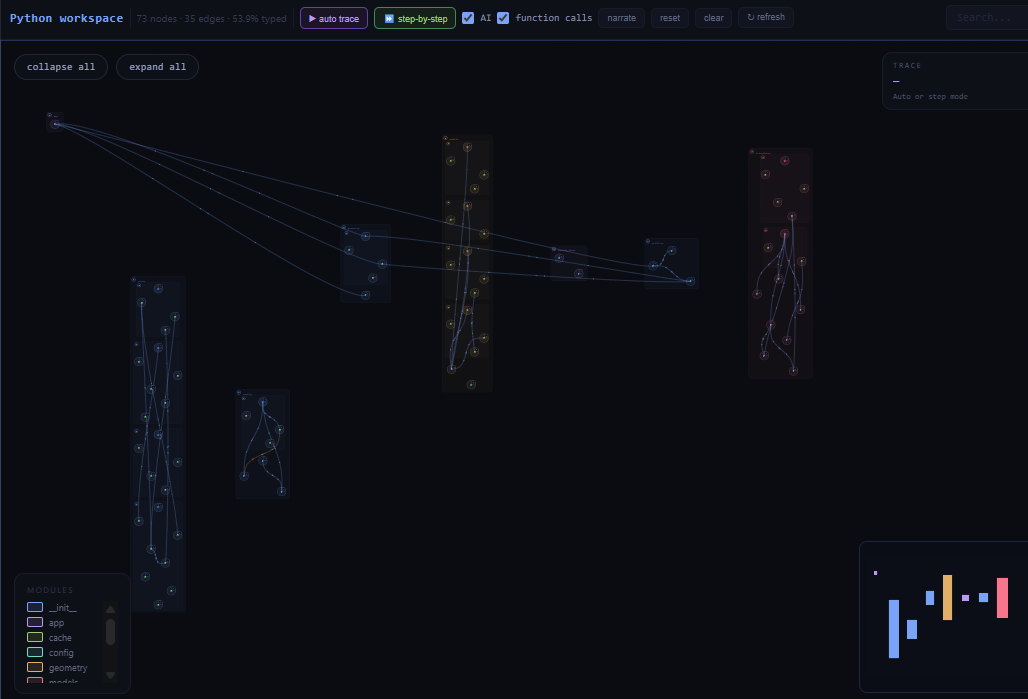
- Workspace call graph: a project-wide symbol graph across your workspace,
bounded by a configurable file cap (default
400).
- Type-aware resolution via Jedi when available for Python analysis.
Copilot narration
Generate plain-English walkthroughs of the active graph or static execution
trace. Flowcharts can be annotated inline, narration can be regenerated, and
scripts can be exported as Markdown.
Debug probes
At a breakpoint, generate context-aware logging probes or ask a natural-language
question about the current state. Probes can be exported as a standalone script
in the dominant probe language.
Runtime probes are currently supported for Python and JavaScript / TypeScript.
Activity bar integration
CodeMap Visualizer adds a dedicated activity-bar view container with:
- Scope: choose which files are included in analysis
- Controls: visualization and narration controls
Commands
All commands are prefixed with CodeMap: in the Command Palette.
| Command |
What it does |
Show Flowchart for Current Function |
Flowchart of the function under your cursor |
Show Flowchart for File |
File-scoped flowchart for the active file |
Show Call Graph for File |
File-scoped call graph for the active file |
Show Workspace Call Graph |
Workspace-wide symbol graph |
Refresh Analysis |
Re-run static analysis and re-render the last view |
Narrate Current Graph |
Generate an AI walkthrough of the active graph |
Narrate Execution Trace |
Generate an AI walkthrough of a trace-capable graph |
Annotate Flowchart with Copilot |
Add narration to the active flowchart |
Regenerate Narration |
Re-run narration using the current graph context |
Export Narration Script |
Save the narration as Markdown |
Generate Debug Probes at Breakpoint |
Auto-generate probes at the current breakpoint |
Ask a Debug Question at This Point |
Ask a natural-language debugging question |
Clear All Debug Probes |
Remove generated probes from the current session |
Export Debug Probes as Script |
Save probes as a standalone script |
Configuration
| Setting |
Default |
Description |
codemap.pythonPath |
"" |
Path to the Python 3 interpreter used for static analysis. Falls back to python on PATH. |
codemap.workspace.maxFiles |
400 |
Cap on files indexed in the workspace graph. |
codemap.useJedi |
true |
Use Jedi for type-aware Python call resolution when it is installed. |
codemap.narration.autoGenerate |
false |
Automatically narrate newly rendered graphs. |
Requirements
- VS Code 1.90 or newer
- Python 3 on
PATH or configured via codemap.pythonPath
- Jedi (optional) for upgraded Python call resolution:
pip install jedi
- GitHub Copilot (optional) for narration and debug-probe features
Getting Started
- Install CodeMap Visualizer.
- Open a Python, JavaScript / TypeScript, or IDL file.
- Run
CodeMap: Show Flowchart for File or another CodeMap command.
- Explore the graph in the CodeMap Visualizer activity-bar panel.
Known Limitations
- Workspace graphs above the configured file cap may need
codemap.workspace.maxFiles raised and will take longer to build.
- JavaScript / TypeScript and IDL analysis are intentionally conservative when static targets are ambiguous.
- IDL support focuses on
.pro routines and does not currently support runtime debug probes.
- Trace narration requires a call graph that includes an execution timeline.
- Copilot-dependent commands require Copilot to be available and enabled.
Privacy
Static analysis runs locally. Optional narration and debug-probe generation use
VS Code Copilot APIs only when you explicitly invoke or enable them.
Feedback And Issues
Bug reports and feature requests are welcome at the issue tracker.
License
MIT
Project layout
src/                    extension host (TypeScript)
  extension.ts
  commands handled inline in extension.ts
  python/
    analysis/           workspace indexer, call-graph builder, runner
    model/              shared graph & symbol types
  providers/            webview provider
  messaging/            host <-> webview protocol
python/                 stdlib-only Python helpers invoked via subprocess
  analyzer.py           project-wide AST extraction
  flowchart.py          per-function flowchart generation
webview/                front-end (plain ES modules, no bundler)
  main.js               entry, message bus, animation loop
  styles.css
  shared/               theme, geometry, pan/zoom
  views/flowchart/      flowchart renderer
  views/callgraph/      call-graph / workspace / trace renderer
samples/python_demo/    small Python project to try the extension on
docs/                   architecture notes
See docs/architecture.md and
docs/python-analysis.md.