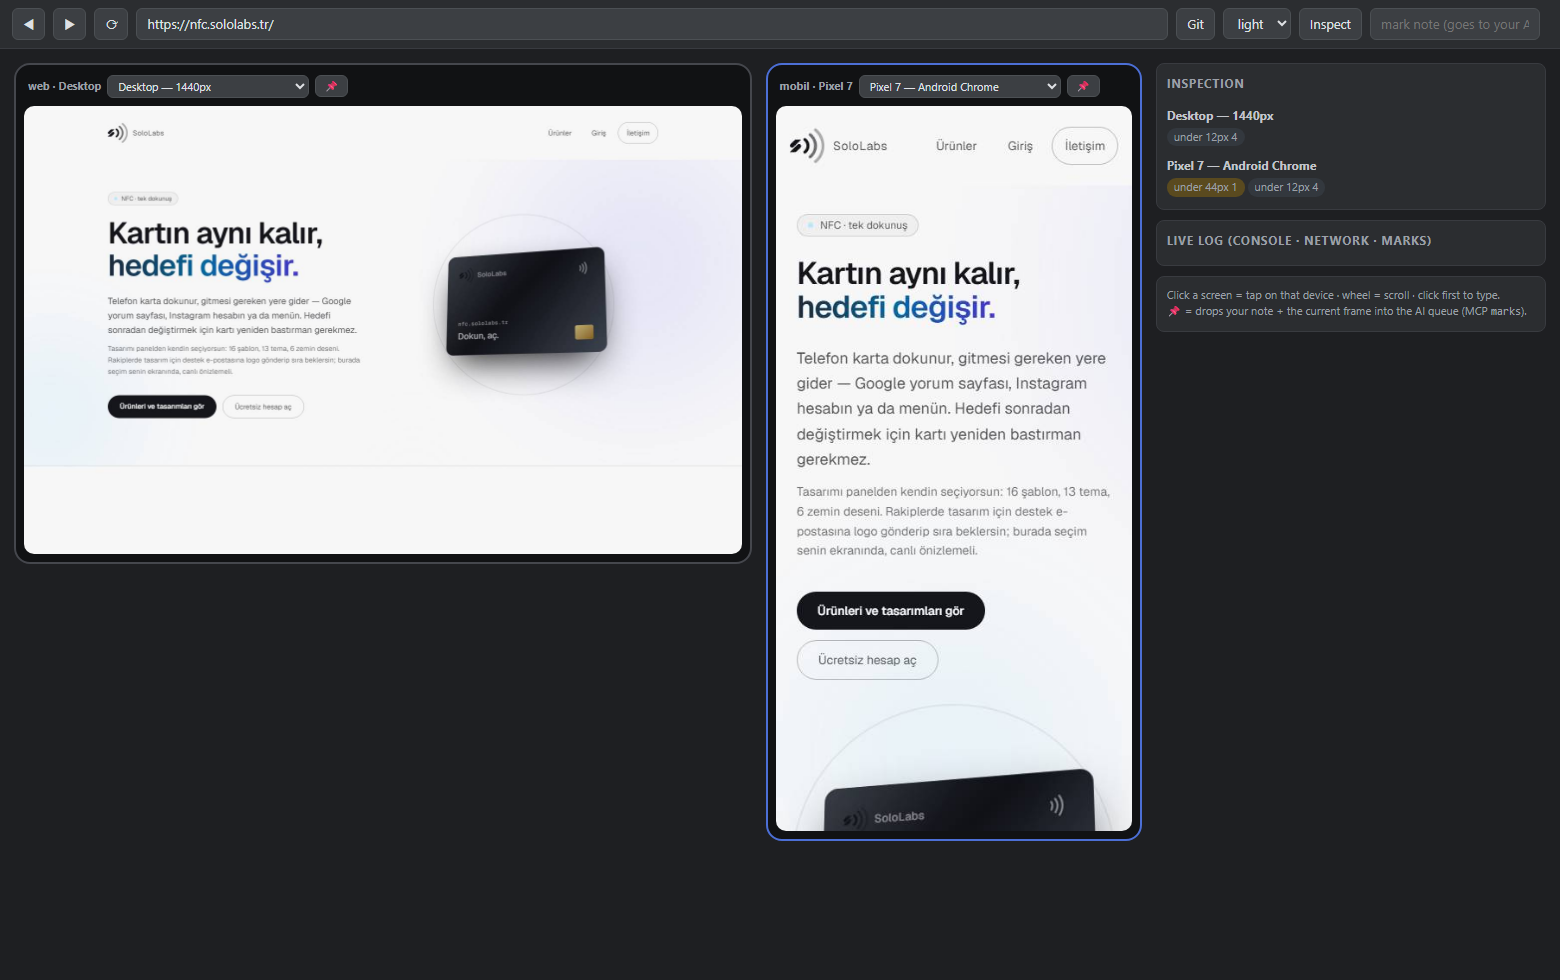
uisight — live mobile panelSee the running app on a phone screen inside your editor, switch device and theme, and measure what a screenshot cannot: contrast, touch targets, covered controls. Installation Launch VS Code Quick Open ( Ctrl+P), paste the following command, and press enter.Copied to clipboard |

uisight — live mobile panelYour editor shows you code. This shows you the app: a phone screen running your site, next to a desktop one, both live, inside the window you are already in. And then it measures what a screenshot cannot.
Why measure instead of lookA model can see your screenshot. It cannot see that the label is 4.38:1 against its background when the standard is 4.5, or that the "Continue" button is 38px tall when a thumb needs 44, or that a floating chat bubble is covering 50% of the last card in a list. Those are numbers, and guessing at them from an image is how "looks fine to me" happens.
What it checksCan you read it — invisible text, WCAG AA contrast failures (alpha-composited
backgrounds, gradient text, Can you reach it — touch targets below 44px, controls painted over by
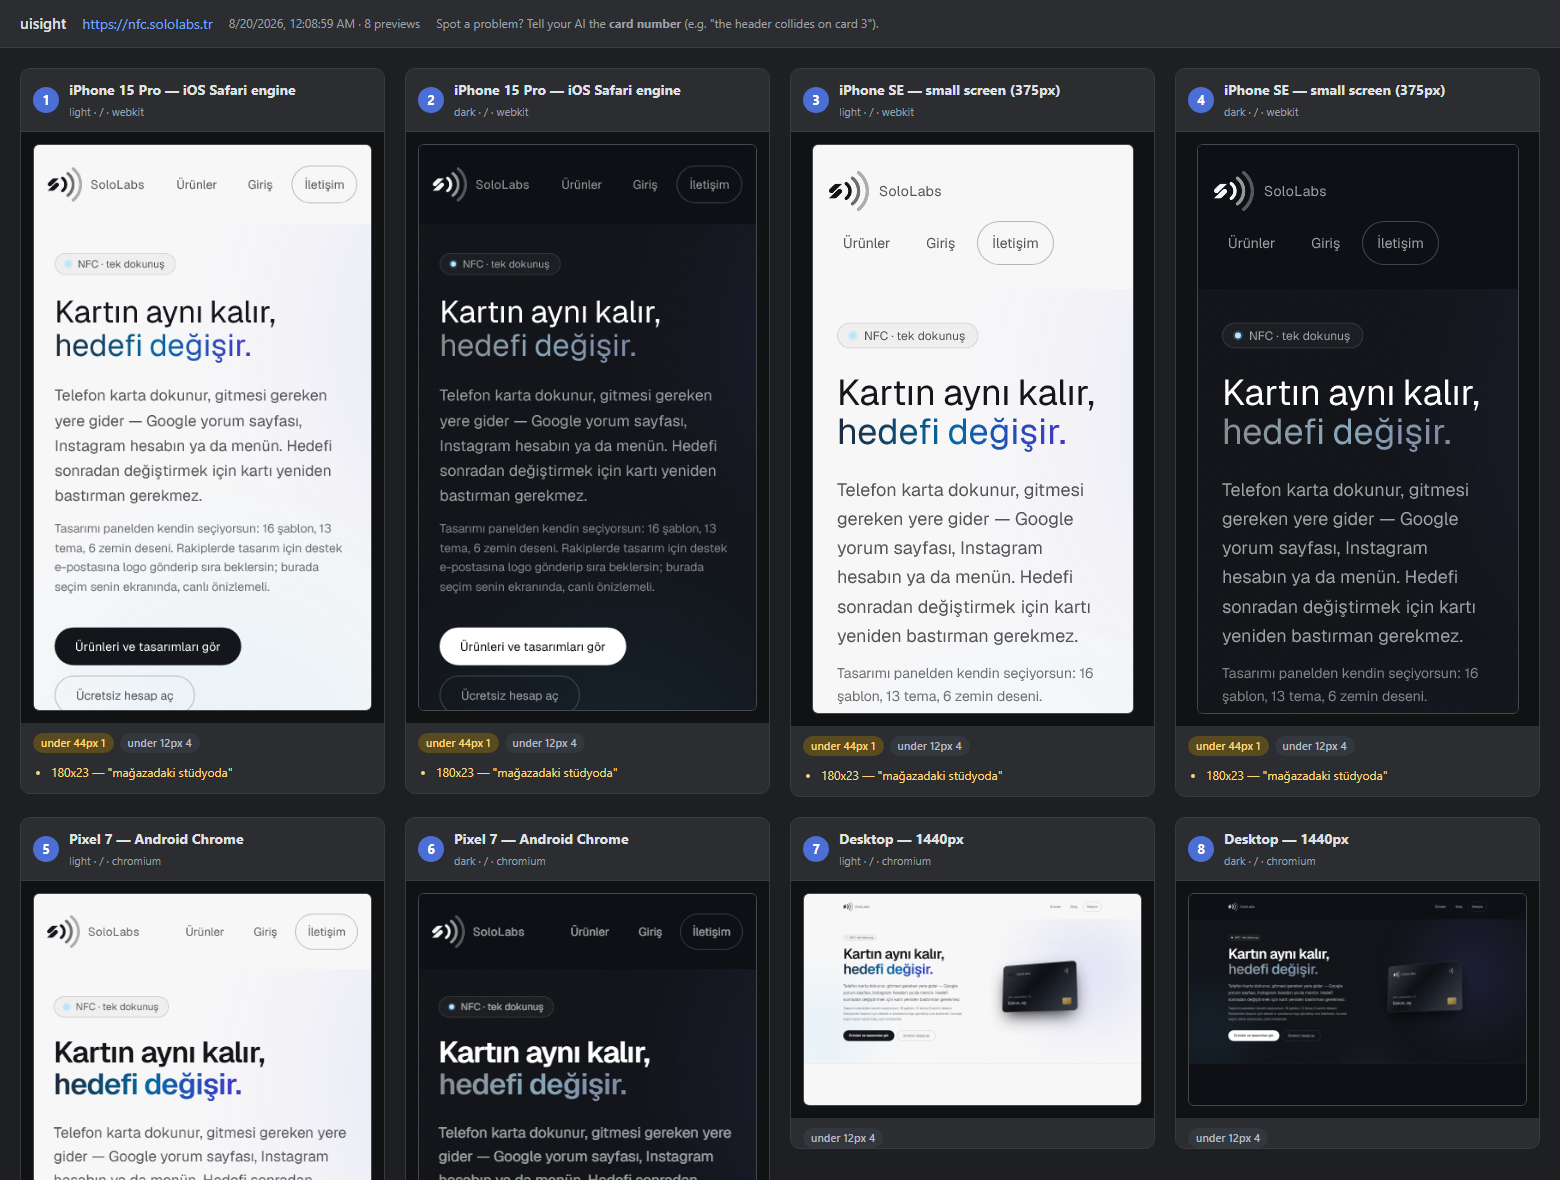
something else (confirmed with Does it make sense — a row of actions where nothing says which is primary, light patches left in dark mode, two languages on one screen, US date formats, an error message that names nothing, an irreversible action with no confirmation step anywhere on the page, a permission asked for before anything explains it. Every check has a false-alarm test next to its detection test. A tool that cries wolf on every bottom navigation bar gets ignored, and then its real findings go unread too. The same engine runs without the editor, over every device and both themes at once, and writes a gallery you can scroll through — one card per screen, its own findings under it:
Using itClick the uisight icon in the activity bar. The panel opens with a phone and a
desktop view of
Commands are in the palette under Working with an AIThe panel is one half. The other is the MCP server, which lets your assistant drive the same session — navigate, tap, change device, and read measurements as text instead of guessing from pixels. Tool schemas are sent with every request, so if a session only needs to measure
pages, RequirementsNode.js 20 or newer. Nothing else — the extension runs the
published Playwright ships its driver over npm but downloads browsers separately, so the first run has nothing to drive yet. Started from a terminal, uisight offers to fetch it (~150 MB, once) and shows the progress; started by the editor, where there is nobody to answer, it names the command instead: Working on uisight itself? Point Settings
Limits, stated plainlyAutomated checks cannot see design mistakes. A collided header measures fine. A layout that is ugly measures fine. That is why the panel exists next to the numbers — look at it. On Windows the iPhone profiles use WebKit, which is Safari's engine but not iOS itself. There is no iOS Simulator outside macOS. Sourcegithub.com/sololabstr/uisight · MIT · issues and findings welcome, especially a check that fired when it should have stayed quiet. |