Claude Usage Meter
Your real Claude usage in the status bar — and when the number stops being
current, it says so instead of pretending.
⟳ 21% (resets in 2h 11m) · 24% (resets in 4d 4h) · Fable 12%
The rolling 5-hour session window, then the rolling 7-day window, each with
the time until it resets — then the Fable 5 sub-cap, by name. Every percentage
is a figure Anthropic reported for your account, and every countdown is that
response's own resets_at counted down against the clock.
The bar is deliberately spare. Position says which of the first two figures is
which — session first, then weekly — so their labels stay off; Fable keeps its
name because no position could identify it, and it is the server's own name
rather than one invented here. Every figure is drawn in the colour the theme
nominates for its own status bar — chosen by the only party that has seen both
the text colour and the background it lands on; see
Telling the figures apart for the release that
learned this the hard way. A figure that reaches your warning threshold takes
the amber highlight and a $(warning) icon, and gets its label back for as
long as it holds it, because an alarm has to say which window it is about. The
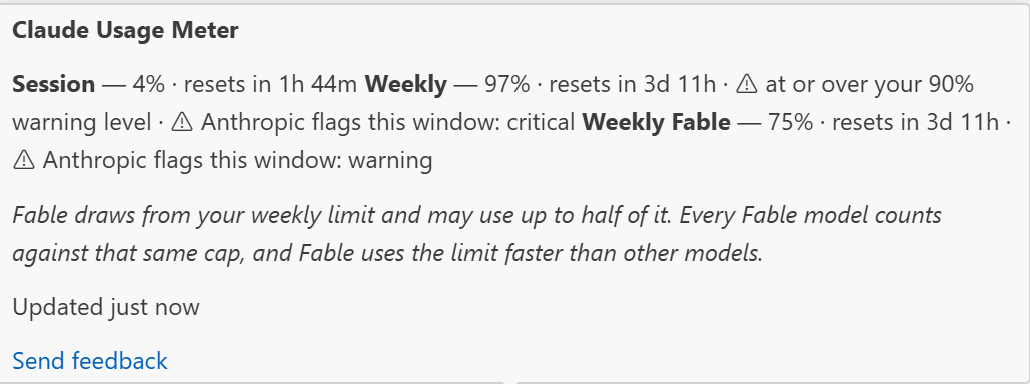
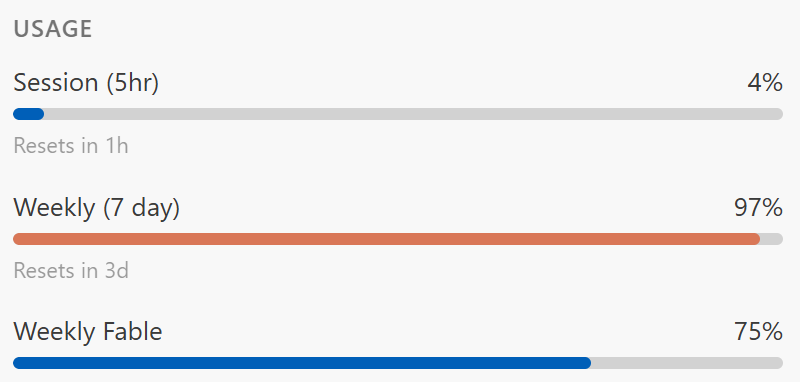
hover names every figure in full, with the sub-cap explanation beside them. If
you would rather have the window labels on the bar too, set
claudeUsageMeter.compact to false
and it renders the labelled form:
5h 21% (resets in 2h 11m) · 7d 24% (resets in 4d 4h) · Fable 12%.

Unofficial. This is an independent, community-built extension. It is not
made by, endorsed by, or affiliated with Anthropic. "Claude" is Anthropic's
trademark and is used here only to describe what the extension reads.
What makes this one different
There are a lot of Claude usage extensions, and most of them read the same
endpoint this one does. So rather than a feature list, here is what is actually
different about it.
- When a reading goes stale, its age is in the bar, not the tooltip.
Throttled, or slept through with the laptop shut, an old reading carries its
true age —
12m old — and a $(history) icon instead of the live one. Past
30 minutes it is dropped entirely. A tooltip is not where the claim was made;
the claim was made in the bar, to someone who is not hovering.
- The age is computed against the clock, not at poll time. Close the lid at
40% and open it three hours later and nothing has failed, no error was raised,
and a frozen "updated 4m ago" would still be sitting there. Freshness is a
property of the render, so it is evaluated at render.
- One reading per machine — not per window, and not per editor. Every window
shares a single request through
~/.claude-usage-meter/, deciding by lock who
makes it. Run VS Code and Cursor side by side and they still share one. The
429 backoff is shared too, so a throttle slows the machine down once rather
than being rediscovered separately by every window.
- It never shows a number it did not get. A failed request renders
—, not
0%, because a zero looks exactly like a successful reading of an untouched
quota. There is no demo mode and no simulated data.
- The one derived number is off by default and labelled
est. The
projection is the only figure here that could be wrong without the server
having been wrong, so it is opt-in, marked in the bar rather than only the
tooltip, and silent whenever it has too little history to be worth stating.
- It reads a Claude Code OAuth token and nothing else. No browser session
cookie, no sign-in of its own, no account credential to paste anywhere. The
token is read, never written; sent to exactly one host; never logged, never
persisted, never put in an error message — with a unit test asserting no
failure reason can echo it.
- Your terminal too, for free. It renders a
Claude Code status line from
the snapshot it already holds, for zero extra API requests — and that line is
subject to every rule above.
The percentages themselves are read from api.anthropic.com/api/oauth/usage
rather than estimated from local transcript files, and per-model sub-caps are
shown by the API's own names. Both are worth knowing and neither is unusual;
what is above is.
Every claim here is checkable in the source, and the sections below explain the
reasoning rather than just the behaviour.
Install: search Claude Usage Meter in the Extensions view, or
code --install-extension shivakrishnakokkula.claude-usage-meter. It is on Open
VSX too, so Cursor, Windsurf and VSCodium can install it — see
Install for what those need, and
Which sign-in it reads for the one prerequisite that
catches people out.
Where the numbers come from
Anthropic exposes the account's real rate-limit utilisation at
GET https://api.anthropic.com/api/oauth/usage, authenticated with the same
OAuth token Claude Code already stores locally. The response carries
five_hour.utilization, seven_day.utilization and their resets_at
timestamps.
The figures are therefore read from the server, not estimated locally — the
same numbers the usage page shows. Percentages are passed through in the
server's own units with no rescaling, and the reset countdowns count down to
those resets_at instants, recomputed against the clock each time the bar
redraws. A window the API reports no resets_at for simply gets no countdown.
Every percentage the meter shows is one of these readings. The single
exception is the optional projection described below, which is derived, is off
by default, and is labelled est. wherever it appears.
An earlier version of this extension computed token counts from transcript
files and disclaimed that it could not show a percentage, because the
denominator is server-side. That was true of the transcripts, but wrong about
the account: the usage endpoint publishes the percentage directly. The
transcript path has been replaced.
Fable 5
On Max plans Fable 5 is included, and draws from your weekly limit — you can
spend up to half of it on Fable. It also draws down usage faster than other
models. So Fable is a sub-cap on the weekly pool, not a separate allowance; a
low Fable figure is not headroom that exists independently of the weekly bar.
The Fable figure arrives in the response's limits array — a list of windows,
each carrying its own percent, resets_at and, for per-model rows, a
scope.model.display_name:
{ "kind": "weekly_scoped", "group": "weekly", "percent": 37,
"resets_at": "2026-08-05T20:00:00Z", "is_active": true,
"scope": { "model": { "id": null, "display_name": "Fable" } } }
It is not under a flat seven_day_fable-style key; no response has ever carried
one. The extension:
- reports the window whose
display_name names Fable, labelling it with
that server-supplied name rather than a hardcoded one, or
- states its absence if no such window is present — a
Fable — segment on
the bar and a Weekly Fable — not reported row in the tooltip — never an
invented figure.
A model_scoped array — the shape Claude Code's own Account & Usage panel
reads — and the flat legacy keys are both still accepted as fallbacks, so an
account or server version that sends either keeps working.
It never derives a Fable percentage from an assumed denominator. A number
invented from a guessed limit would look exactly like a real reading, which is
the one thing this extension will not do.
Other models
Fable is the default because it is the window with a sub-cap worth watching,
but it is only the default. claudeUsageMeter.models takes any window the API
names — ["Fable", "Opus"], ["*"] for all of them, [] for none — matched
case-insensitively and rendered in the order you list them. Until 0.4.0 the
Opus and Sonnet windows were parsed and then discarded.
A model segment looks the same on the compact bar as on the labelled one:
Fable 12%, named. Compaction strips 5h and 7d because position still
says which of those figures is which — except on a figure that has reached your
warning threshold, which gets its label back for as long as it holds it. A model
window has no position, so its name is the only thing that says what the figure
measures, and it stays in every case.
(v0.4.15 briefly moved these segments into the tooltip until they warned,
which read as the meter losing Fable rather than tidying it — the release
after put them back.) Each also keeps its own named Weekly <name> row in
the hover.
Names are matched by containment rather than equality, so a server-side rename
from Fable to Fable 5 still resolves. That is the same reason the label
shown is the server's own and not a hardcoded one: a rename should show
through, not silently drop the segment.
A name you ask for that the API does not report renders —, so a window your
account genuinely lacks looks different from a typo. ["*"] can only render
what arrived, so when nothing does the tooltip says so rather than leaving a
gap.
When the API grows a field
A real response carries about a dozen per-model keys that are all null —
seven_day_opus, cinder_cove, tangelo and others. Today none of them holds
a figure. If one starts to, a parser that reads only what it already knows
about would ignore it, and the symptom would be a window your account has and
the meter silently omits, with nothing anywhere to suggest looking.
So the meter names what it did not read. Show Details lists any field
carrying a real value that this build has no rendering for, and the output
channel says so once when it first appears:
Reported but not displayed by this version: (nothing — every figure carrying a value is shown)
Only fields holding an actual number count. Listing the nulls would be a
permanent warning about nothing, which is the fastest way to teach someone to
ignore a warning. It is not an error either — a response that grows a field is
a working response, and the figures on your bar are unaffected. It just stops
the growth being invisible.
The one number the server did not give you
Everything above is a percentage Anthropic reported. claudeUsageMeter.showProjection
adds the one thing they do not send, and that the percentages cannot answer on
their own — am I going to run out?
⟳ 21% (resets in 2h 11m) · 62% (resets in 4d 4h) · est. weekly full in 2d 4h
It is a rate fitted to readings the meter took itself, extrapolated to 100%. So
it is the only figure here that could be wrong without the server having been
wrong, and it is treated accordingly:
- it is off unless you turn it on. The claim that every number on your
status bar came from Anthropic is worth more than this feature is, and
switching it on for everyone would qualify that claim for everyone;
- it is labelled
est. in the bar, not just the tooltip, so it cannot be
mistaken for a reading by someone who does not hover;
- the tooltip states its basis — how many readings, over how long — because
a projection from three readings over half an hour and one from forty over a
day are different claims, and you are the one who has to weigh them.
It says nothing at all unless there is something to say. No projection appears
when there are fewer than 3 readings, when they span under 30 minutes,
when the rate is flat or falling, when the window is already full, or when the
reading it would hang from is no longer current. With too little history the
honest output is no projection, not a vaguer one.
The suppression that matters most: a projection landing after the window
resets is not shown. That is the good case — you are not going to run out —
and "full in 9d" against a window that resets in 4d is noise wearing the
clothes of a warning.
Two things the series handles that a naive rate does not. A reset is a
discontinuity, not a negative burn rate: readings from before the last reset
are discarded, detected both by resets_at moving and by utilisation falling,
since usage does not go down on its own. And gaps are ordinary — VS Code is
not always open and laptops sleep, so a fourteen-hour hole in the series is
expected and is not itself a reason to refuse.
Absence is rendered as absence
If the token is missing, the request fails, or the response is malformed, the
meter shows ⃠ Claude usage — — the slashed circle and the em dash, with the
reason in the tooltip. It does not show 0%, because a zero looks like a
successful reading of an untouched quota.
That item used to be dimmed as well, and is not any more: the colour it was
dimmed to could not be seen on most status bars, so the claim was moved onto
the icon and the dash, which render everywhere. See
Telling the figures apart, and
claudeUsageMeter.absentForeground if you want the dimming back. A failed refresh replaces the previous state rather than leaving a
stale percentage on screen dressed as current.
There is no demo mode and no simulated data.
The one exception: a throttled endpoint
HTTP 429 is the single failure treated differently, because it means ask
later, not there is no data. Blanking a valid percentage because the server
asked us to slow down is the mirror-image of showing stale data as live — both
misreport freshness.
So on a 429 the meter keeps the last real reading and states its true age
in the status bar itself:
🕘 4% (resets in 3h 2m) · 26% (resets in 5d 1h) · 12m old
The rules that keep this honest:
- the age comes from the
receivedAt stamped when that response arrived, not
from the request and not from a guess;
- it is shown in the bar, not hidden in the tooltip, so it cannot read as
current to anyone who does not hover;
- the live
$(pulse) icon is swapped for $(history);
- past 30 minutes the reading is dropped entirely and the meter returns to
—, because by then it says more about when we last got through than about
current usage;
- only a 429 earns this. A network error or an auth failure blanks the meter,
since those can mean the machine or the account changed underneath us.
Behind that, the poll backs off exponentially (capped at 30 minutes) and
honours the server's Retry-After whenever it asks for longer than our own
backoff — never for shorter, or a cooperative server could be talked into a
tighter loop than you configured. A manual Refresh Now clears the backoff.
Ageing, when nothing failed at all
A throttle is not the only way a figure stops being current. A suspended
machine does not run its timers: shut the lid at 40% and open it three hours
later, and the last successful reading is three hours old while nothing in the
meter's state says a fetch ever failed.
Until 0.4.0 that rendered with the live icon and no age anywhere, and the
tooltip said "Updated 4m ago" — the age computed when the poll ran, frozen on
screen ever since. Both were wrong in the direction that matters.
Now the age is recomputed against the clock rather than at poll time, and any
reading past twice your refresh interval is shown the same way a throttled
one is: $(history), and its true age in the bar. The multiple is derived from
your own interval rather than fixed, because "overdue" only means anything
relative to how often this install actually polls — missing one poll is
ordinary, missing two is not.
Focusing the window also asks for a fresh reading, which is why waking a laptop
usually corrects the meter before you have finished reading it. That request is
an ordinary one, not a manual refresh: it goes through the same cross-window
coordination and the same backoff, so alt-tabbing cannot walk through a
throttle the account is meant to be waiting out.
Install
Search for Claude Usage Meter in the Extensions view, or:
code --install-extension shivakrishnakokkula.claude-usage-meter
It is published to Open VSX as well, which is where the forks get their
extensions — Cursor, Windsurf and VSCodium among them — since Microsoft's
marketplace is restricted to official VS Code builds. The same search finds it
there. No per-editor command is listed because the forks name their CLIs
differently and several do not document the flag; codium and code-server do,
and take the same identifier as above.
Whichever editor you install it in, it reads a Claude Code sign-in and not that
editor's own — see Which sign-in it reads.
To build from source instead:
npm ci
npm test
npx @vscode/vsce package --allow-missing-repository --out claude-usage-meter.vsix
code --install-extension claude-usage-meter.vsix
Then reload the window. Or press F5 for an Extension Development
Host.
Keeping it up to date
A marketplace install updates itself; nothing below is needed. The rest of this
section covers the parallel GitHub Release channel, which exists for machines
that install the .vsix directly.
push to main → CI tests → version bump → Marketplace + GitHub Release (.vsix)
↓
scheduled task installs it → reload VS Code
The pipeline. .github/workflows/release.yml runs on every push to main.
It tests, resolves the version (bumping the patch number if the current one is
already tagged, so nothing needs tagging by hand), packages, tags, attaches the
.vsix to a GitHub Release, and publishes to the marketplaces. Everything after
the test step is gated on a green suite, so a broken commit never becomes a
release.
The GitHub Release needs only the automatic GITHUB_TOKEN. Marketplace
publishing needs VSCE_PAT (Visual Studio Marketplace) and OVSX_PAT
(Open VSX) as repository secrets; each publish step is skipped when its secret
is absent, so a fork without tokens still releases.
The installer. scripts/update.ps1 compares the installed version against
the latest release and installs the release artifact when they differ:
./scripts/update.ps1 # install if a newer release exists
./scripts/update.ps1 -Force # reinstall regardless
It installs the exact artifact CI built and tested rather than rebuilding
locally, so no build toolchain is needed on the target machine — only gh
(for auth) and code. It exits silently when already current, which makes it
safe to run on a schedule.
One residual manual step VS Code imposes: an updated extension only takes
effect after the window reloads.
To run it on a schedule:
Run this from the repository root. A scheduled task needs an absolute path, so
the path is resolved rather than written out, which keeps the snippet correct on
any machine:
$script = (Resolve-Path .\scripts\update.ps1).Path
$action = New-ScheduledTaskAction -Execute 'powershell.exe' `
-Argument "-NoProfile -ExecutionPolicy Bypass -File `"$script`""
$trigger = New-ScheduledTaskTrigger -Daily -At 9am
Register-ScheduledTask -TaskName 'claude-usage-meter-update' -Action $action -Trigger $trigger
Remove it with Unregister-ScheduledTask -TaskName 'claude-usage-meter-update'.
update.ps1 is not shipped inside the VSIX — it is a repository script for
bootstrapping a machine that installs releases directly. An extension installed
from a marketplace has no use for it.
Preview without VS Code
Renders exactly what the status bar and tooltip would show, and lists the field
names the API returned. Your token is never printed.
npm run preview
Settings
| Setting |
Default |
Meaning |
claudeUsageMeter.refreshIntervalSeconds |
300 |
How often to re-query the endpoint (minimum 60), machine-wide — every window shares one request. Short intervals cause HTTP 429, not fresher numbers — see below. |
claudeUsageMeter.showSession |
true |
Show the 5-hour percentage. |
claudeUsageMeter.showWeekly |
true |
Show the 7-day percentage. |
claudeUsageMeter.showResets |
true |
Attach each window's reset countdown to its segment — 23% (resets in 4d 4h). It is the API's own resets_at counted down against the clock. Off saves width; the tooltip shows the countdowns either way. |
claudeUsageMeter.compact |
true |
Keep the bar to the figures: 2% (resets in 4h 30m) · 31% (resets in 3d 14h) · Fable 49%. Off restores the labelled bar — 5h 2% (…) · 7d 31% (…) · Fable 49%. Model windows keep their name in both modes, and a figure that reaches warnAtPercent gets its label back; the tooltip is identical in both. |
claudeUsageMeter.models |
["Fable"] |
Per-model windows to show, by the API's own names. ["*"] for all, [] for none. |
claudeUsageMeter.showFable |
true |
Deprecated — superseded by models. Still honoured: set to false with no models configured, no model windows are shown. |
claudeUsageMeter.showProjection |
false |
Estimate when a window will fill at your current rate. The one derived number here — see above. |
claudeUsageMeter.warnAtPercent |
90 |
Amber-highlight a figure once it reaches this percentage, compared against the figure as shown, and put a $(warning) icon in front of it. With itemPerFigure on, only that figure is highlighted; with it off the whole meter is. Either way the figure that crossed the line gets its 5h/7d label back on the compact bar, so the alarm says which window it means. The icon is there because the amber is a background, and High Contrast Dark paints none. |
claudeUsageMeter.itemPerFigure |
true |
Draw the meter as one status bar item per figure — which is what lets the amber land on the one figure that crossed warnAtPercent, and what lets each figure carry a colour of its own if you set one. Off draws a single item, · separators included, with the same text. |
claudeUsageMeter.colorSegments |
true |
Deprecated — superseded by itemPerFigure. Still honoured: set to false with no itemPerFigure configured, the meter is still drawn as a single item. |
claudeUsageMeter.alignment |
"right" |
Status bar side. |
claudeUsageMeter.priority |
100 |
Status bar ordering. With itemPerFigure on this is the priority of the leftmost figure; the rest follow immediately behind it. |
The compact bar is three percentages and two dots — until one of them reaches
your warning threshold, which is the one case below. That is the display this
extension ships, and for anyone reading it quickly the hard part was never the
numbers — it was working out which number was which.
Colour was the obvious second answer, and for several releases it was the
answer this extension gave: the session figure cyan, the weekly one magenta,
the per-model one green, each with a light-theme variant behind it and the
projection muted beneath them all. It does not work. The reason is worth
writing down, because the mistake has a very reasonable shape and the fix is a
rule rather than a better set of values.
A status bar item is never told what it is drawn on. VS Code lets an
extension contribute a colour with defaults keyed on the theme kind — dark,
light, highContrast, highContrastLight — and that key is the natural one
to reach for, not least because reaching for it feels like having handled the
question. It is the wrong key. Theme kind describes the editor's editor: the
background behind your code. The status bar has a background of its own,
statusBar.background, and no theme is obliged to derive one from the other.
Many deliberately do not, because a status bar that reads as a distinct surface
is the entire point of styling it. Quiet Light, a light theme by kind, paints
its status bar #705697, a mid-dark purple. Worse, the registered default
for statusBar.background is #007ACC in both polarities — so every theme
that simply declines to declare one, the classic Dark+ and Light+ among them,
gets a saturated blue bar.
So the light-theme variants — chosen with care, against a near-white bar, and
entirely correct for the bar they were chosen against — resolve exactly as
designed on Quiet Light and land at 1.27:1 for the session figure,
1.11:1 for the weekly one and 1.32:1 for the per-model one. The floor
for small text is 4.5:1. The weekly figure at 1.11:1 is not hard to read; it is
very close to not having been drawn. On the #007ACC bar the Light+ per-model
colour measures 1.02:1.
The tempting repair is to pick better hexes, and it fails for the reason above
rather than for want of trying. Take the dark-theme variants, which are
lighter, and put them on that same purple bar: 3.00:1, 2.18:1 and 2.97:1. All
three still fail, and they now fail in a light theme, so no branch of that
four-way key contains the answer. There is no set of values that is legible
on a background you are never told. The defect was never the values; it was
believing there was a value to choose.
Two details made it survive as long as it did. It is invisible from the theme
you develop in — every measurement above had to be taken by reading another
theme's JSON, because from Dark Modern the feature looks like it works. And on
that Quiet Light bar the one figure that was comfortably legible was a Fable
window at 100%, which is over the default warnAtPercent of 90 and had
therefore already been handed statusBarItem.warningForeground on
statusBarItem.warningBackground, discarding its identity colour entirely. The
only readable figure on the bar was the one that had stopped using this
feature.
The rule
Every foreground this extension chooses for the status bar defaults to
statusBar.foreground — the colour the active theme itself nominates for
text on its own status bar — chosen by the only party that has seen both the
text colour and the background it lands on.
That is deference, and it is deliberately weaker than a guarantee. Inheriting
a theme's own choice means inheriting its contrast: Solarized Light pairs
#586E75 with #EEE8D5 for its own status bar text, which is 4.39:1, so the
meter is now wrong there in exactly the way that theme's branch name and line
number already are. The honest claim is never worse than the bar's own
labels, and that holds on all nineteen shipped themes. The rule also covers
the bar's ordinary background: VS Code repaints the whole bar during a
debug session and with no folder open, and an item that names a colour writes
it inline and does not follow statusBar.debuggingForeground there.
That is one rule and it covers five things that used to be handled separately:
the session, weekly and per-model figures, which carried hexes; the projection,
which carried descriptionForeground; and an unreported window's em dash,
which carried disabledForeground. It is worth being clear that those last two
were not more cautious choices that happened to survive. They were the same
choice — a colour picked in the dark. descriptionForeground measures 1.24:1
on that purple bar, which is the muted projection rendered nearly invisible
rather than tastefully quiet, and disabledForeground fails the floor on
18 of the 19 shipped themes, reaching 1.02:1. A colour is not conservative
because it is grey.
VS Code has already conceded the whole point in its own registration, which is
the strongest evidence available that this is not an over-correction:
statusBar.foreground defaults to #FFFFFF in light themes as well as
dark ones. The editor will not key that colour on theme kind either, because
status bar backgrounds are chromatic and dark often enough that doing so would
be wrong. An extension knows strictly less than the editor does. It should not
be making the bolder assumption.
The one exception stays, and it stays for a stated reason rather than by having
been overlooked. A figure at or over warnAtPercent takes
statusBarItem.warningForeground on statusBarItem.warningBackground, because
that amber is the one background this extension asks for, and so the one
background it is entitled to know. A colour chosen against an unknown
background is precisely the colour you cannot trust on a known one — nobody
picks cyan with amber in mind. VS Code settles it identically and does not
consult us: an entry given a warning background is converted into a warning
kind on the way across and its own color is dropped in the conversion, so a
colour returned there would be a decision invisible in the code and an effect
invisible on the bar.
What carries identity instead
Dropping the hues costs a channel, and it is worth being exact about what
remains rather than claiming nothing was lost.
Position says which of the first two figures is which — session first, then
weekly. It said so before the colours existed, it is why the 5h and 7d
labels came off in the first place, and it is unaffected by any of this. A
per-model window has no position to lean on, so it keeps its own name on the
bar in both compact and labelled modes: Fable 12% is self-describing in a way
that 12% is not, the name is the server's own string rather than a hardcoded
one, and no theme can wash a word out. A figure that reaches your warning
threshold gets its 5h or 7d label back for as long as it holds it, so the
one figure carrying an alarm always names its subject in text — a rule that
used to be justified by the amber taking the figure's colour away, and which
now rests on the plainer ground that an alarm must say what it is about. The
alarm itself is in the text too, as a $(warning) icon in front of the figure:
the amber is a background, and there is one shipped theme — High Contrast Dark
— for which VS Code registers no warning background at all, so the highlight is
simply never painted there. A
window the API did not report reads 5h — or Fable —, keeping its label for
the same reason: 5h — states an absence, where a bare — between two
separators merely is one. Every item is named in the status bar's own show/hide
menu. And the hover names every figure in full, with the reset countdown, the
sub-cap explanation, and the warning written out in words — at or over your 90% warning level — because a claim carried only by a background colour is a
claim some readers are never shown.
That accounting is the honest one, and reading it back is what settled the
question. Colour was described in this README as saying it "a second time": a
redundant channel, laid over channels that already worked. A redundant channel
that fails to render costs you a redundant channel. But the thing rendered in
that channel here was the figure itself — not a label beside it — so a hue
that failed to render did not cost a nicety, it cost the reading. That is the
difference between a feature that degrades and a defect.
One loss is real and is not being smuggled past you. An unreported window and
the whole-meter "no reading" item used to be dimmed, which said "this is not
a figure" on the colour channel as well as in the text. They are not dimmed by
default any more, because the colour they were dimmed to was the one that
failed on 18 themes out of 19 — a channel that does not render was not
reinforcing anything. The claim now rests on the text and the icon: 5h —
keeps its label and its hover row reads — not reported; the whole-meter case
keeps its slashed circle, and its hover reads No usage data: … above This is not a reading of zero usage. If you want the dimming back,
claudeUsageMeter.absentForeground is exactly that knob, and you are in a
position to set it safely because you can see your own status bar.
The Claude Code status line that ships with this extension reached the same
conclusion first, and by a much shorter route: it puts its colour on the 5h
and 7d labels and leaves the percentages in the terminal's default
foreground, on the reasoning that a faint 7d is a label you read as text
while a faint 41% is a number you cannot read at all. A terminal's background
is so obviously unknowable that the temptation never arose. The status bar has
now been brought into line with the script it installs, rather than the other
way round.
Customising it anyway
The five ids stay declared, and they stay declared because the defaults are
now conservative — a default that refuses to guess is only reasonable if there
is a supported way to be specific:
claudeUsageMeter.sessionForeground, claudeUsageMeter.weeklyForeground,
claudeUsageMeter.modelForeground, claudeUsageMeter.projectionForeground
and claudeUsageMeter.absentForeground. A theme can restyle any of them, and
so can you.
You know the thing the extension does not: which theme you are running, and
therefore what colour your status bar actually is. So say it explicitly.
Scope the customisation to the theme you checked it against, using
workbench.colorCustomizations' per-theme form, so that it cannot follow you
into a theme where it would be illegible:
"workbench.colorCustomizations": {
"[Quiet Light]": {
"claudeUsageMeter.sessionForeground": "#DDEEFF",
"claudeUsageMeter.weeklyForeground": "#F8E4F5",
"claudeUsageMeter.modelForeground": "#D6F2E6"
}
}
Those three are worked against Quiet Light's actual status bar, #705697, and
clear the small-text floor with room to spare — 5.12:1, 5.02:1 and 5.11:1,
against a required 4.5:1. They are near-white tints rather than hues, and that
is not timidity. On a mid-dark chromatic bar the only axis with real range left
is lightness, so a set of colours that are all legible there must all be light,
and the difference between them has to be carried by a slight cast over a
common brightness: a cool blue on the session figure, a warm pink on the weekly
one, a green on the model one. It is a quieter distinction than cyan against
magenta. It is also a distinction you can see, which the loud one was not.
The theme scope is the entire lesson of this section, so it is worth stating as
an instruction rather than leaving it to be inferred from an example. An
unscoped block is a global claim about a background made by somebody who has
looked at exactly one — which is the shipped defaults' own mistake, reproduced
by hand in your settings file, where nothing will ever review it. Switch to a
dark theme with a near-black bar and #F8E4F5 is fine; switch to one with a
pale bar and you have written yourself the same 1.1:1 that started all this,
and you will have written it deliberately. The scoped form expires when the
assumption behind it does, which is the only property that makes a hardcoded
colour safe to hold.
If you want to do this for a theme not listed here, the check is short. Find
the theme's colour file and read statusBar.background out of it — for the
built-in themes that is under the editor's
resources/app/extensions/theme-*/themes/ directory — and take the contrast
ratio of your candidate against that value, not against the editor background
and not against the theme's kind. A theme that declares no
statusBar.background at all is inheriting one you cannot see from the file,
and the honest answer there is to leave the defaults alone.
Why the bar is drawn as several items
VS Code gives a status bar item exactly one foreground colour and exactly one
background colour, and after the change above it is the second of those that
shapes the bar. A meter drawn as a single item can raise only one alarm, about
all of its figures at once — which is how the amber used to behave, announcing
something here is at 95% to a bar that had deliberately dropped the labels
that would have told you which. So the meter draws as one item per figure, and
since the identity colours are no longer the reason by default, that is the
reason that survives for everyone: the highlight lands on the figure that
actually crossed warnAtPercent. Per-figure items are still what makes a
per-figure colour possible at all, for anyone who sets one.
The cost is the separators. With several items the · between figures is
replaced by the status bar's own spacing, which makes for a slightly looser bar
than the one this README opens with. That trade is described here rather than
left to be discovered, and it is not a close one: a warning that names its own
subject is worth two dots.
That split is claudeUsageMeter.itemPerFigure. It used to be half of a setting
called claudeUsageMeter.colorSegments, and fusing the two was a smaller
version of the same error this section is about: a reader who wanted no
identity colours had to pay for that preference with the per-figure warning
highlight, which has nothing to do with colour and is much the more important
of the two. There is no colour switch any more, and that is deliberate rather
than an omission — with every identity colour resolving to
statusBar.foreground, a colour switch would do nothing at all for anyone who
had not written workbench.colorCustomizations, and for anyone who had it
would let this extension override a colour they set by hand. Overrides do not
travel in that direction. The off switch for a colour is the colour id itself.
colorSegments is deprecated and still honoured, so nobody's bar changes shape
on upgrade: if you set it to false and have not configured itemPerFigure,
the meter is still drawn as a single item. Set itemPerFigure and it wins.
With the bar drawn as one item the whole meter turns amber together, and there
the restored 5h/7d label is the only thing saying which figure raised the
alarm — a stronger reason for keeping it rather than a weaker one.
Why the interval is 5 minutes
The endpoint rate limits hard. The original 60-second default predated
cross-window sharing, so every open VS Code window ran its own poller —
three windows meant three requests a minute, roughly 4,300 a day, against
windows measured in 5 hours and 7 days. The precision was imaginary and the
cost was a permanently throttled endpoint: during development, 12 consecutive
probes over 15 minutes were all refused. The default retreated to 10 minutes.
Two things have changed since. Every window on the machine now shares one
request, so the default is a machine-wide cadence rather than a per-window
one — 5 minutes is 12 requests an hour no matter how many editors are open.
And a day of shared 10-minute polling was measured against the endpoint with
zero refusals before the default came down to 5.
Lowering this below a minute is not possible, and lowering it further buys
little: the figures are whole percent over 5-hour and 7-day windows, so most
of what a tighter poll fetches is the same number again. On a 429 the meter
backs off exponentially whatever this is set to.
One reading per machine
Every window shares a single request rather than making its own. Whichever
window comes due first takes a lock, asks, and publishes the answer where the
others can read it; the rest render that, with its true age, instead of asking
again. The backoff is shared too, so a 429 slows the machine down once rather
than being rediscovered separately by every window.
Until 0.4.3 that snapshot lived in the extension's own global storage, which is
per editor rather than per machine — VS Code resolves it under Code/User,
Cursor under Cursor/User. Running two of them side by side therefore produced
two independent pollers, which is the exact failure this mechanism exists to
prevent, reintroduced by the choice of directory. It now lives in
~/.claude-usage-meter/, so every editor on the machine shares one reading —
and so anything else can read it too, which is what makes the status line below
free.
Deliberately not inside ~/.claude: that belongs to Claude Code, and a cache of
ours has no business sitting among files another program owns.
In your terminal, as a Claude Code status line
scripts/claude-statusline.mjs renders the same figures into
Claude Code's status line:
5h 17% (resets in 2h 4m) · 7d 41% (resets in 5d 12h) · Fable 48%
It keeps the 5h/7d labels the status bar no longer shows, deliberately: a
terminal line has no hover, so the labels are the only place a figure's name
can live there.
Those labels are what carries the colour: 5h cyan, 7d magenta, the model
name green, from the sixteen basic ANSI colours your own terminal theme
remaps. The percentages, the em dashes and the age are left in the default
foreground on purpose, so the colour goes where being washed out on some light
profile would cost you a redundant channel rather than the reading itself. A
faint 7d is a label you read as text instead of as a colour; a faint 41% is
a number you cannot read at all.
That is the same argument the status bar now makes, and this script got there
first. Both surfaces refuse to guess at a background they are not told; the
difference is only that a terminal's background is so obviously unknowable that
the temptation never arose here, while a contributes.colors block keyed on
theme kind looked enough like an answer to survive several releases. The status
bar was brought into line with this script, rather than the other way round —
and the escapes below have not changed, because sixteen colours a terminal
theme remaps for itself are not the thing that was wrong.
The age is deliberately not dimmed. It used to be, which was this line quietly
doing the thing the status bar refuses to do — making the one annotation that
exists to be noticed the faintest text on screen. --plain or NO_COLOR=1
emits no escape sequences at all.
The extension installs it for you. Run Claude Usage Meter: Install Claude Code
Status Line from the Command Palette.
It has to be installed rather than run where it sits, because a statusLine
command is a literal string in ~/.claude/settings.json and an extension
directory carries its version in its name — so a path pointing inside one stops
resolving at the next update, silently. Fetching it from the repository is not
an option either: this one is private, so the raw URL that would otherwise be
the obvious answer serves a 404 to everybody, its owner included.
So the command copies the script next to the shared snapshot, at
~/.claude-usage-meter/claude-statusline.mjs, and prints the settings snippet
into its output channel for you to paste — built from the real path, which on
Windows is neither ~-relative nor forward-slashed:
// ~/.claude/settings.json
{
"statusLine": {
"type": "command",
"command": "node /home/you/.claude-usage-meter/claude-statusline.mjs"
}
}
Re-running it is safe, and each extension update refreshes a copy you have
already installed, so the script cannot drift from the extension that feeds it.
Nothing is written for anyone who has not run the command.
It makes no network request, and that is the design rather than a
simplification. Claude Code debounces the status line at 300ms and cancels a
script still running when the next update arrives, so a command that called an
aggressively rate-limited endpoint would be both killed constantly and the
fastest way yet devised to earn your account an HTTP 429. It reads the snapshot
the extension already maintains, so showing usage in your terminal costs zero
extra requests.
The consequence, stated plainly: if no editor is running, nothing refreshes
that snapshot. The line then ages, says so —
5h 17% (resets in 1h 39m) · 7d 41% (resets in 5d 11h) · Fable 48% · 25m old —
and past 30 minutes shows claude — rather than presenting a figure from this
morning as if it were current. It is subject to every rule the status bar is.
The countdowns keep counting through the ageing, because resets_at is an
absolute instant that stays true while the percentage beside it does not.
One scoping note: the script reads only the snapshot, so it cannot see your
editor settings — claudeUsageMeter.showResets does not reach it, and its
countdowns are always on, the same way it assumes the default poll interval
when judging freshness.
It is zero-dependency and standalone because a statusLine command has to name
a stable path, and an installed extension lives under a directory whose name
carries its version and changes on every update. That means it re-implements
the honesty rules rather than importing them, so this project's test suite runs
the real script and pins each one against the extension's own constants.
Commands
- Claude Usage Meter: Show Details — full breakdown plus the API field
names and the visible network configuration, in an output channel (also what
clicking the meter does, on any of the figures it draws)
- Claude Usage Meter: Refresh Now
- Claude Usage Meter: Open Official Usage Page
- Claude Usage Meter: Install Claude Code Status Line — see
In your terminal, as a Claude Code status line
Authentication, and what leaves your machine
This extension reads the OAuth token Claude Code has already stored for you.
Since that is a credential, here is exactly what it does with it.
Where the token is read from, in order:
CLAUDE_CODE_OAUTH_TOKEN, if set.
~/.claude/.credentials.json — tried on every platform, macOS included. It
is cheaper than spawning a process and cannot raise a system prompt, so an
account that has the file is never made to authorise a keychain read it does
not need.
- On macOS, when that file is absent or unreadable, the login keychain item
Claude Code-credentials, read via security find-generic-password. Claude
Code generally stores the credentials there rather than on disk, so without
this the meter would be blank on every Mac. The first read may raise the
system keychain prompt; declining it leaves the meter blank and changes
nothing else.
Where it is sent: as a Bearer header to
https://api.anthropic.com/api/oauth/usage, and nowhere else. The extension
makes no other network request — no telemetry, no analytics, no update check of
its own.
What is never done with it: the token is never logged, never written to the
output channel, never included in an error message, and never persisted anywhere
by this extension. Failure messages name which store failed, never its
contents. There is a unit test asserting that no failure reason can echo the
credential blob.
The extension only ever reads your credentials; it never writes or refreshes
them. If the token expires, re-authenticate in Claude Code.
When the credential store carries an expiresAt that has already passed, the
meter says so and skips the request instead of spending a poll on a 401 it can
already predict. That check is deliberately timid, because the cost of getting
it wrong is asymmetric — a request wasted is one request, a token wrongly
judged expired is a meter that never asks again. So it only fires when the
value is a plausible timestamp in a plausible range, and only once it is more
than five minutes past. Anything unparseable, absent, or out of range is
treated as a field we do not understand, and the request is made as normal.
The units are read by magnitude, seconds or milliseconds, the same way the
usage response's resets_at is: a seconds value misread as milliseconds lands
in 1970, which looks exactly like a long-dead token.
Which sign-in it reads
The meter has no credential of its own, and the lookup above is the same code in
every editor: nothing in it asks the host what it is, or consults the editor's
own account. What it needs is one of those three artifacts present on the
machine — in practice, a Claude Code sign-in.
Using Claude through an editor's own AI features does not by itself leave a
token where the meter can find it. That matters most in the forks, where the
extension is installable but the editor's Claude integration is its own: someone
who has only ever signed in to Cursor or Windsurf, and never to Claude Code, has
nothing for the meter to read. It reports that as absence, with the reason in
the tooltip, rather than as a zero — see Absence is rendered as absence.
CLAUDE_CODE_OAUTH_TOKEN is the exception: it needs no Claude Code install at
all. Set it after the editor launched and the editor must be quit and started
again from a shell that has it — reloading the window is not enough, because the
reload reuses the same main process, and a process cannot acquire an environment
it did not start with.
Remote windows, and which machine gets read
In a Remote-SSH, WSL or Dev Container window there are two machines, and
~/.claude/.credentials.json means a different file on each. Which one the
meter reads is decided by where VS Code runs the extension host, not by
anything in this code.
VS Code runs an extension with an entry point on the remote host unless the
extension says otherwise, so until 0.4.0 a remote window looked for a Claude
Code sign-in on the server and reported honest absence when it found none —
indistinguishable, from the tooltip, from not being signed in at all. The
manifest now declares "extensionKind": ["ui", "workspace"], which prefers the
local machine: the extension reads a user-level credential and draws a status
bar item, and touches nothing in the workspace.
If your Claude Code install is the one on the remote host, that preference is
the wrong way round for you. Move it back per-window:
// settings.json
"remote.extensionKind": {
"shivakrishnakokkula.claude-usage-meter": ["workspace"]
}
Restricted Mode is the same class of problem with a blunter symptom: an
extension that declares nothing is disabled entirely in an untrusted folder.
The manifest now declares support, because nothing the meter does is derived
from workspace content — a fixed URL, a path under your home directory, and on
macOS a security call with a fixed argument vector. Opening an untrusted
folder no longer takes the meter away with it.
Behind a proxy or a VPN
The one request this extension makes goes through VS Code's own network stack,
not around it. Since VS Code 1.96 the extension host replaces globalThis.fetch
with a proxy-aware version, so the meter inherits whatever the editor already
resolves — including PAC and WPAD scripts, the operating system's proxy
settings, proxy authentication, and the OS certificate store. There is nothing
to configure here, and no proxy setting of our own to get wrong.
That is also why this extension bundles no HTTP client. Supplying our own would
be worse: under the default http.proxySupport: "override" VS Code discards a
caller-supplied dispatcher anyway, and the version we could ship would read
environment variables only — no PAC, no authentication, no system trust store.
What is left is telling you when the network is the obstacle. A failed request
names what actually failed rather than reporting fetch failed:
| What happened |
What the tooltip says |
| Proxy demanded credentials |
a proxy on this network requires authentication (HTTP 407)… |
| Proxy refused the host |
a proxy on this network refused the connection to api.anthropic.com (HTTP 403)… |
| TLS intercepted |
TLS certificate rejected… check http.systemCertificates and that your organisation's root certificate is installed |
| DNS failure |
network error: getaddrinfo ENOTFOUND api.anthropic.com [ENOTFOUND] |
The last row is deliberately plain. A name that will not resolve is not evidence
of a proxy — it is far more often a dropped connection — and saying otherwise
would send you to your IT department over wifi.
Two things worth knowing. On VS Code older than 1.96 the extension host does
not patch fetch, so no proxy setting can route this request; the failure will
still be described, but only upgrading the editor fixes it. And VS Code resolves
the effective proxy itself, so a PAC-configured proxy is invisible from inside
an extension — an empty http.proxy does not mean no proxy is involved.
Both of those are printed where they are needed rather than left here. Show
Details ends with the network configuration this extension can actually see:
Network configuration visible from this extension
VS Code 1.104.2 — the extension host provides a proxy-aware fetch, so this request follows what the editor resolves from the settings below, PAC and WPAD scripts, the operating system's proxy configuration and the OS certificate store.
http.proxy: http://***@proxy.corp.example:8080 (set in your settings)
http.proxySupport: "override" (default)
http.proxyStrictSSL: true (default)
http.systemCertificates: true (default)
http.noProxy: ["localhost", ".corp.example"] (set in your settings)
http.proxyAuthorization: set (set in your settings) — value withheld, it is a credential
https_proxy: http://proxy.corp.example:8080 (process environment)
Caveat: VS Code resolves the effective proxy in its main process, so a proxy that comes from a PAC or WPAD script, or from the operating system's settings, does not appear anywhere above. Nothing set here does not mean no proxy is involved.
The caveat prints every time, including — especially — when every row reads
not set. That is the case where the list is most likely to be mistaken for
proof that no proxy exists, which is the wrong conclusion in exactly the
situation that most needs diagnosing. The heading says visible from this
extension for the same reason, and the environment-variable line names the six
variables it checked rather than reporting on the category.
That first sentence is assembled from what is actually in force, not from what
is usually in force. VS Code's proxy agent resolves a proxy only while
http.proxySupport is "override", "fallback" or "on", and loads the OS
certificate store only while http.systemCertificates is on — so with either
switched off the sentence drops that clause and says which setting did it.
Values are printed with their JSON type intact, because "false" is a truthy
string that leaves certificate checking on, and a block rendering it as
false would confirm the one mistake it exists to catch.
Nothing in that block is a secret. http.proxyAuthorization is a
Proxy-Authorization header, so it is reported as set or not set and its value
never printed. A proxy URL is reduced to scheme, host and port — never its path
or query, which is where a token would sit — with any credentials replaced by
***. A value that cannot be parsed down to a host is withheld whole rather
than printed on the assumption it held nothing. And because http.noProxy and
NO_PROXY are free-text boxes that people paste proxy URLs into by mistake,
each entry in them is checked for credentials too. The view is meant to be
pasted into a bug report, and every one of those rules exists so that doing so
is safe.
Feedback and reporting a problem
The quickest route is the Send feedback link in the meter's own hover, or
Claude Usage Meter: Send Feedback from the command palette. It asks what
kind of feedback — a rating, a problem, a suggestion — and opens the right tab
of the marketplace listing; for a problem report it opens the details view
alongside, so the material worth pasting is already on screen. There is no
in-editor text box because the extension has no backend: a form that collected
a message and had nowhere to send it would be worse than not asking.
Or go directly: ask in the Q & A tab of the marketplace
listing.
This repository is private, so there is no issue tracker to open — the Q & A is
the channel, and it is read.
Run Claude Usage Meter: Show Details from the command palette first and
paste the output. It carries the extension version, the last request's outcome,
the age of the current reading and the network configuration described above,
which between them answer most of the first round of questions. It is written
to be safe to paste; see the paragraph above for exactly what is withheld.
How "it is read" is kept true
Nothing pushes a notification when a question is posted, so that sentence would
otherwise rest on someone remembering to look. scripts/check-qna.ps1 polls the
tab daily and raises a Windows notification for any question it has not seen
before. A check that fails exits non-zero rather than reporting a quiet inbox,
and the script reports itself if its last successful check is more than three
days old.
This is maintainer tooling — it is not shipped in the VSIX, and it is recorded
here because a machine rebuild would otherwise drop it silently while the
listing went on making the promise. Registering it, from the repository root:
$script = (Resolve-Path .\scripts\check-qna.ps1).Path
$action = New-ScheduledTaskAction -Execute 'powershell.exe' `
-Argument "-NoProfile -WindowStyle Hidden -ExecutionPolicy Bypass -File `"$script`""
$trigger = New-ScheduledTaskTrigger -Daily -At 9:30am
$settings = New-ScheduledTaskSettingsSet -StartWhenAvailable
Register-ScheduledTask -TaskName 'claude-usage-meter-qna' -Action $action `
-Trigger $trigger -Settings $settings
It must run as a logged-on user: the notification is a WinRT toast and needs an
interactive desktop session. Remove it with Unregister-ScheduledTask -TaskName 'claude-usage-meter-qna'. Verify the notifier itself with -SelfTest, or the
un-notifiable case with -SelfTest -SimulateToastFailure, rather than waiting
for a real question to discover it is broken.
Development
npm test # compile + unit tests, no VS Code and no network required
npm run watch
src/core/usage.ts is pure and offline, so the whole response-schema contract
is unit-testable without a token. The vscode dependency is confined to
src/vscode/, and network access to src/core/client.ts.
Prior art
Claudemeter
is a far more featureful take on the same idea and is where the usage endpoint
came from. Use it if you want plan detection, context tracking and per-model
breakdowns.
Licence
MIT.