Seqcall
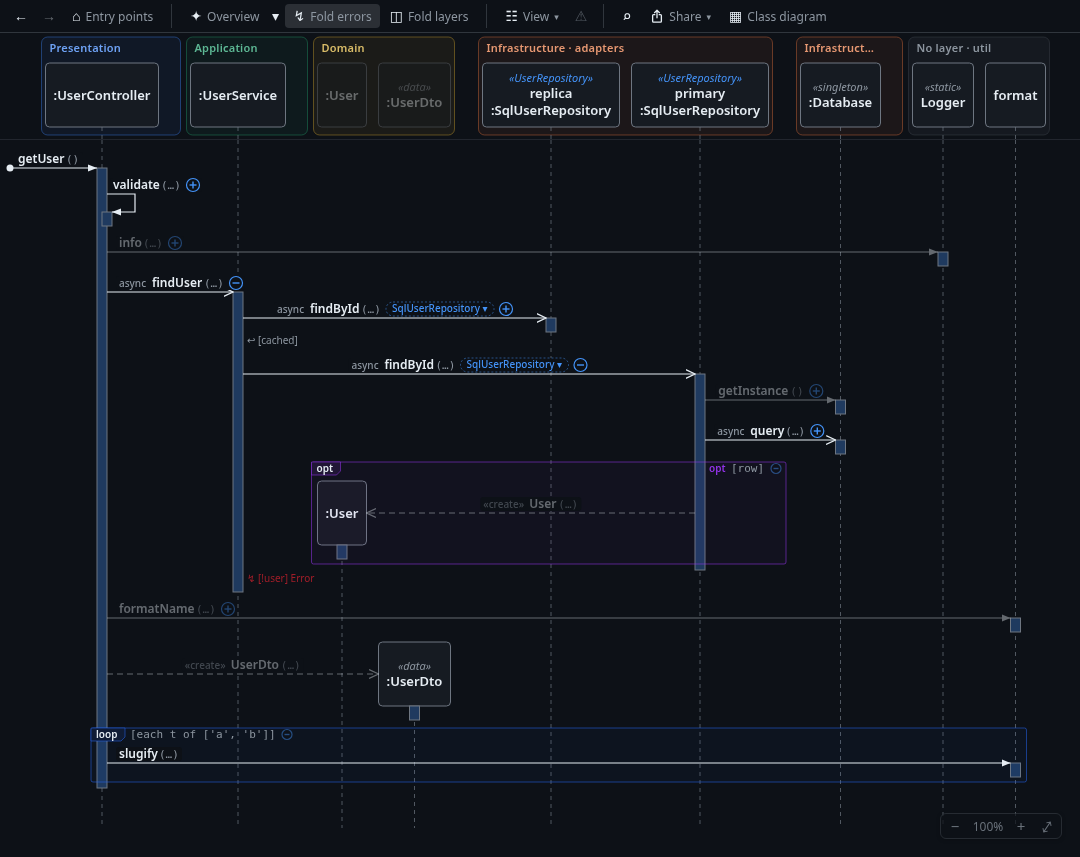
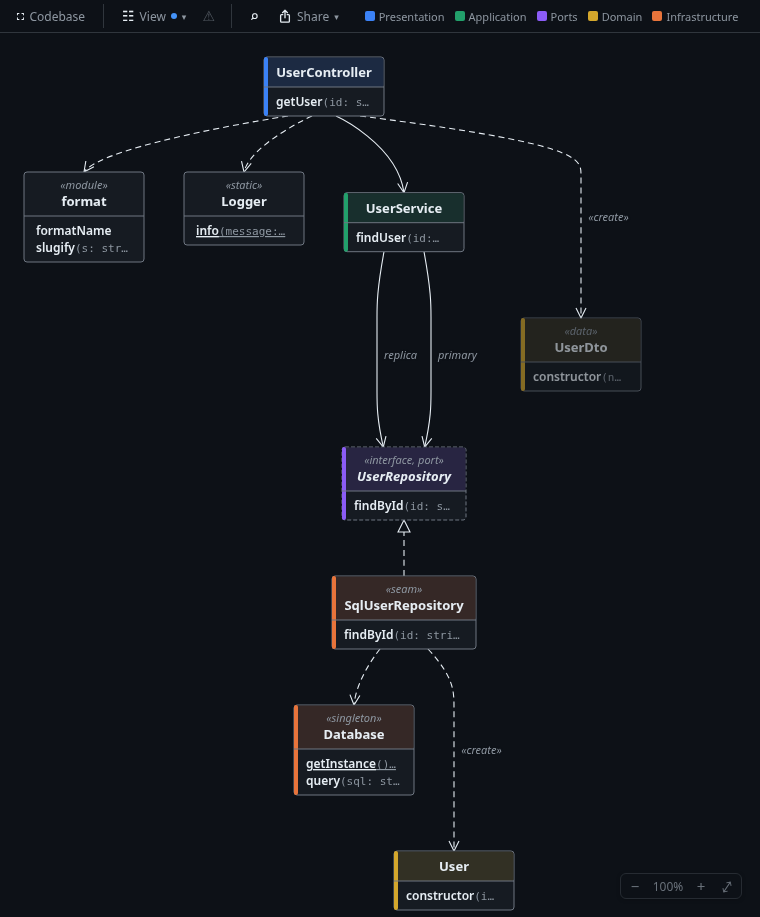
See how your code behaves. Seqcall draws an interactive sequence diagram of the method under
your cursor, together with a live class diagram of the classes taking part. Open the calls that
matter and click any element to jump to the code.
Works with TypeScript / JavaScript, C# and PHP (Laravel and plain PHP 8).
Getting started
- Open a project and a source file.
- Put the cursor inside a function or method.
- Press Ctrl+Alt+U, or right-click and choose Show Sequence Diagram.
Or run Seqcall: Show Entry Points to start from a route, main, a job or a test.
What you can do
- Expand step by step. Use ⊕ / ⊖ on a call to show or hide what happens inside it.
✦ Overview opens the important calls for you: layer crossings, services, repositories and I/O.
- Jump to the code. Click a message, participant or frame to reveal the call, class or condition in the editor.
- See conditions and loops.
alt, opt, loop and try frames show when calls are conditional or repeated.
- Spot I/O. Small badges (
DB, HTTP, FILE, MQ, …) mark calls that reach a database, the network or the disk.
- Check the architecture. The class diagram groups classes by layer and draws dependency-rule
violations in red. ⚠ lists design findings such as I/O in a loop or dependency cycles.
- Find your way. Find calls and classes (Ctrl+F), show the callers of a method, or list every path from the entry points down to it.
- See the whole codebase. ⛶ Codebase in the class diagram shows every class the entry points reach,
folder by folder, with the dependencies between folders and the layer violations. Click a folder to open it in place, ⊖ folds it again.
- Review a branch. Seqcall: Review Branch shows the changed methods, the entry points they affect and issues on the new code.
Right-click messages, participants and classes for more actions. Hidden classes, options and positions are remembered per workspace.
Commands
| Command |
Shortcut |
| Seqcall: Show Sequence Diagram |
Ctrl+Alt+U |
| Seqcall: Show Class Diagram |
|
| Seqcall: Show Entry Points |
|
| Seqcall: Show Codebase Map |
|
| Seqcall: Find in Diagram |
Ctrl+F (in a diagram) |
| Seqcall: Review Branch |
|
| Seqcall: Toggle Follow Cursor |
|
Requirements
- TypeScript / JavaScript, PHP: nothing extra.
- C#: the .NET 10 runtime and the SDK your solution uses, with packages restored (
dotnet restore).
The first diagram takes a few seconds while the solution loads.
Settings
The most useful ones (search for Seqcall in Settings):
| Setting |
Default |
|
seqcall.defaultDepth |
1 |
How many levels a new diagram opens |
seqcall.showArguments |
off |
Arguments in message labels |
seqcall.showLibraryCalls |
off |
Calls into libraries and the runtime |
seqcall.showSideEffects |
on |
I/O badges |
seqcall.showFragments |
on |
alt / opt / loop / try frames |
Most of these can also be switched in the diagram's View ▾ menu.
Layers are recognised from folder and project names (controllers, services, domain,
App.Infrastructure, …). To adjust them for your project, add an .seqcall.json file at the
project root. The quickest way is the ⚑ on a class: it suggests a layer and writes the rule for you, with Undo.
Feedback
Problems and ideas are welcome as issues. Please include the
VS Code version, your OS, the language and the Seqcall output (View → Output → Seqcall).