Understand for Visual Studio Code
Understand by SciTools is a popular platform for code comprehension and maintaining legacy code. This plugin shows the static analysis results from Understand in Visual Studio Code.
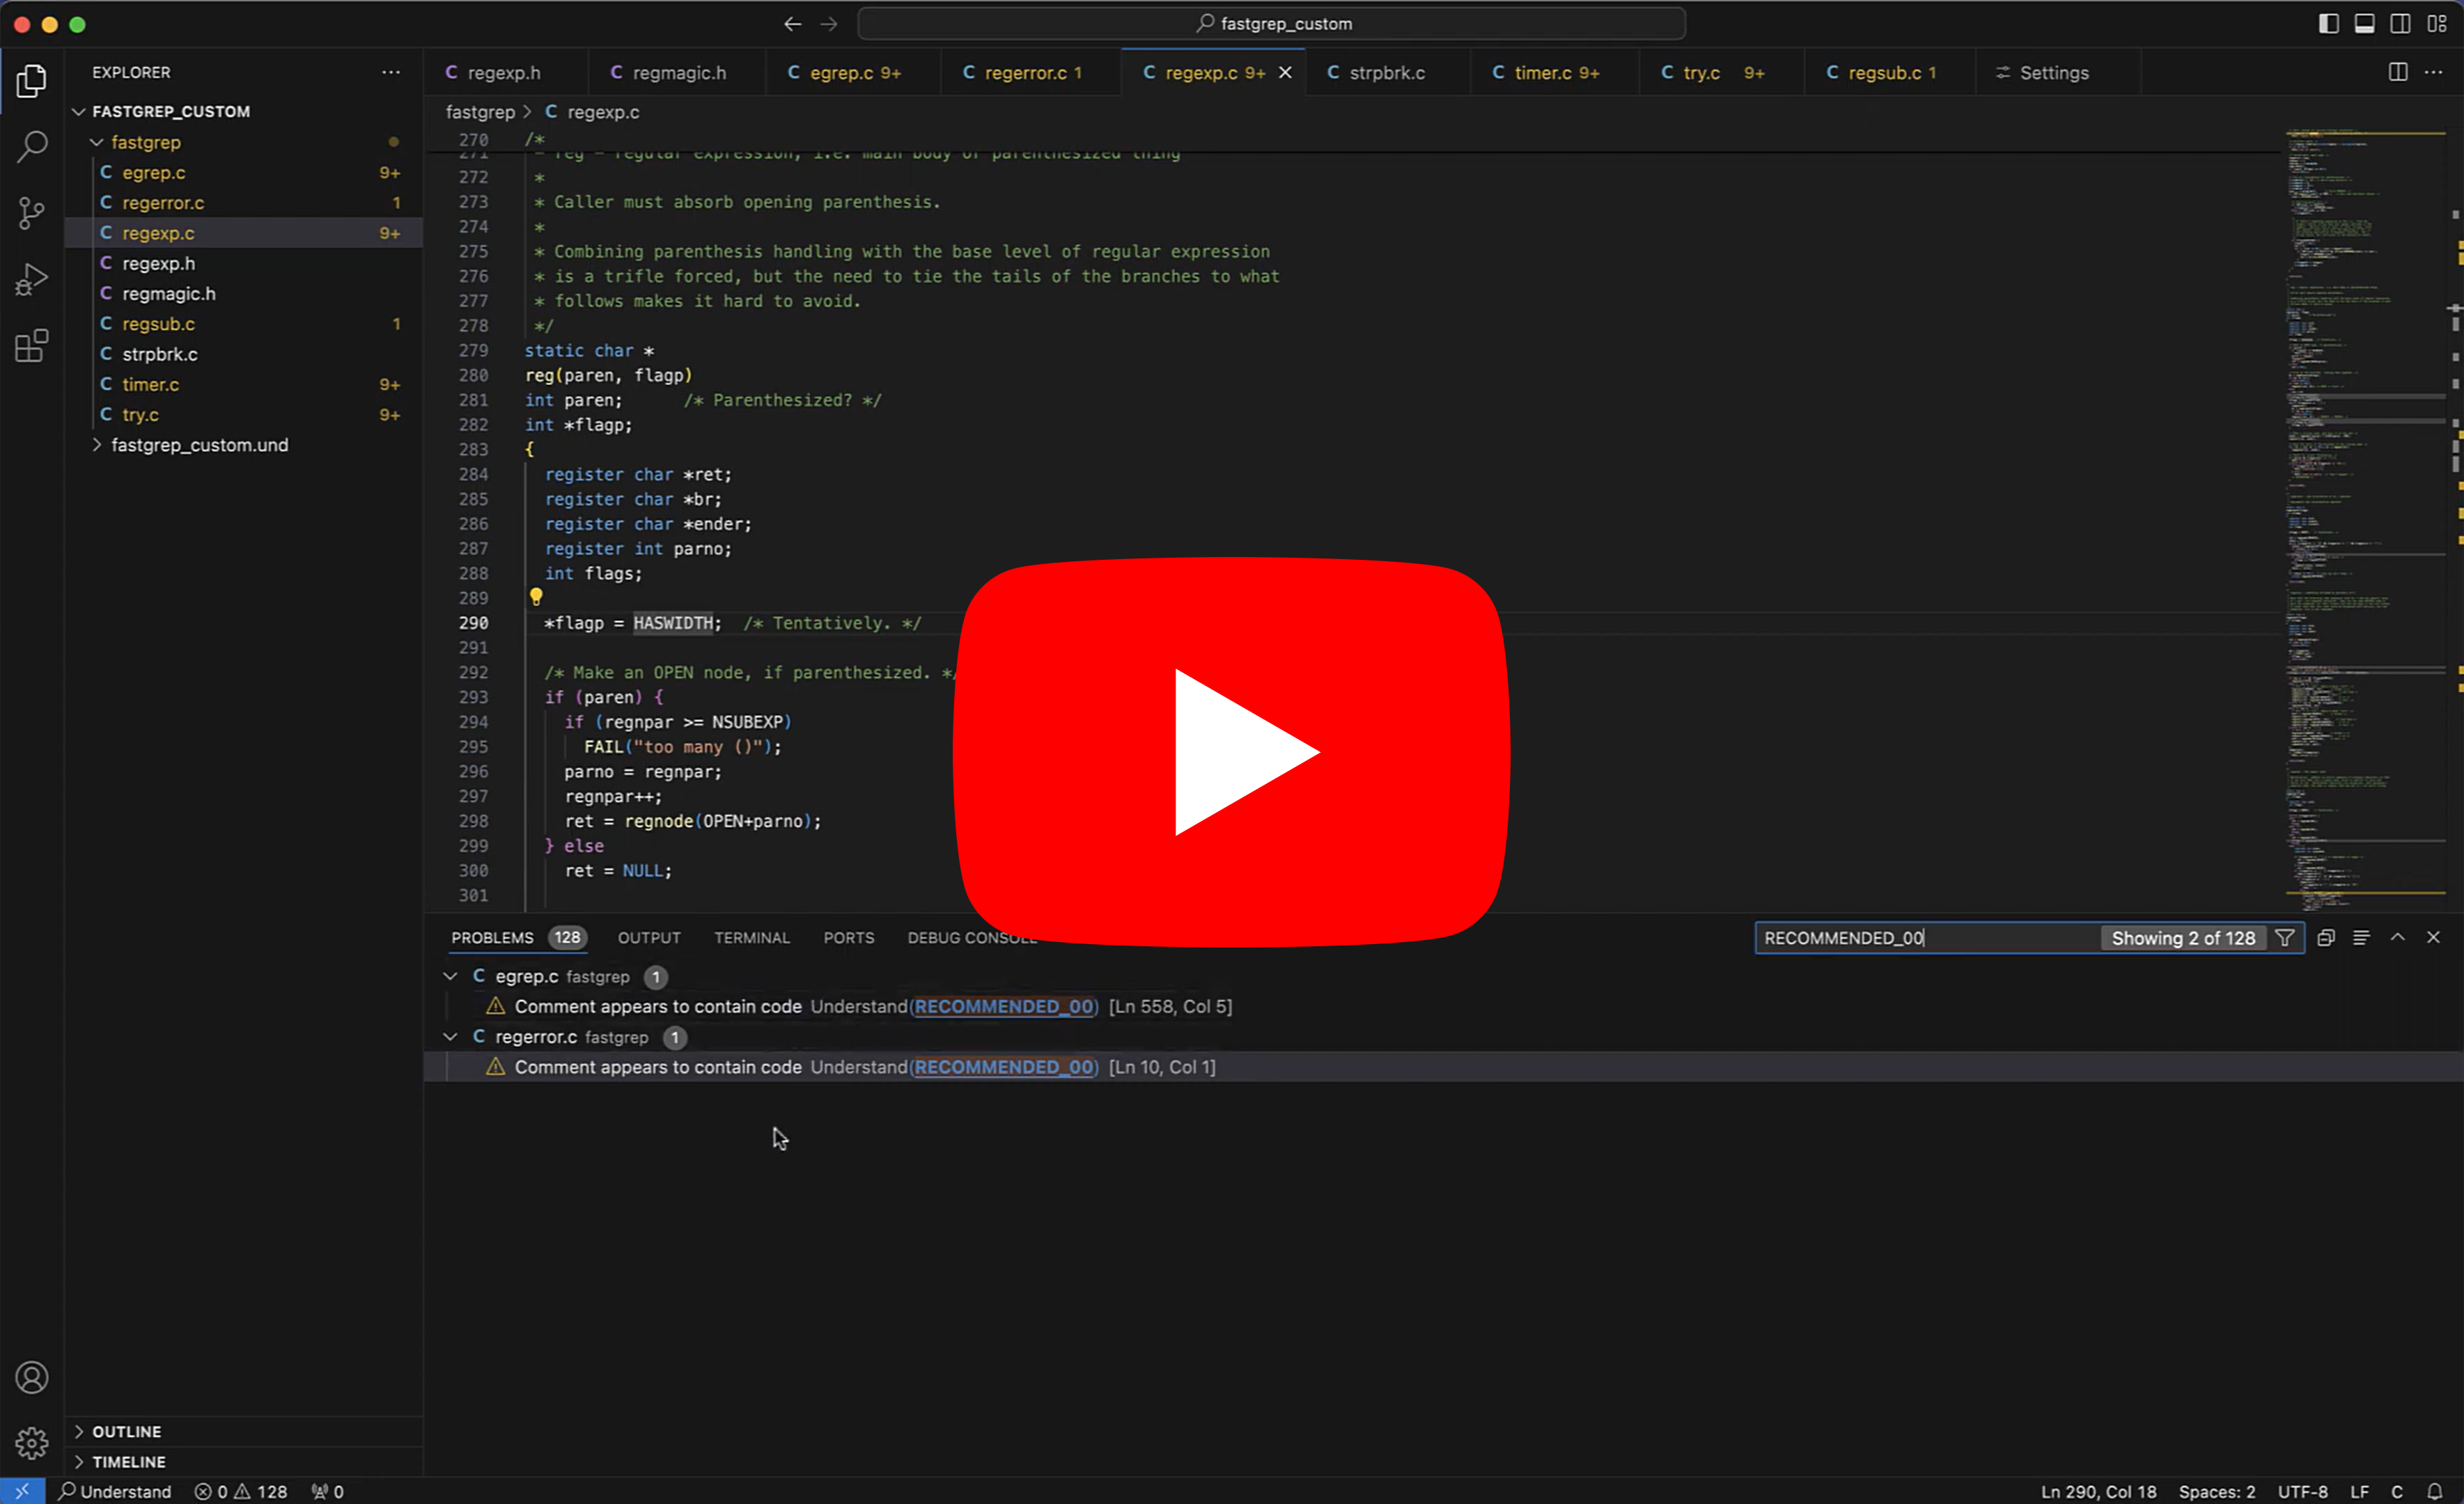
Video
See the extension in action in our video.
Licensing
To use this extension, you must have a valid Understand license. Try it for free with a trial license. Students and teachers can get a free educational license. Please see available options at scitools.com/pricing. Once you have a license, redeem it in Understand or Und and it's used for all our applications. Read here to get your license code from our licensing website and redeem them it Understand. For the command line, read here to redeem it in Und.
Compare to Other Extensions
|
Understand by SciTools |
C/C++ by Microsoft |
clangd by LLVM |
C/C++ Advanced Lint by Joseph Benden |
| Supports more than C/C++ |
✔️ |
❌ |
❌ |
❌ |
| Can analyze whole project |
✔️ |
✔️ |
❌ |
❌ |
| See all errors/warnings at launch |
✔️ |
❌ |
❌ |
❌ |
| Definitions and other references |
✔️ |
✔️ |
✔️ |
❌ |
| Hover for arguments, type, etc. |
✔️ |
✔️ |
✔️ |
❌ |
| AUTOSAR, MISRA, CERT, etc. |
✔️ |
❌ |
❌ |
✔️ |
| Companion GUI application |
✔️ |
❌ |
❌ |
❌ |
- Note: this comparison may not be perfect. It is just an observation of whether or not these features were found in each extension.
Privacy
See scitools.com/eula and also in Understand see Help > Privacy for our updated privacy policy.
Compatibility
- Windows 10 and newer
- MacOS 14 and newer
- Linux
Features
See or Go To References
- Kinds of references
- Definition
- Declaration
- Type Definition
- Implementations
- All References
- Where to see references
- Peek at references with a code popup
- Instantly go to a reference
- Find all references in the side bar with the ability to dismiss them
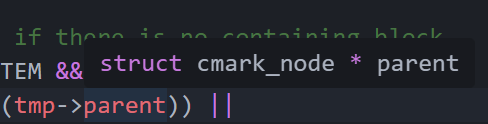
- Types of objects, functions, parameters, classes, type aliases, etc.
- Values of objects, macros, etc.
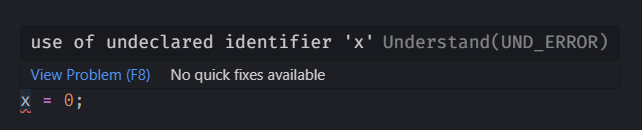
See Errors and Warnings
- Kinds of violations
- Errors and warnings from preprocessing and compiling
- Warnings from your selected CodeChecks
- Ignore CodeCheck violations or quick fix some with code actions
- Detailed descriptions of CodeCheck violations
- Violations available in the editor, file explorer side bar, and problems panel
Quickly Analyze Your Code
- Automatically analyze files on save... or
- Manually analyze files with a command
Explore in Understand
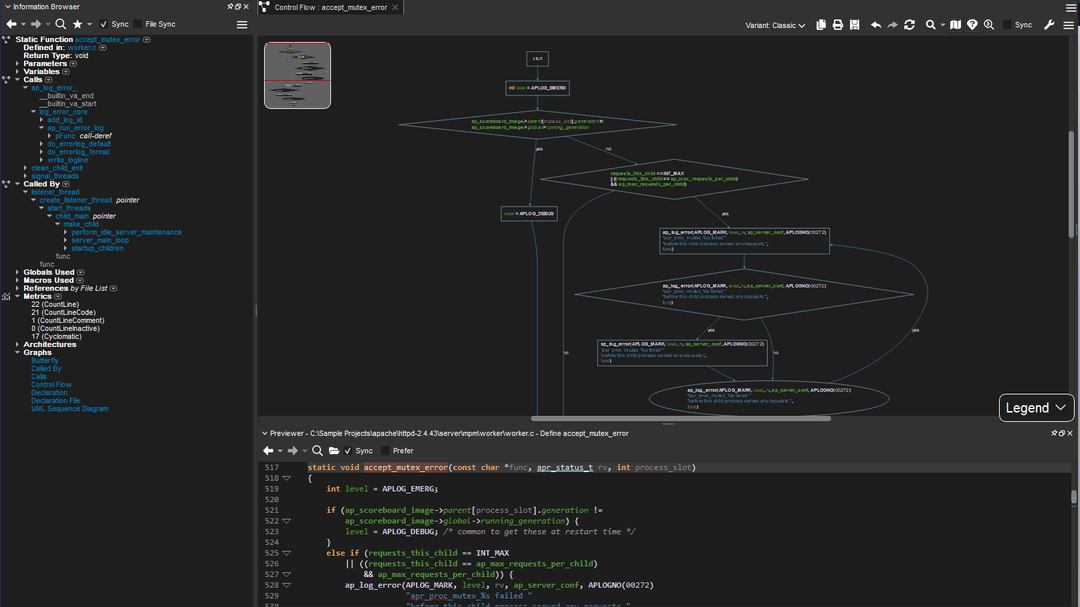
- If the current file is in the database, explore it in Understand for the full experience
- Discover how legacy code fits together
- Visualize with customizable graphs
- Comply with any standard including AUTOSAR/MISRA
- Detect and fix issues early
- Solve problems and automate solutions with full API access
- Gain insight with actionable metrics
- More at scitools.com and blog.scitools.com
Understand Different Languages
Setup
Setup: Installation
Install Understand, which comes with UServer, the Understand language server
Open Visual Studio Code and install this extension, if you haven't already
Setup: Project Creation
Using at least 1 source code file, create a project in Understand, resulting in a .und folder. With this extension, you can simply create a source code file and run the command "Understand: Explore in Understand: New Project" to quickly get started.
If you want to see violations from CodeCheck, make your CodeCheck configuration(s) run in the background
In Visual Studio Code, open a folder/workspace that contains the .und folder. Also, include all of the source code files that you want.
- What happens next, automatically
- If there's one .und folder somewhere in the file explorer, the extension starts.
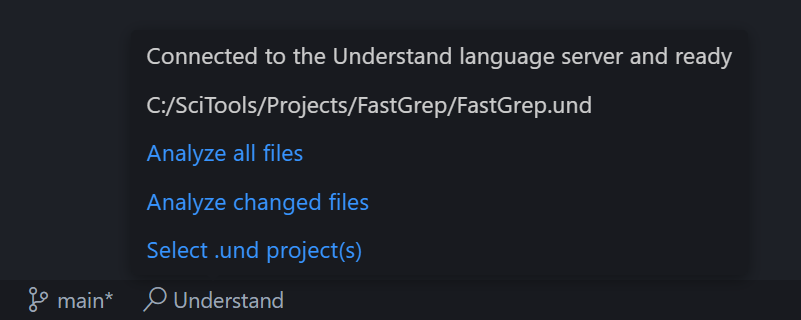
- On the bottom status bar on the left, hover on the Understand section and see that the extension has connected to
userver.
FAQ
Why is the language server executable not found?
Make the command userver accessible to Visual Studio Code
* Option 1: Change the setting understand.server.executable to your userver path like /your/path/to/userver
* Option 2: Add the path to userver to the PATH environment variable
* Windows: Add "C:\Program Files\SciTools\bin\pc-win64" to the system PATH. This is usually handled automatically by the Understand installer.
* Linux & Mac: In your ~/.profile file, add export PATH="/your/path/to:$PATH" where /your/path/to is the parent directory of userver
* Option 3: On Linux or Mac, add a symbolic link
* Linux: sudo ln -s /your/path/to/userver /usr/bin
* Mac: sudo mkdir -p /usr/local/bin && sudo ln -s /your/path/to/userver /usr/local/bin
Why isn't the language server starting?
Make sure that you have a .und folder in your file explorer, which is created automatically when creating an Understand project.
Why aren't my results accurate after creating or deleting a file?
If your project uses compile_commands.json, then you must build after creating or deleting files.
Now that I am connected to the Understand language server, how do I use it?
Command Palette:
- Open the command palette with the keybinding for
workbench.action.showCommands and type in Understand to see all of the commands available to you.
- Click the gear to view the command ID and start adding keyboard startcuts.
Status Bar:
- On the bottom status bar on the left, hover over Understand to see buttons for common commands.
Code Actions:
- In a resolved file, the lightbulb icon will appear with some code actions.
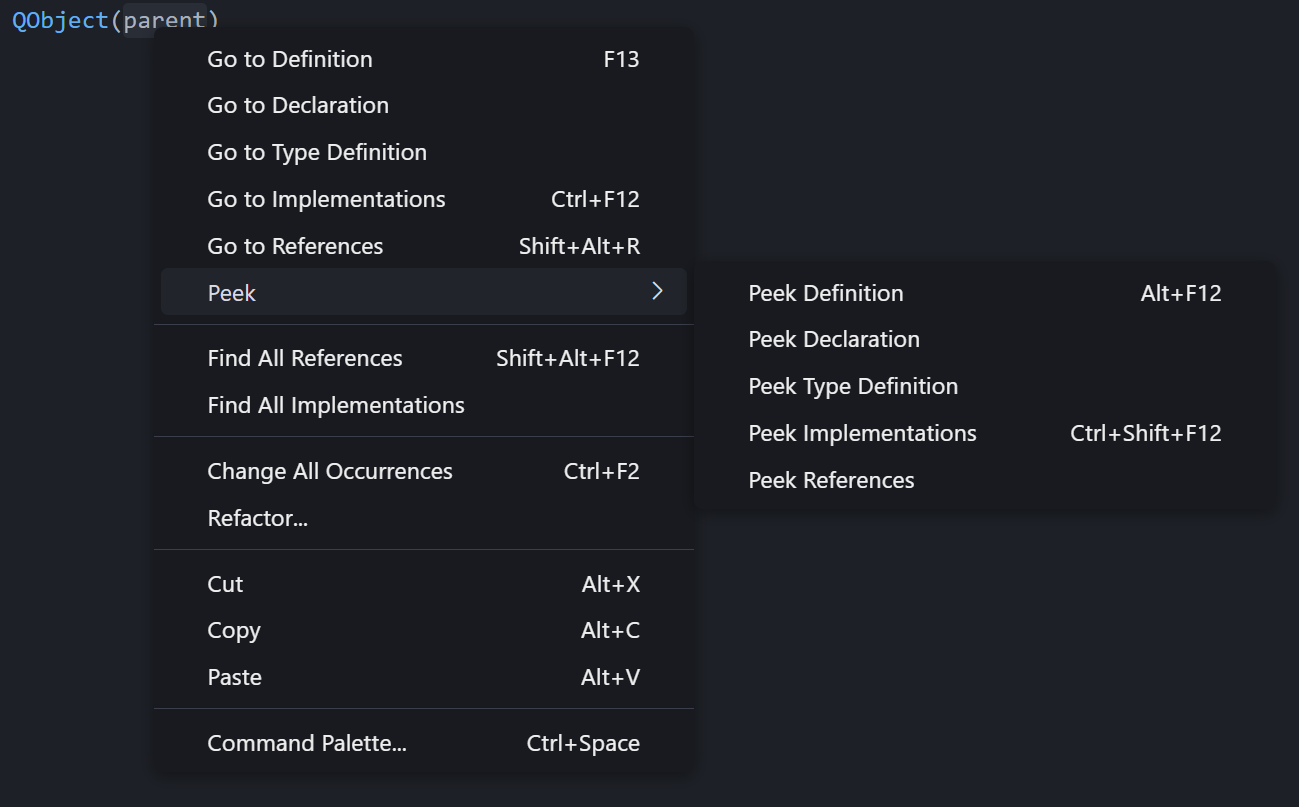
Editor Context Menu:
- In a resolved file, right click code to see the editor context menu and see references like go to definition.
Why don't I see some commands in certain files?
If a file isn't a resolved project file, then the file-specific commands won't show up in the command palette. The other commands - general and project-specific - should still be available.
Why don't I see certain kinds of references, like declarations, type definitions, or implementations?
- It might be because the token doesn't have an entity, like a number literal or a keyword.
- An entity may not have the reference kind that you are looking for. For example, in C, an
int object doesn't have a type definition because it's a primitive type, but a struct object does if the type is resolved.
- Some languages don't have certain reference kinds. For example, C doesn't have implementations, but Java does.
Why don't violations go away after manually fixing them?
- You should analyze after manually fixing an error or warning.
How do I see the name of a violation?
Do any of the following
- Hover over the squiggle (this also shows the detailed description)
- In settings, enable "Problems: Show Current in Status" and place the text cursor on the problem
- Run a command that starts with "Understand: Violations: Go to"
- Place the text cursor on the problem, and run the command "Show or Focus Hover"
// Example keybindings: Commands that start with "Understand: Violations: Go to"
{
	"key": "f8",
	"command": "understand.violations.goToNextViolationInCurrentFile",
	"when": "editorTextFocus",
},
{
	"key": "shift+f8",
	"command": "understand.violations.goToPreviousViolationInCurrentFile",
	"when": "editorTextFocus",
},
// Example keybinding: "Show or Focus Hover" command (this also shows the detailed description)
{
	"key": "shift+space",
	"command": "editor.action.showHover",
	"when": "editorTextFocus",
},
How do I skip certain violations with the "Go to Next/Previous Violation" commands?
How do I have more control over showing/focusing on the violations (Problems panel)?
In keybindings.json, try different keybindings like the following. Read more about the "when" property and running multiple commands.
// Example keybinding: Show violations and focus on violations, but close when it's focused
{
	"key": "alt+v",
	"command": "understand.violations.toggleVisibilityAndFocus",
},
// Example keybinding: When in the editor, show violations but keep focus on the editor
{
	"key": "alt+v",
	"command": "runCommands",
	"when": "editorFocus && activePanel != 'workbench.panel.markers'",
	"args": {
		"commands": [
			"understand.violations.toggleVisibilityAndFocus",
			"workbench.action.focusLastEditorGroup",
		],
	}
},
// Example keybinding: When in the editor, close violations from the editor
{
	"key": "alt+v",
	"command": "runCommands",
	"when": "editorFocus && activePanel == 'workbench.panel.markers'",
	"args": {
		"commands": [
			"understand.violations.toggleVisibilityAndFocus",
			"understand.violations.toggleVisibilityAndFocus",
			"workbench.action.focusLastEditorGroup",
		],
	}
},
// Example keybinding: When in the violations panel, focus on the editor
{
	"key": "alt+v",
	"when": "panelFocus && activePanel == 'workbench.panel.markers'",
	"command": "workbench.action.focusLastEditorGroup",
},
// Example keybinding: When in the violations panel, close it
{
	"key": "escape",
	"when": "panelFocus && activePanel == 'workbench.panel.markers'",
	"command": "understand.violations.toggleVisibilityAndFocus",
},
How do I change the colors of violations?
In settings.json, the colors can be changed. This is especially useful for color blind users
{
	// See all color customizations:
	// https://code.visualstudio.com/api/references/theme-color
	"workbench.colorCustomizations": {
		// Editor squiggles and problems panel
		"editorWarning.foreground": "#ffff77",
		"editorError.foreground": "#ff7777",
		// File name color
 		"list.warningForeground": "#ffff77",
		"list.errorForeground": "#ff7777"
	}
}
