Skip to content
| Marketplace
Sign in
Visual Studio Code>Debuggers>Daakia — REST API ClientNew to Visual Studio Code? Get it now.
Daakia — REST API Client

Daakia — REST API Client

salilvnair

|
62 installs
| (0) | Free
REST client and API client for VS Code — REST, GraphQL, gRPC, SOAP, WebSocket, SSE and MQTT — with a Kubernetes dashboard (k8s pods, logs, shell), a GitHub dashboard for issues, mock servers, and AI you can switch off. An alternative to Postman, Thunder Client, Insomnia, Bruno and Hoppscotch.
Installation
Launch VS Code Quick Open (Ctrl+P), paste the following command, and press enter.
Copied to clipboard
More Info

Daakia — API Development Platform for VS Code

Daakia

Daakia (डाकिया, "the messenger") — a multi-protocol API client that lives inside VS Code. REST, GraphQL, gRPC, SOAP, WebSocket/SSE/Socket.IO/MQTT and MCP, with a stateful mock server, a script debugger, a Kubernetes console, a GitHub issue board, and AI that you can switch off one feature at a time.

VS Code Marketplace License React TypeScript

Daakia demo — REST, GraphQL, gRPC, SOAP, WebSocket, MCP, Mock Server, Collections, Daakia AI, DevTools, Dk8s and DkGH

Ninety seconds of it. The whole seven-minute walkthrough is here as an mp4.


What this is

Most API clients are a separate application. You alt-tab to them, they keep their own copy of your collections, and they know nothing about the repository you have open. Daakia is a VS Code extension: the requests live beside the code, the credentials live in the OS keychain, and everything it stores is a file or a SQLite row you can point at.

It also does two things an API client normally does not. Dk8s is a Kubernetes console — pods, structured logs, a shell in the container, a file explorer, and a profiler that reads heap dumps, thread dumps and flight recordings. DkGH is an issue board for one repository, driven through the official gh CLI.

Nothing here calls home. AI is opt-in per feature, and the provider is yours — including a local Ollama, or Daakia's own mock server if you want the shape of the feature without the tokens.


Table of contents

  • Install
  • Ctrl+K — one box for everything
  • The surfaces
  • Protocols
    • REST · GraphQL · gRPC · SOAP · Realtime · MCP
  • Anatomy of a request
  • Authentication
  • Scripts and the debugger
  • Collections, environments, variables, history
  • Workspaces
  • Mock server
  • Dk8s — Kubernetes in the editor
  • Doctor — heap, threads, flight recordings
  • DkGH — one repository's issues
  • Daakia AI
  • Power features
  • Import and export
  • The CLI
  • Git Sync, Vault, Bin
  • DevTools
  • Settings
  • Commands and keybindings
  • Architecture
  • Development
  • License

Install

Requires VS Code 1.99+.

From the Marketplace, or from a .vsix:

code --install-extension daakia-3.0.0.vsix

Open it with Daakia: Open Panel from the command palette, or the Daakia icon in the activity bar. There is nothing to sign into.


Ctrl+K — one box for everything

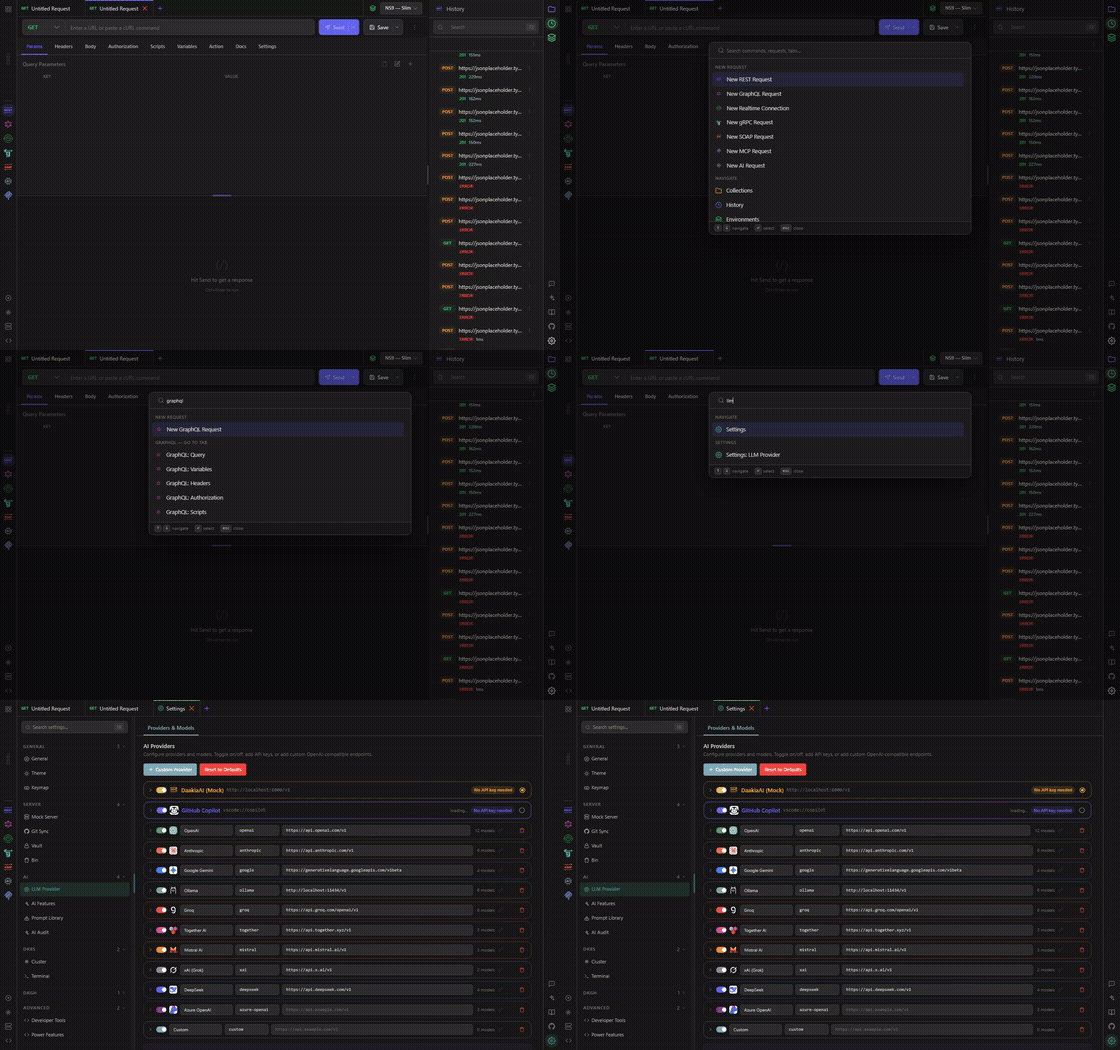
Ctrl+K — the command palette searching commands, requests, tabs and settings

The fastest way into any of what follows. Ctrl+K opens a single box that searches across:

  • New request in any of the seven protocols
  • Open tabs, by name — including the standalone ones
  • Saved requests, across every collection
  • Navigation — Collections, History, Environments, Mock Server, Daakia AI, Settings
  • Settings sections by what they contain, not just their name: "api key" finds LLM Provider, "port range" finds Mock Server, "cookie" finds Power Features
  • The eighty inline AI features, each of which also has its own trigger where it is used

↑ ↓ to move, ↵ to run, esc to close.


The surfaces

Daakia is a tabbed workspace. The rail down the left switches between them; each one opens as a tab, and tabs of different kinds live side by side.

Rail What it opens
REST HTTP requests
GraphQL queries, mutations, subscriptions, and a schema explorer
Real time WebSocket, SSE, Socket.IO and MQTT behind one selector
gRPC unary and streaming calls against a .proto or reflection
SOAP envelopes, WSDL, WS-Security
AI a request tab whose backend is a language model
MCP Model Context Protocol servers, tools, resources and prompts
Mock Server ten protocols' worth of local servers
Dk8s the Kubernetes console
DkGH the GitHub issue board
DevTools Daakia's own console, network log and timeline
Settings sixteen sections, searchable

A request tab carries a protocol and gets the right-hand panel — collections, history, environments, schema. A standalone tab — mock server, Dk8s, DkGH, Workspaces, the wiki, settings — owns the full width, because a collections tree next to a pod list is noise.


Protocols

REST

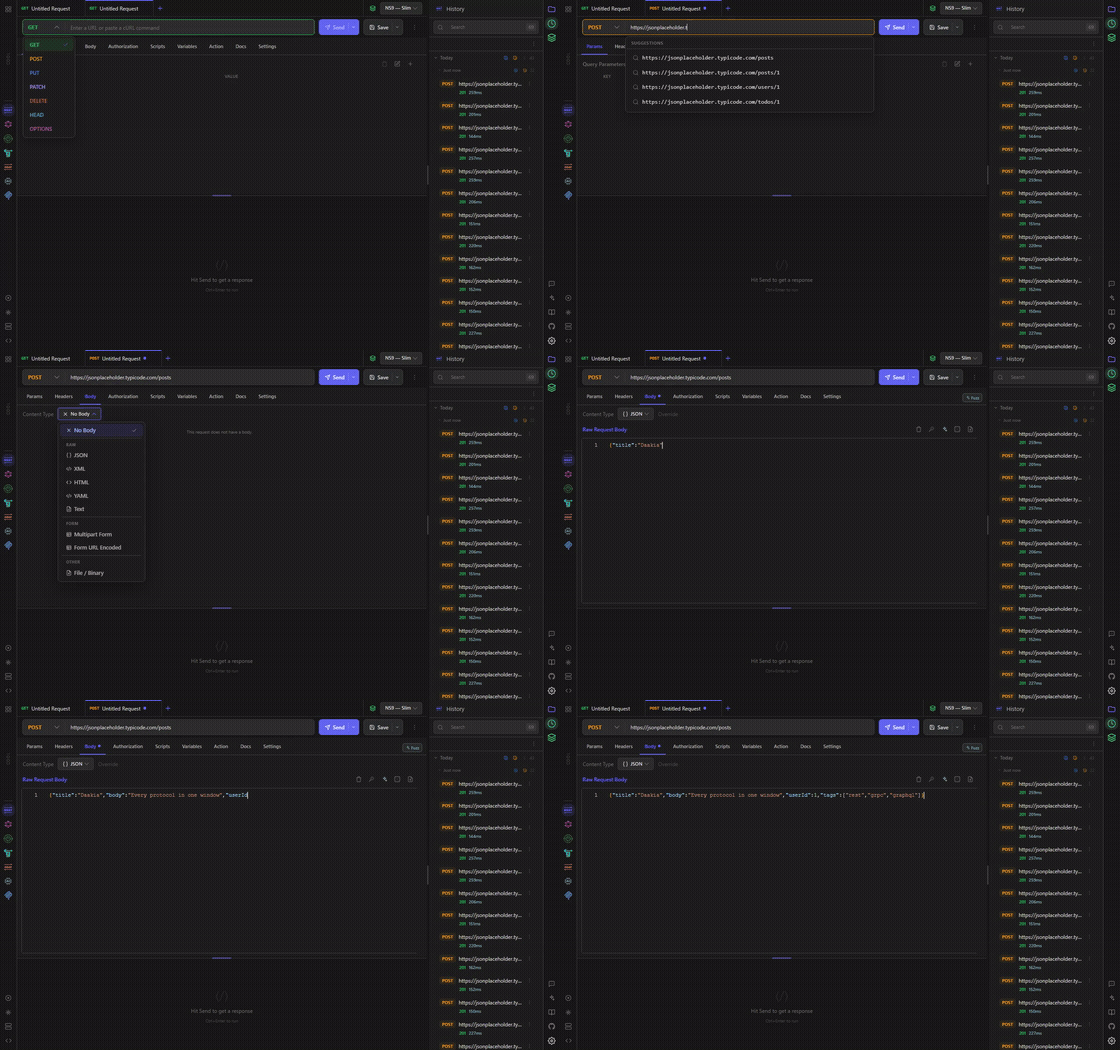
A REST request end to end — POST, a JSON body formatted two ways, 201 Created, and the response tabs

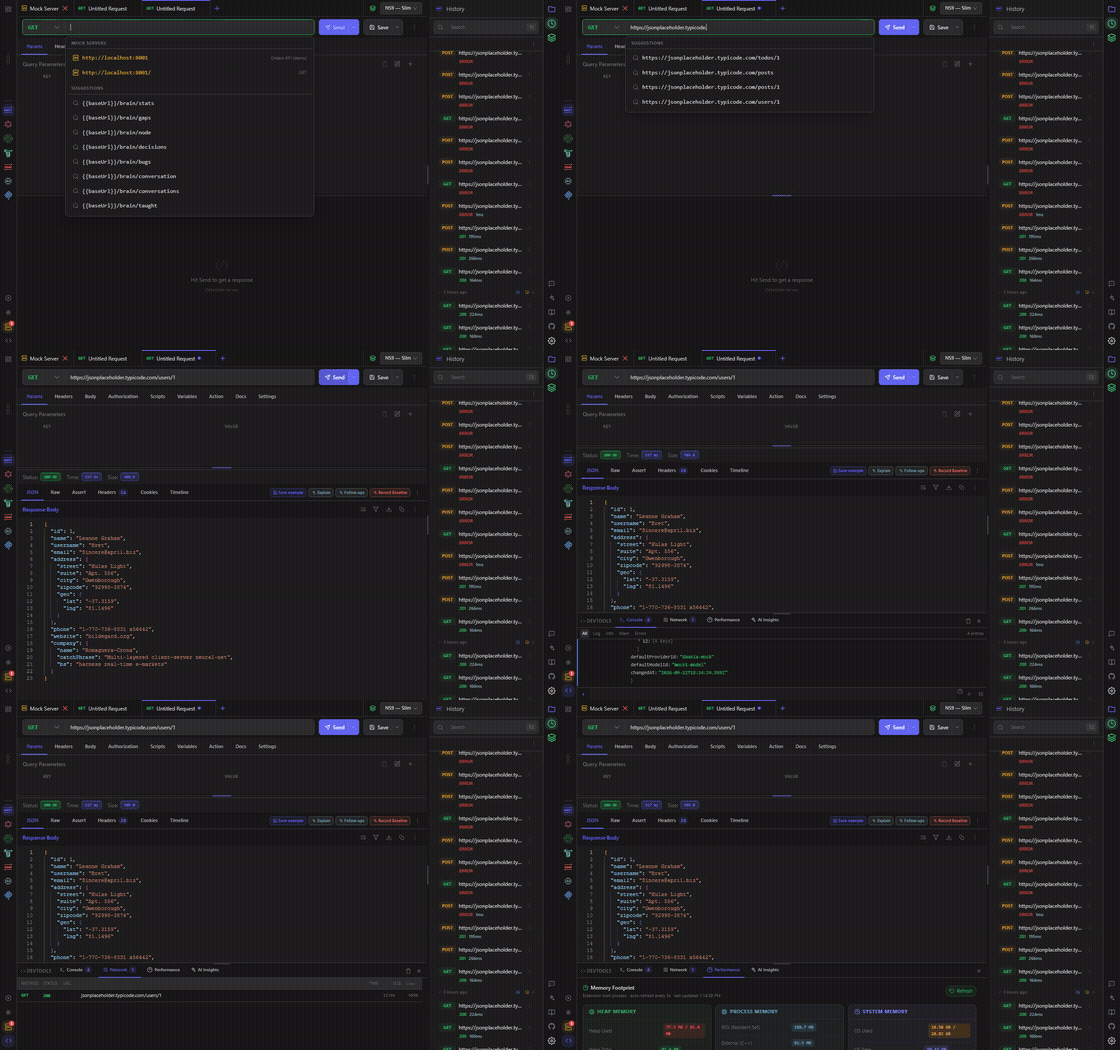
The URL bar takes a URL or a pasted cURL command and unpacks it. Method, params, headers, body, auth, scripts, variables, per-request settings and documentation each get a tab.

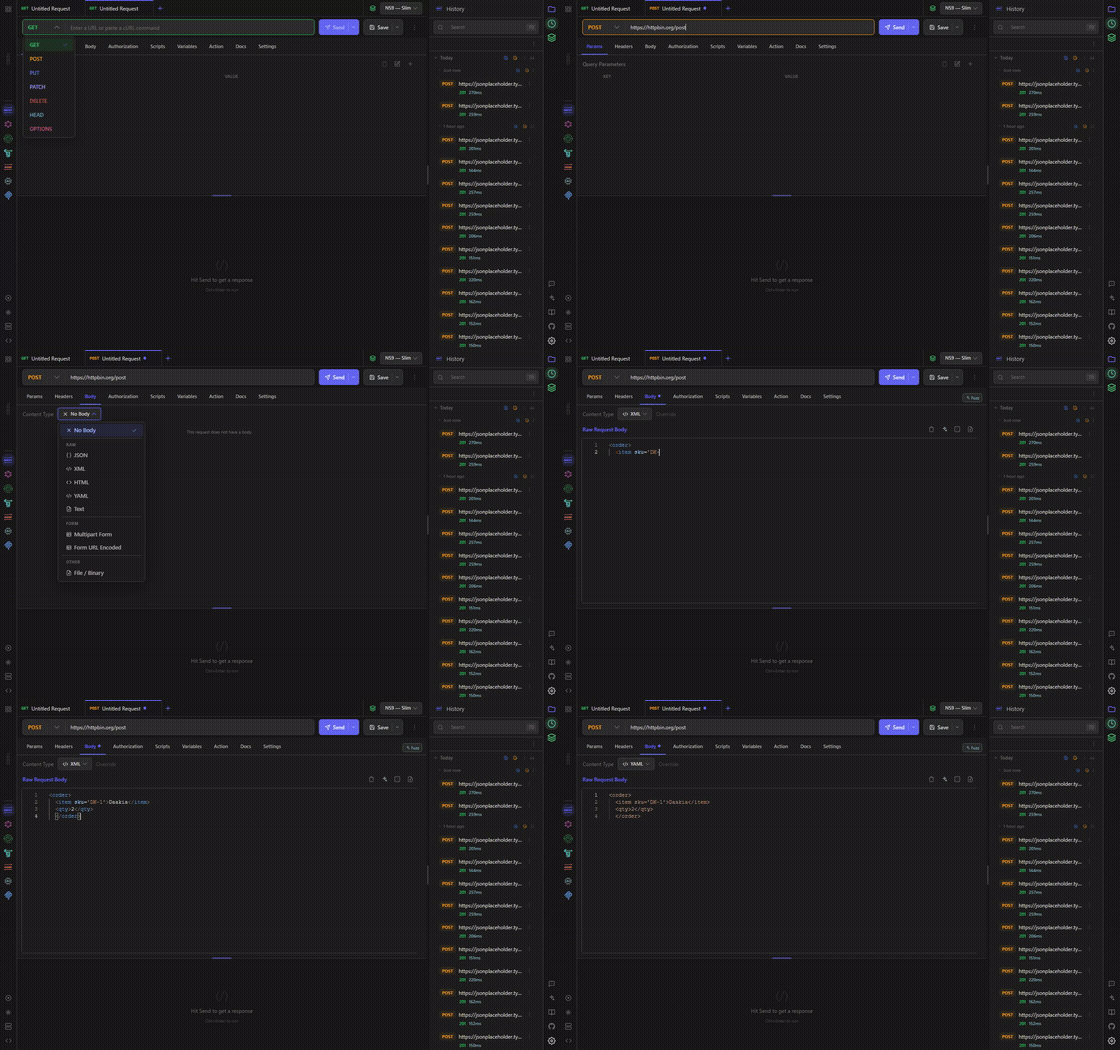
Bodies — No Body, JSON, XML, HTML, YAML, plain text, multipart form, URL-encoded form, or a binary file. JSON and XML get Monaco with the right language, a Prettify button and Format Document in the editor's own right-click menu.

Responses — JSON tree, raw, headers with counts, cookies, a timeline of the request's phases, and script test results. Visualize renders an array of objects as a table, or an image or PDF inline. Assert builds assertions by clicking through the JSON rather than writing paths by hand. Anything you send can be saved as a named example and re-used as documentation or as a mock.

Send honours per-request execution settings: timeout, redirect following and a redirect cap, whether Authorization survives a cross-origin redirect, SSL verification, encoding, and a proxy — each inheriting from the collection and then the global default unless you pin it here.

The proxy holds inside VS Code. VS Code patches Node's networking for extensions and, under its default http.proxySupport: override, replaces the connection a request brings with its own — which, with no http.proxy of its own, goes direct, and an office firewall answers "proxy required" while curl -x works. Daakia opens the CONNECT tunnel itself, underneath that patch, for REST, GraphQL, SOAP and SSE, and applies the request's SSL setting to the TLS session inside the tunnel, so a firewall that re-signs HTTPS works with verification off. A 407 says whether the proxy wants credentials or refused them.

GraphQL

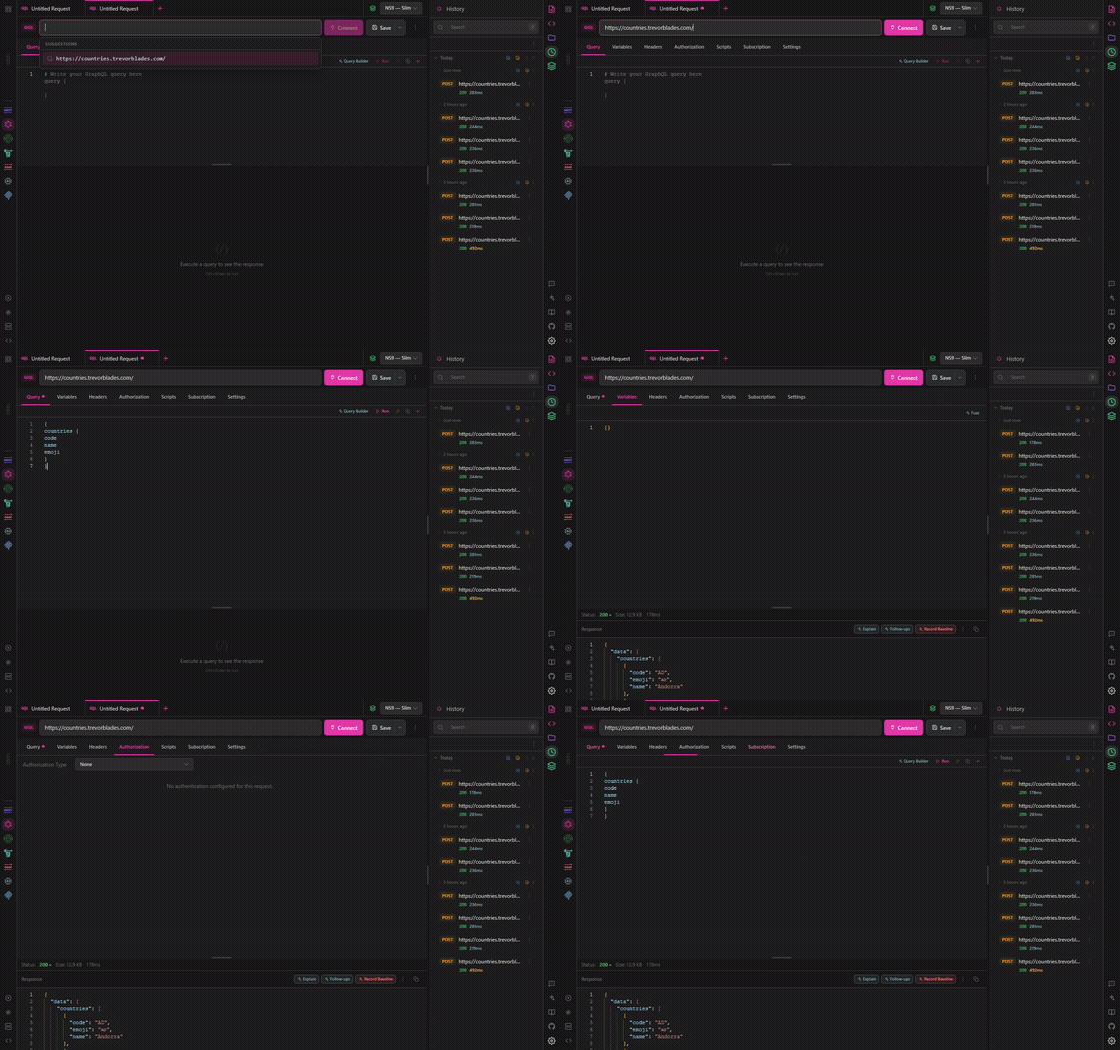
A GraphQL query against a live schema, with the Schema panel open

Query, mutation and subscription, with variables and headers as their own tabs. The Schema panel is a GraphiQL-style checkbox tree: tick fields to build the query, edit arguments inline, promote a literal to a $variable, and read the SDL pretty-printed. Subscriptions run over WebSocket.

gRPC

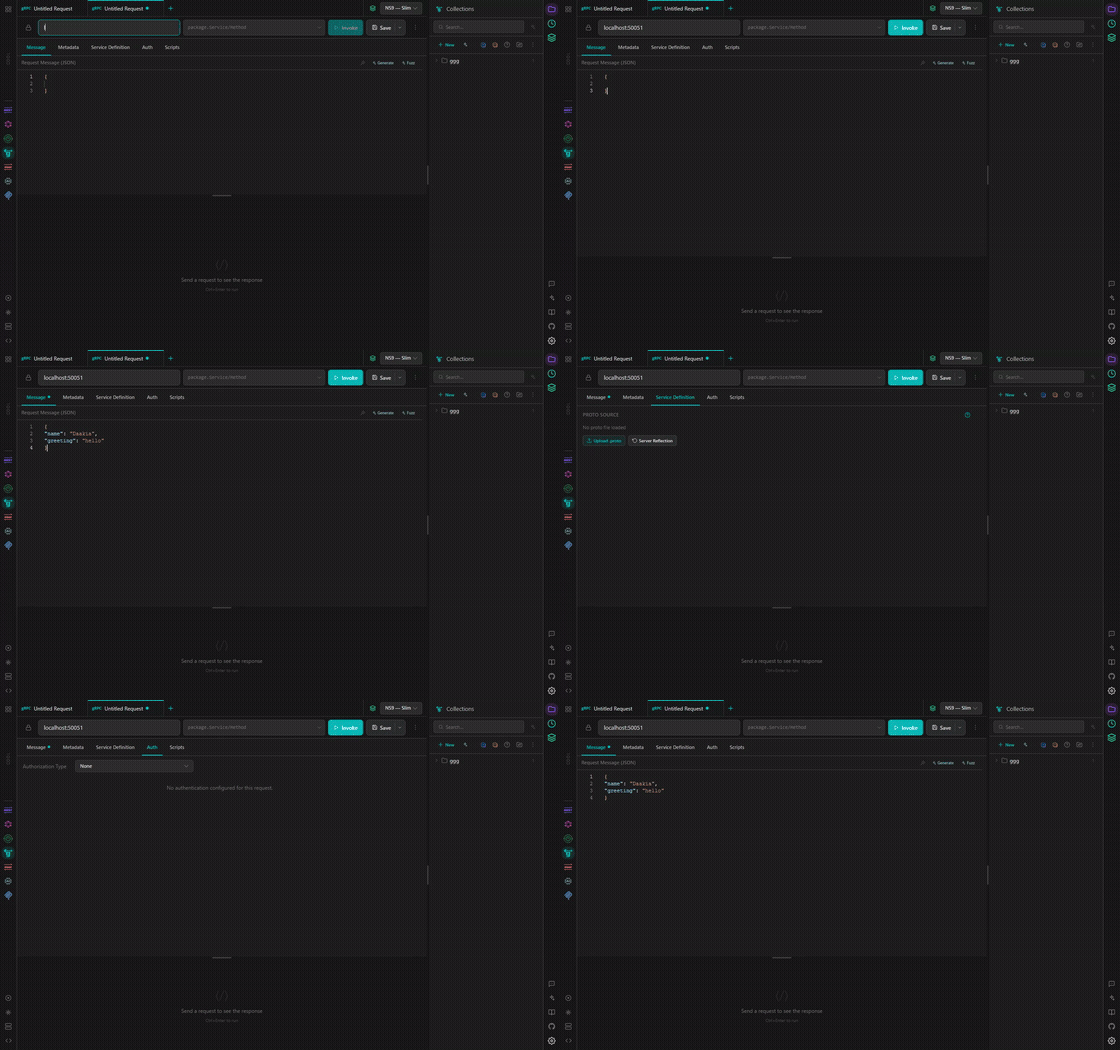
A gRPC call — endpoint, message, and the service definition

Point it at a host, load a .proto or use server reflection, and the Service Definition tab lists the methods it found. Unary, server-streaming, client-streaming and bidirectional. Metadata and auth are separate tabs; the request message is JSON with the message shape available beside it.

SOAP

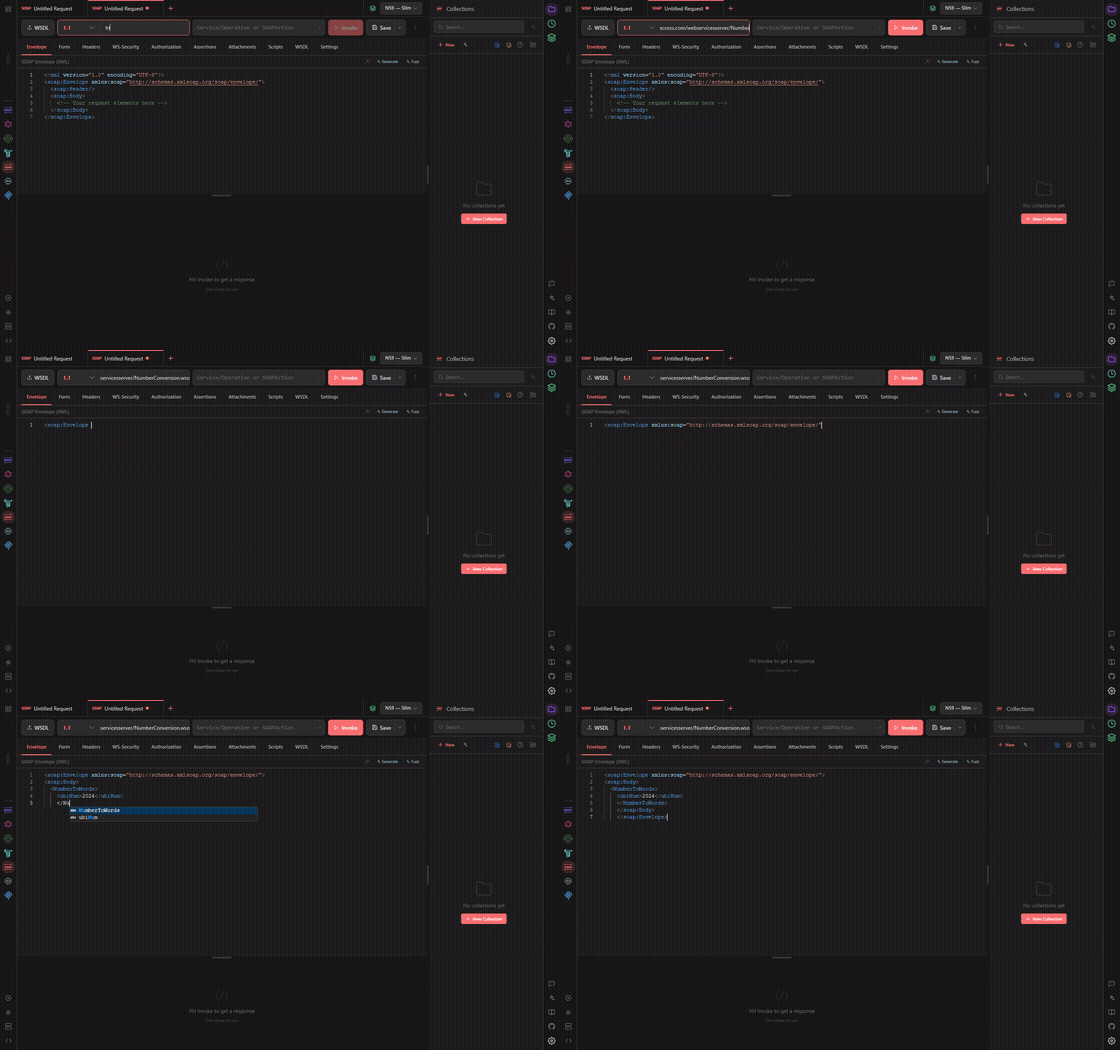
A SOAP envelope, with Form, WS-Security and WSDL beside it

An envelope editor with XML formatting, a Form view that fills the envelope from fields, WS-Security (username token, timestamps, digests), a WSDL tab that reads the contract and lists operations, plus assertions and attachments.

Realtime: WebSocket / SSE / Socket.IO / MQTT

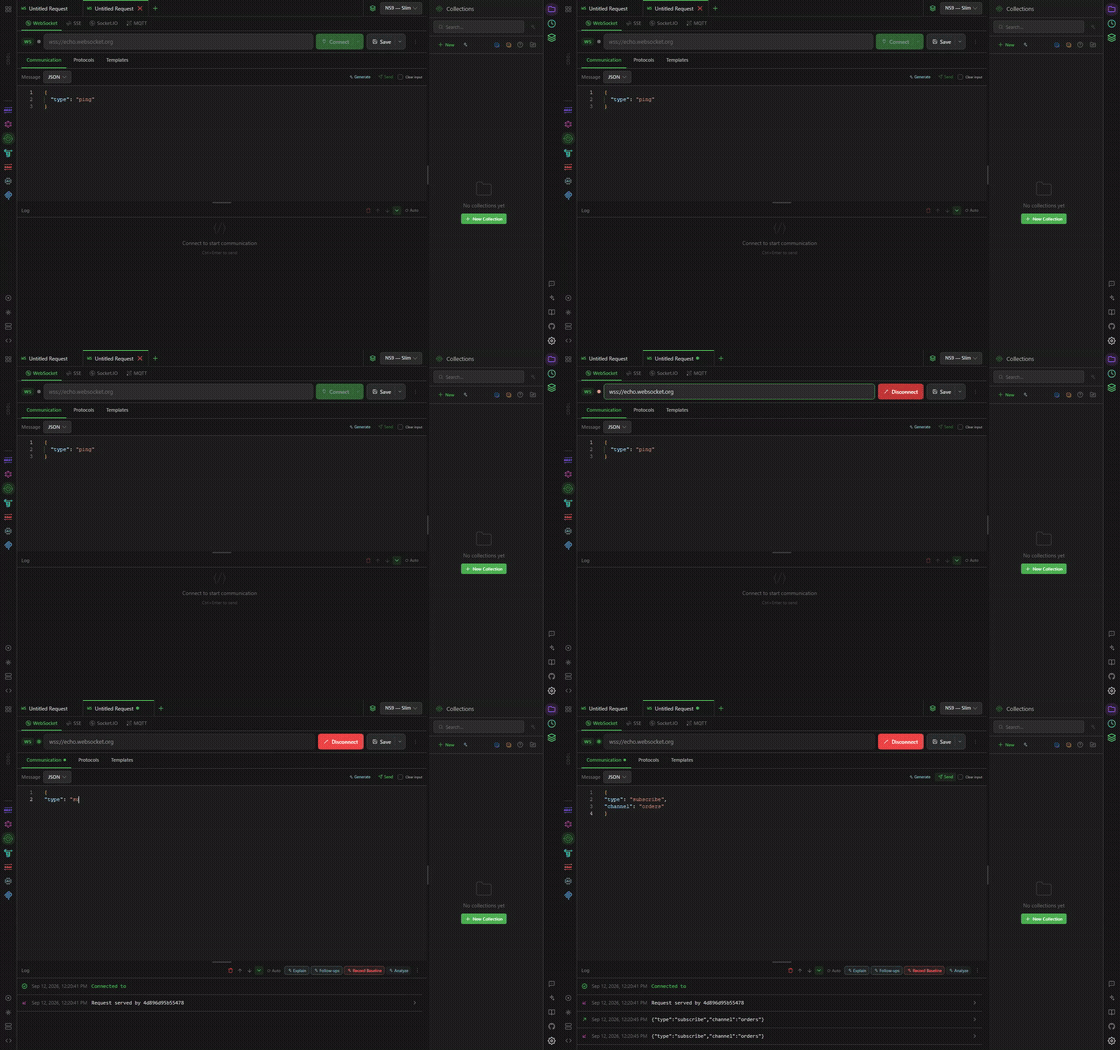
A WebSocket connected, a frame sent and echoed back

One rail, four protocols, chosen by a selector in the tab. Connect, then send frames as JSON or text with a message log showing direction, timestamp and payload. Templates keep the frames you send often. Socket.IO gets named events and acks; MQTT gets topics, QoS and retained messages; SSE gets the event stream parsed into named events.

MCP

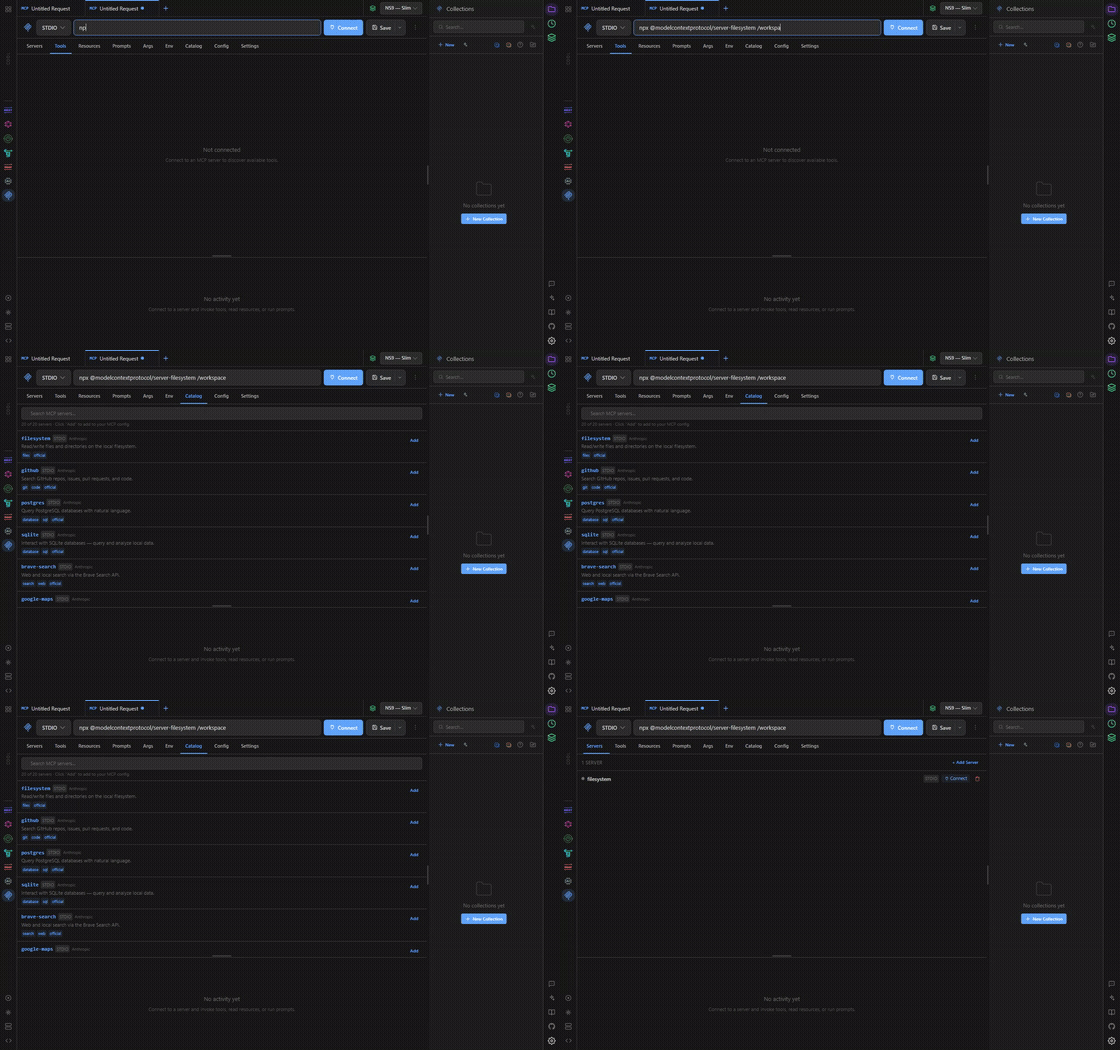
The MCP catalog, and a server added to the config

Connect to a Model Context Protocol server over STDIO or HTTP, and get its Tools, Resources and Prompts as tabs you can invoke. The Catalog lists twenty known servers — filesystem, github, postgres, sqlite, brave-search and the rest — and adds one to your config with a click. Args, Env and Config cover how the server is launched.


Anatomy of a request

The Content Type menu — XML, YAML, and the two form tables

Every protocol's request panel is built from the same strip:

Tab What it holds
Params query parameters, toggled individually
Headers request headers, plus a view of what Daakia computes for you
Body the nine body types above
Authorization see below
Scripts pre-request and post-response JavaScript
Variables request-scoped variables
Action what this request does around a send — response chaining, writing a value into the environment
Docs Markdown describing the request, exported with the collection
Settings the per-request execution overrides

Authentication

None, Bearer, Basic, API key (header or query), and OAuth 2.0 with the token exchange handled for you. Client certificates are configured per-host. Secrets can live in the Vault rather than in the collection file, and cookies are managed in one place with a jar per domain.


Scripts and the debugger

Pre-request and post-response scripts are JavaScript with a dk.* API:

// pre-request
dk.env.set('requestId', crypto.randomUUID());
const auth = await dk.sendRequest({ method: 'POST', url: '{{authUrl}}/token' });
dk.env.set('token', auth.json().access_token);

// post-response
dk.test('created', () => dk.expect(dk.response.status).toBe(201));
dk.test('has an id', () => dk.expect(dk.response.json().id).toBeDefined());
dk.collectionVariables.set('lastId', dk.response.json().id);

dk.request, dk.response, dk.env / dk.environment, dk.globals, dk.collectionVariables, dk.interpolate, dk.test, dk.expect, dk.sendRequest, dk.runner, and a console that writes to DevTools.

Postman scripts are translated on import, including the parts that are easy to get wrong: pm.expect(...).to.not.equal(500) keeps its negation, pm.response.to.have.status() resolves, and callback-style pm.sendRequest becomes an awaited call. The translator has 37 tests, several of which execute the converted script rather than pattern-matching it.

The debugger sets breakpoints in the gutter, with conditional breakpoints, step over/into/out, a variables pane, and hover-to-inspect while paused.

One pipeline for every protocol. REST, GraphQL, SOAP and gRPC run their scripts the same way — breakpoints included — and a variable a pre-request script sets reaches the same send: dk.env.set('token', …) followed by {{token}} in the Auth tab works on the first run, not the second.


Collections, environments, variables, history

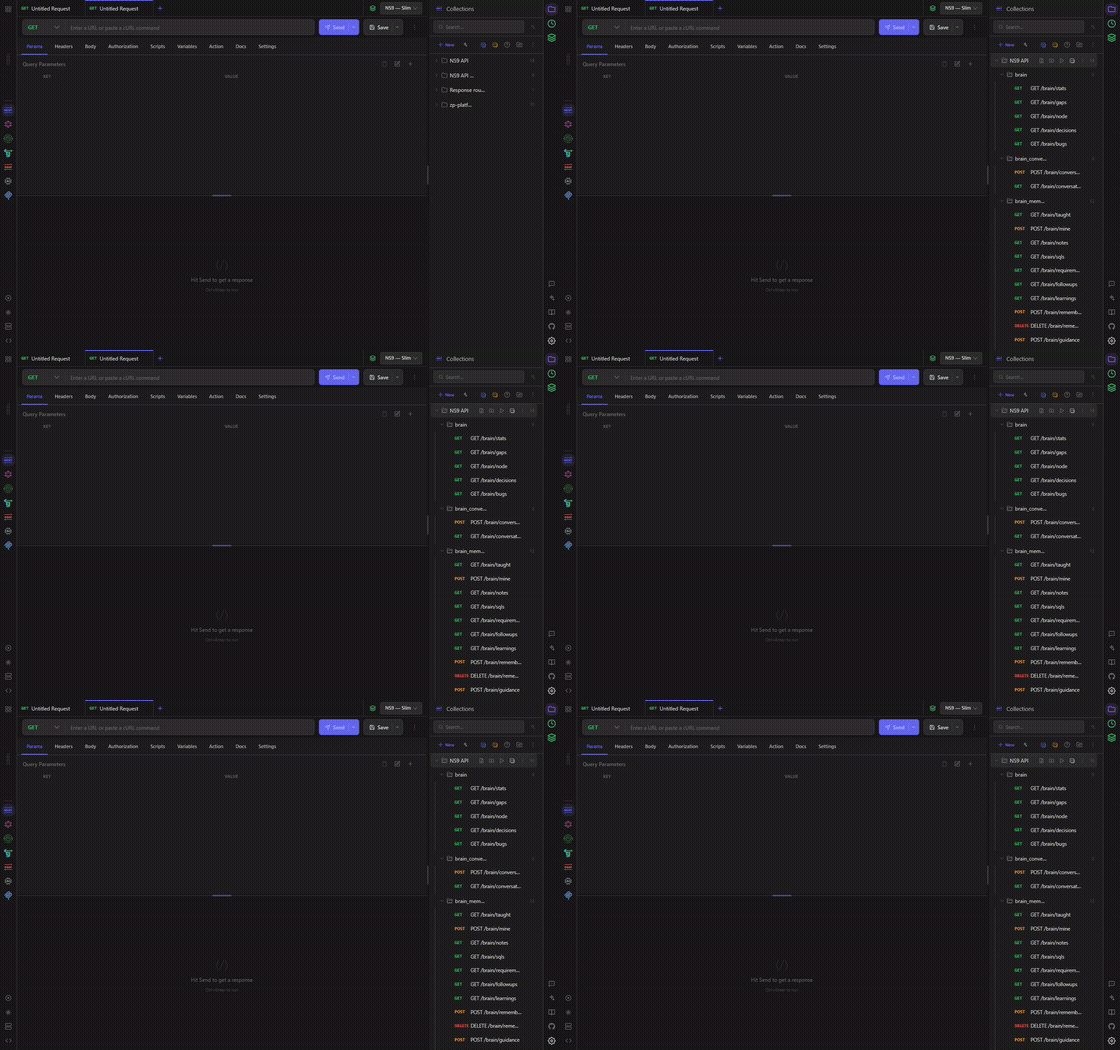
The collections tree, a saved request opened, and a search across it

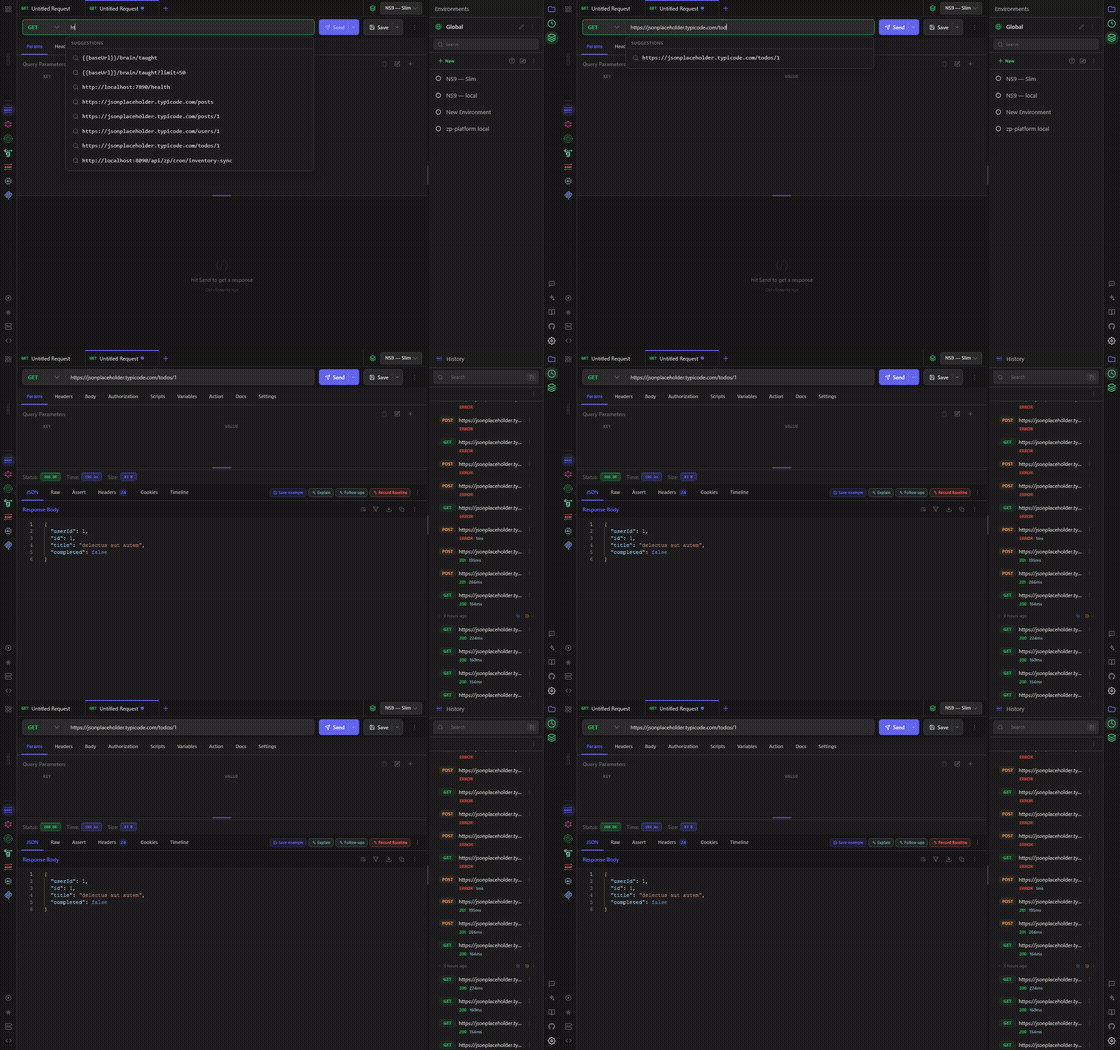
History — every request the app has run, and one reopened

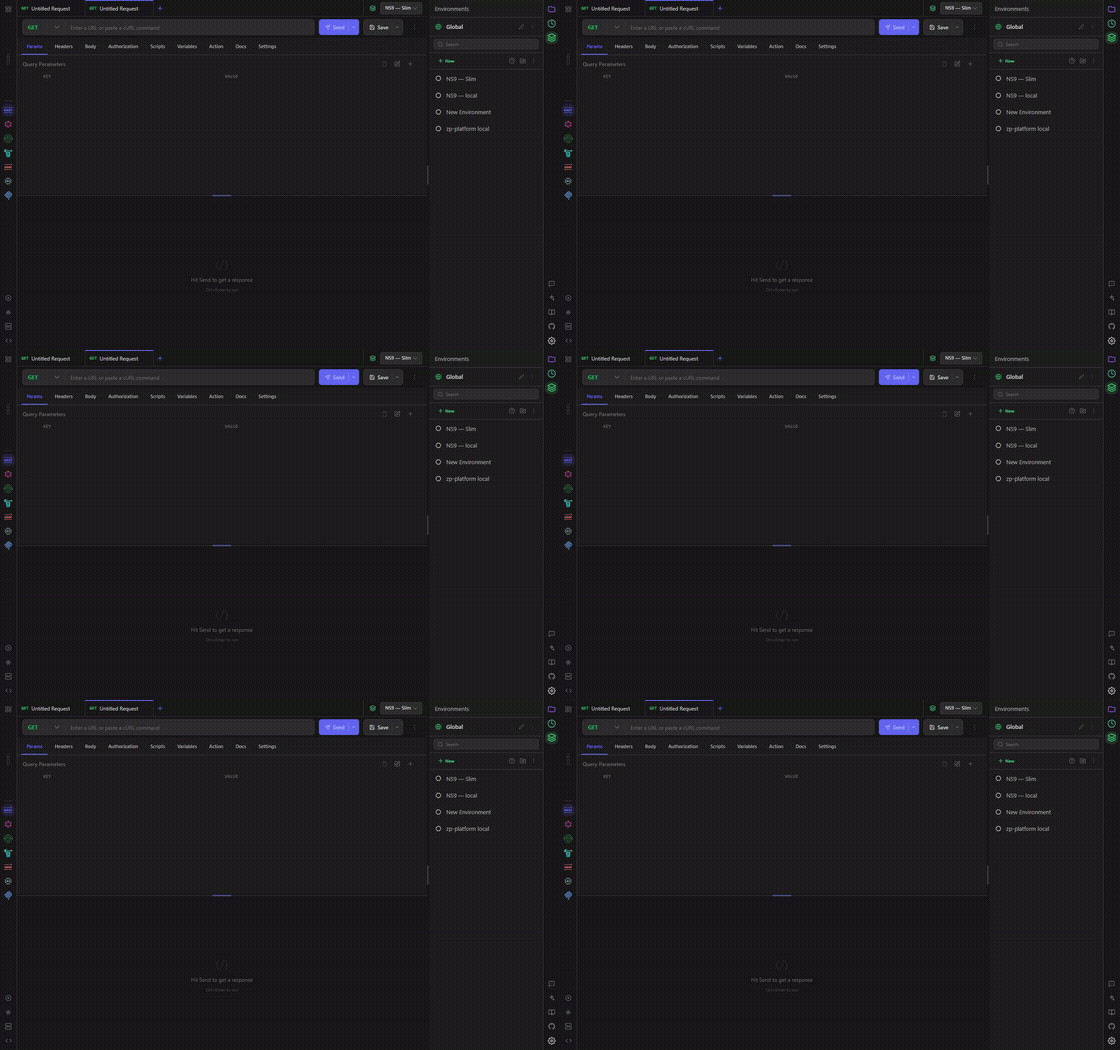
Environments — the variables a request resolves against, and the switcher

Collections are a tree of folders and requests with their own variables, auth and scripts inherited downward. Search across every collection at once with Ctrl+Shift+F.

The collection runner runs a folder or a whole collection, iterating over a data file (JSON or CSV) so one request becomes N, with per-iteration variables, a delay, and a pass/fail report per assertion.

Environments hold variables resolved as {{name}} at send time, with a switcher in the header. Values can be marked secret and stored in the Vault. Precedence runs request → collection → environment → global.

{{ suggests everything, in every field. Typing {{ offers your collection and environment variables first (a secret shows the word secret, never its value), then the {{$dynamic}} values — {{$randomUUID}}, {{$isoTimestamp}} and the rest — then the template helpers with their signatures, such as {{jsonPath request.body '$.orderId'}}, evaluated against the request you are sending. Every value field draws them as coloured tokens — URL bars, headers, params, auth fields and Monaco bodies alike — a template in a JSON body is not flagged as a JSON error, and Prettify formats around it. The wiki has a page listing all of them, and the Scripts snippets carry them too.

History is every request the app has run, SQLite-backed, grouped by time, and re-openable into a tab. It keeps 2,000 entries by default.

  • Filter by anything in the request. A panel laid out like the request editor — Request, Headers, Body, Auth, Scripts — with facets that count live (method, status, protocol, auth type, whether it is in a collection, when) and conditions for the rest: header authorization contains Bearer, json $.orderId equals A-17. Conditions group into ALL OF / ANY OF boxes nested as deep as you need — 1 and (2 or 3) — and every gap between two rows is one AND/OR switch. Response bodies are always searched. The filter round-trips as a query string you can paste.
  • Save what you keep sending. A request sent five times that is in no collection gets a card offering to save it, with a name read off the path.
  • Secret sweep. A value you hold as a secret, found where secrets do not belong — a query string, a response body, an ordinary header. A string comparison, no model, and the card names the variable, never the value.
  • First failing run. For an endpoint still failing, the last good run and the first bad one, diffed.
  • Deleting says what it deletes — the request or protocol, the workspace, and that it goes to the Bin — and the tab counts follow the data rather than the last workspace switch.

Workspaces

A workspace owns its collections, environments and history across every protocol, so two projects stop sharing one drawer. Open, import and export them; the rail says which one you are in; what you collapsed stays collapsed between sessions. Switching reloads every protocol's collections and history, not only REST's.

Share one with your team through Git Sync: ⚙ → Share with team publishes its collections and environments, secrets redacted and history never. In a teammate's switcher it appears under your name:

  • Open it read-only. Click it under your name and it opens as a copy that follows your changes on every sync. Its collections and overview cannot be changed — the controls are there but disabled, and the host refuses the edit anyway — while sending its requests works and fills their own history, and environments stay editable so they can fill in the secrets that arrive blank. Stop sharing and it leaves their switcher on their next sync.
  • Import shared instead makes an editable workspace of their own: a dialog shows its collections and environments, all ticked, and a name defaulting to Orders (by Priya).

Settings → Git Sync has a switch to hide teammates' workspaces from the menu.


Mock server

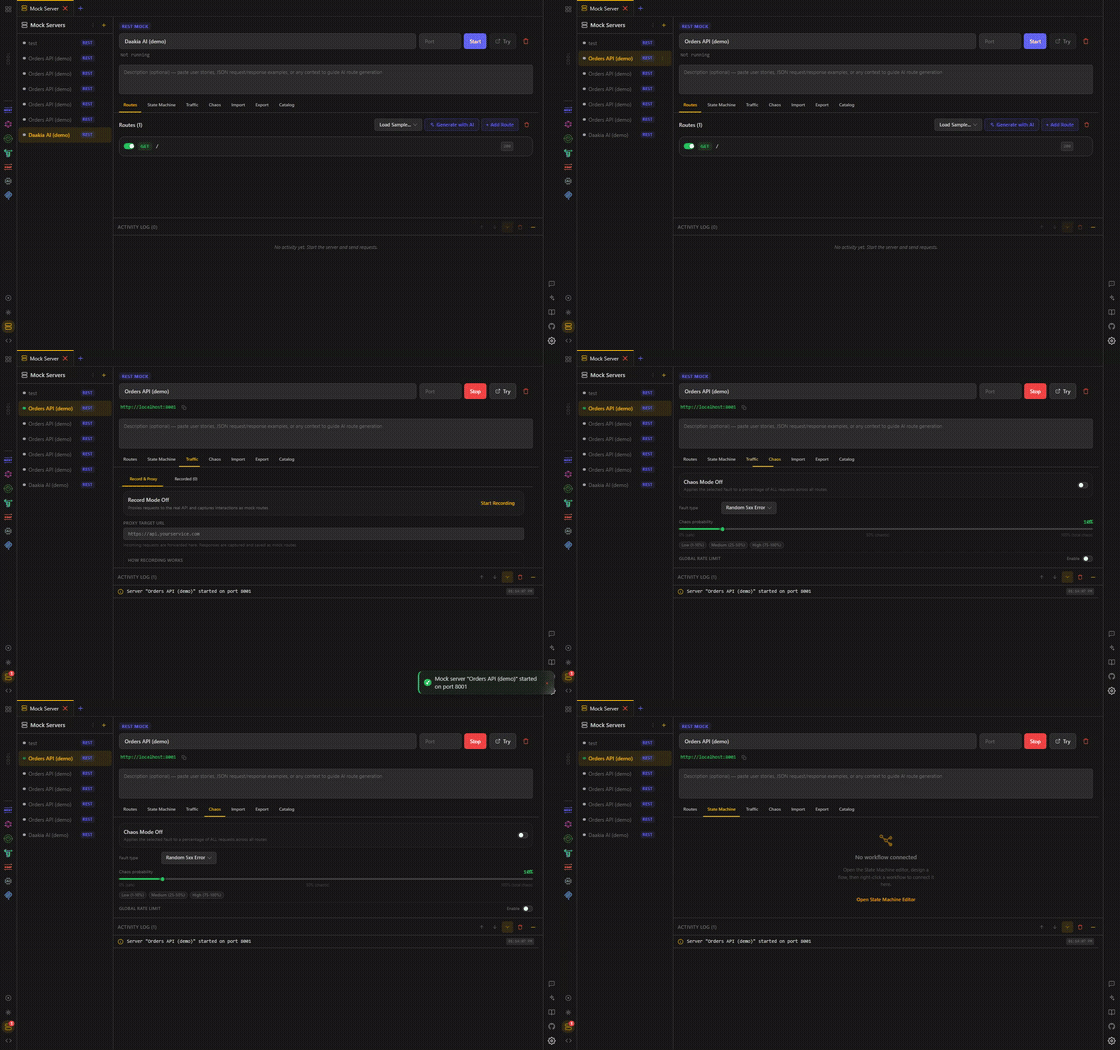
A mock server started, with Routes, Traffic, Chaos and the State Machine

Local servers for ten protocols: REST, GraphQL, WebSocket, SSE, Socket.IO, MQTT, gRPC, SOAP, AI and MCP. Each gets a port (or picks a free one) and a panel:

  • Routes — method, path with path-to-regexp params, status, headers, body, and a delay. Load a sample, add routes by hand, or Generate with AI from a description.
  • State Machine — a mock that remembers. Backed by @salilvnair/state-machine: a POST /orders moves the server to created, and the next GET /orders/1 answers differently because of it. Edited as a graph.
  • Traffic — every request the mock served, with what matched it.
  • Chaos — latency, error injection and dropped connections, so the client can be tested against a server having a bad day.
  • Import / Export — bring in an OpenAPI spec or a WireMock stub set; export the config to share.
  • Catalog — ready-made mocks to start from.

The AI mock is worth calling out: it serves an OpenAI-compatible /v1/chat/completions with fifteen API-development scenarios, so you can point any OpenAI-compatible provider — including Daakia's own — at http://localhost:PORT/v1 and develop against a language model that costs nothing and answers the same way twice.


Dk8s — Kubernetes in the editor

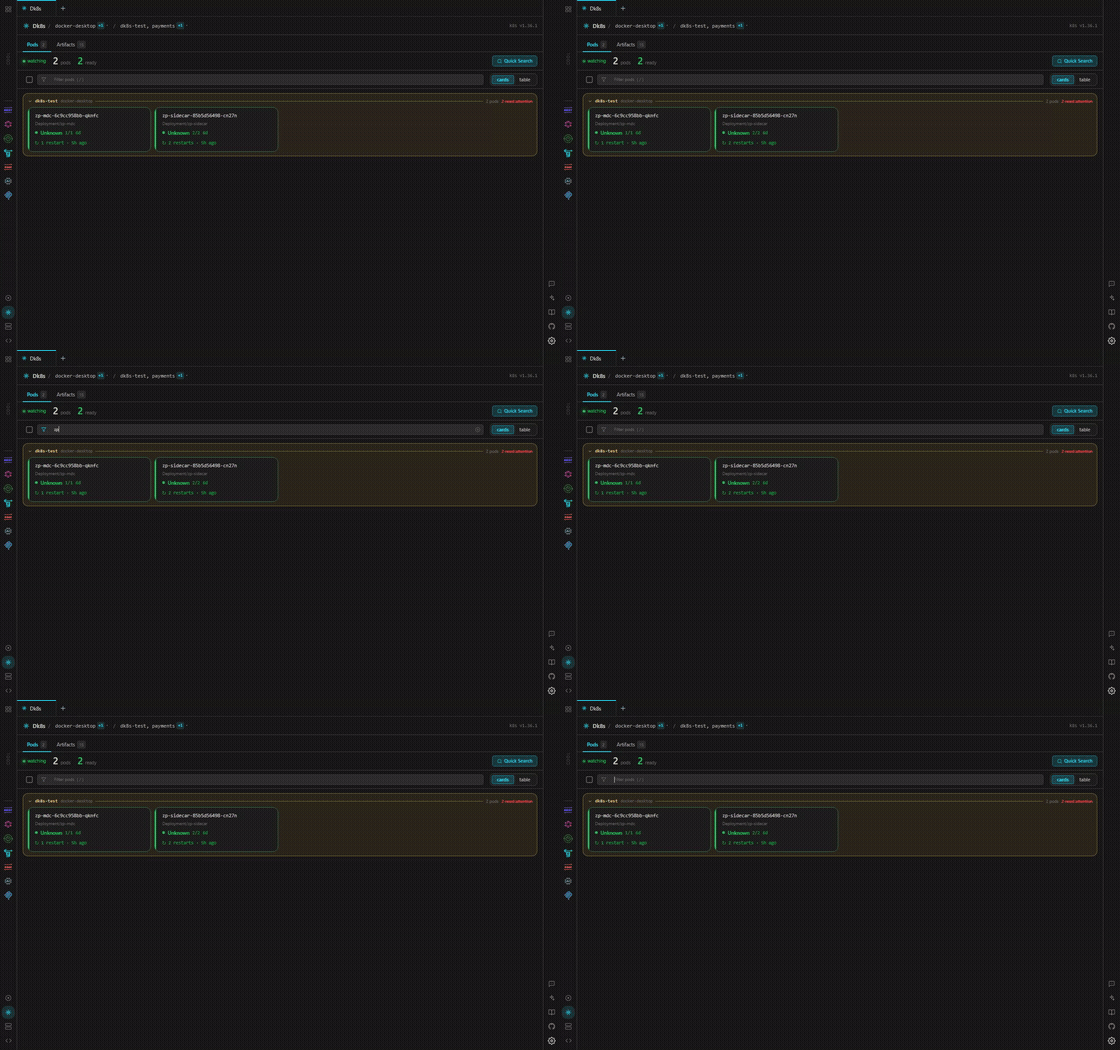
The pod grid, filtered and cleared

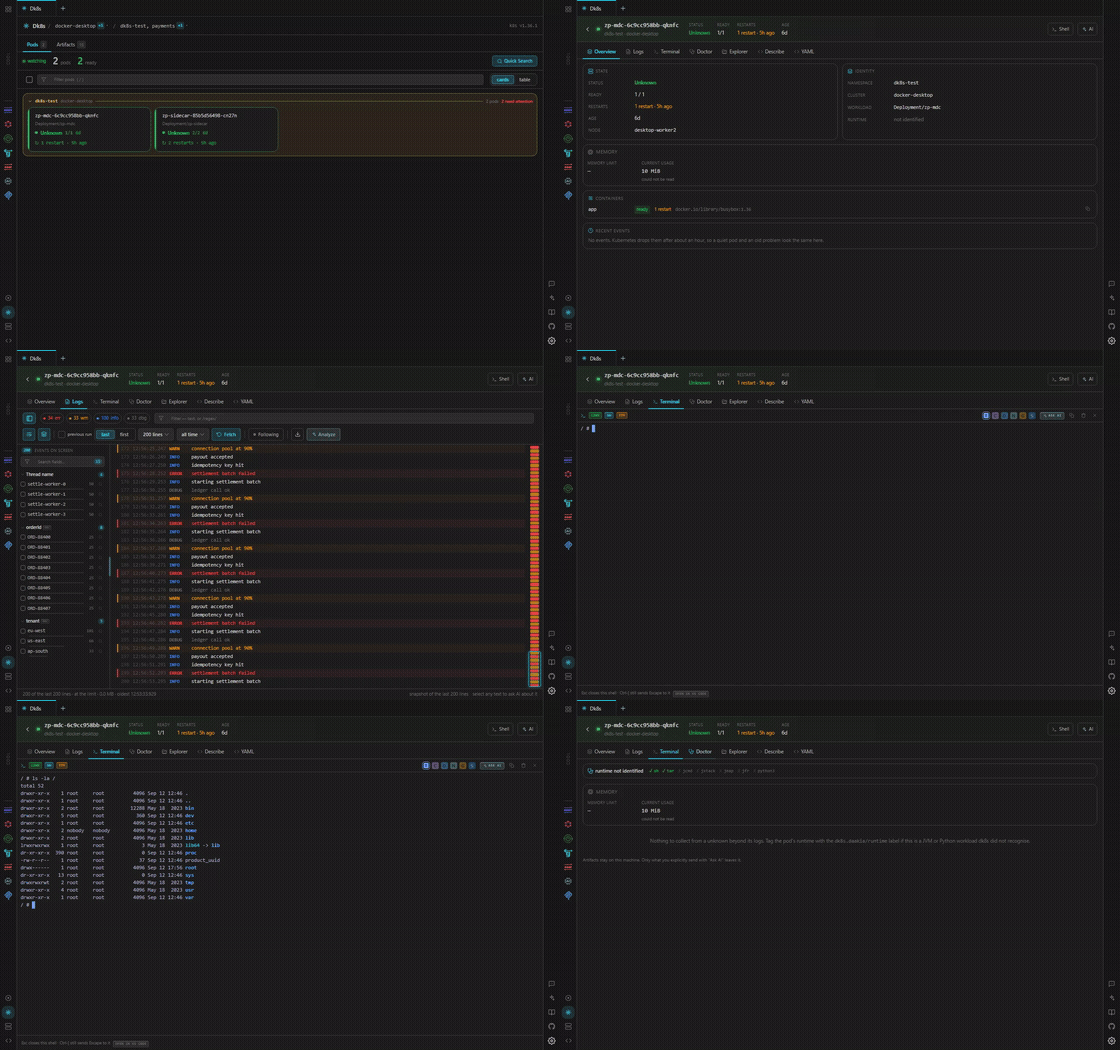
One pod — logs, a shell, Doctor, the file Explorer, Describe and YAML

Reads your existing kubeconfig. No agent, no port opened, no credential leaves the machine.

Pods — contexts and namespaces, a live grid with status, ready count, restarts and age. Starred deployments stay at the top and the tab opens on them. Filter as you type.

Opening a pod gives seven tabs:

Tab
Overview conditions, containers, images, resources, events
Logs see below
Terminal a real PTY in the container over the Kubernetes exec API
Doctor the profiler
Explorer the container's filesystem
Describe kubectl describe, highlighted
YAML the live manifest

Logs with structure. A configurable log format turns raw lines into fields, and a facet rail down the left says how events divide across them — level, thread, logger, and any MDC key the application logged (tenant, orderId). Click a value to include it, again to exclude it, again to clear. The magnifier searches the pod's whole log rather than the buffer you have. JSON, logfmt and access logs are recognised out of the box; anything else you can describe.

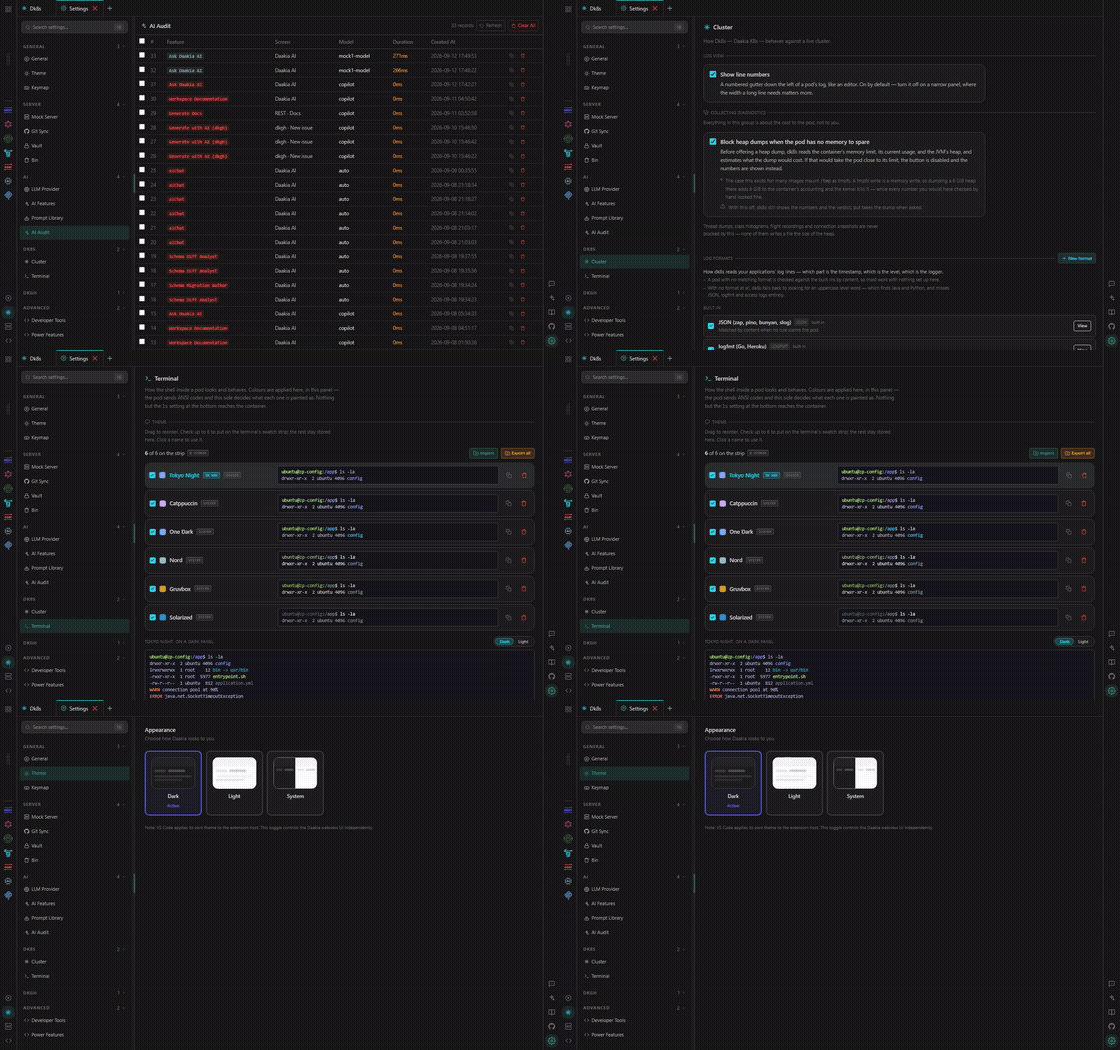
The terminal carries your own kubeconfig. Themes are configurable — import, export, generate with AI, six at a time — and every theme has a dark and a light variant with a preview toggle.

Explorer browses the container's filesystem with folder sizes, downloads that can be stopped and retried, a search across files, and "open a shell here" from any path or search hit.

Search across pods — text or regex over files and logs in every watched pod, with a force-stop that kills the child processes rather than setting a flag.

Artifacts collects what you capture — heap dumps, thread dumps, flight recordings — and hands them to Doctor.


Doctor — heap, threads, flight recordings

Open a .hprof, a thread dump or a .jfr and get a verdict rather than a viewer.

  • Heap — dominators and retained sizes, a histogram, a treemap, growth over successive dumps, leak suspects with the retention chain that keeps each one alive, and a class tracker.
  • Threads — states over time, deadlocks, contention, and the frames that matter with a call graph that reads as a stack.
  • Flight recordings — CPU hot spots with self and total time kept apart, blocking and allocation profiles, GC and probe timelines, and an event browser.

There is a CLI for the same analysis (cli/daakia-heap-check.mjs), so a heap check can run in CI.


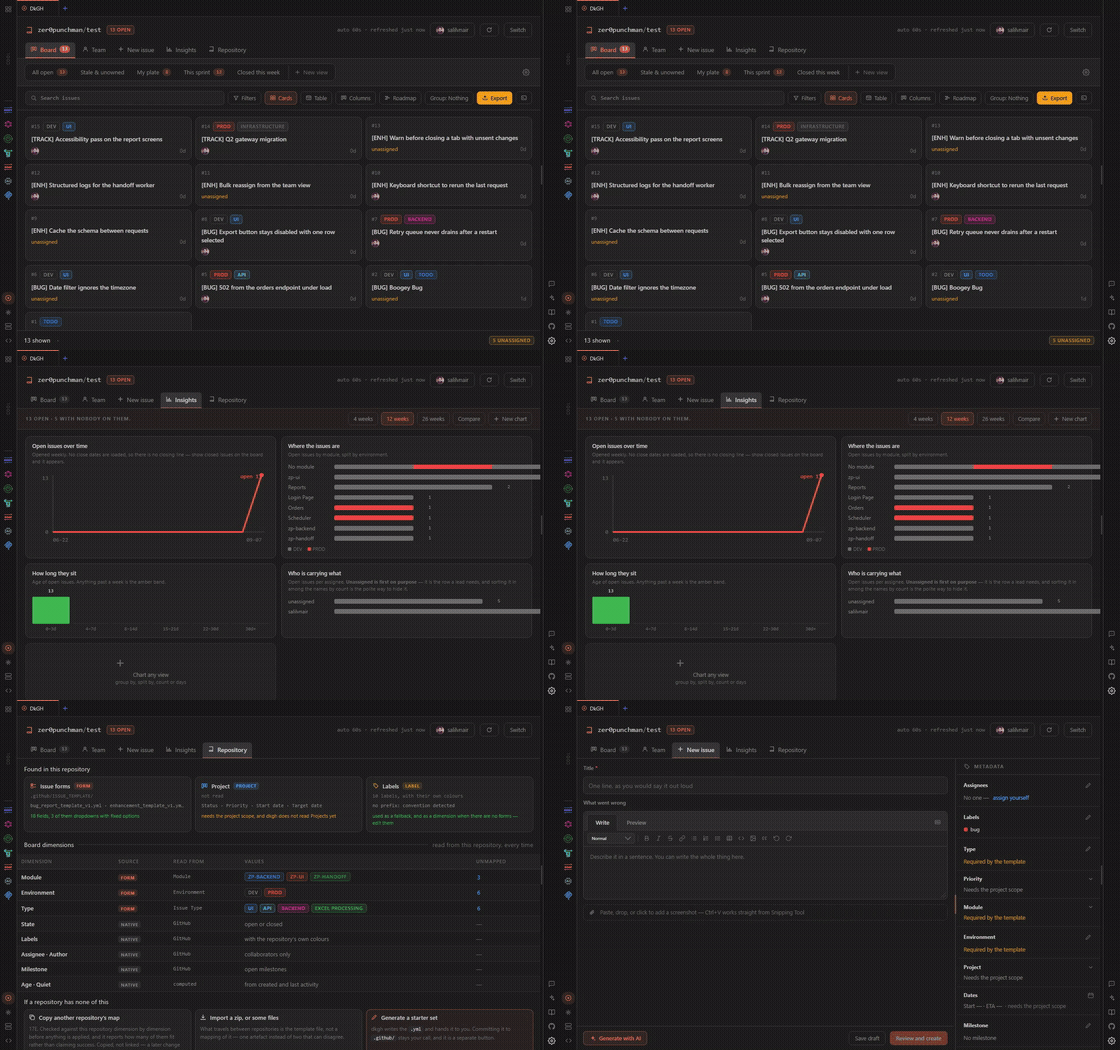
DkGH — one repository's issues

Driven entirely through the official gh CLI: your GitHub credential stays in the OS keychain and never reaches Daakia. Scopes, hosts and accounts are read from gh, every command is disclosed before it runs, and the confirm screen is built so it cannot describe an action other than the one about to happen.

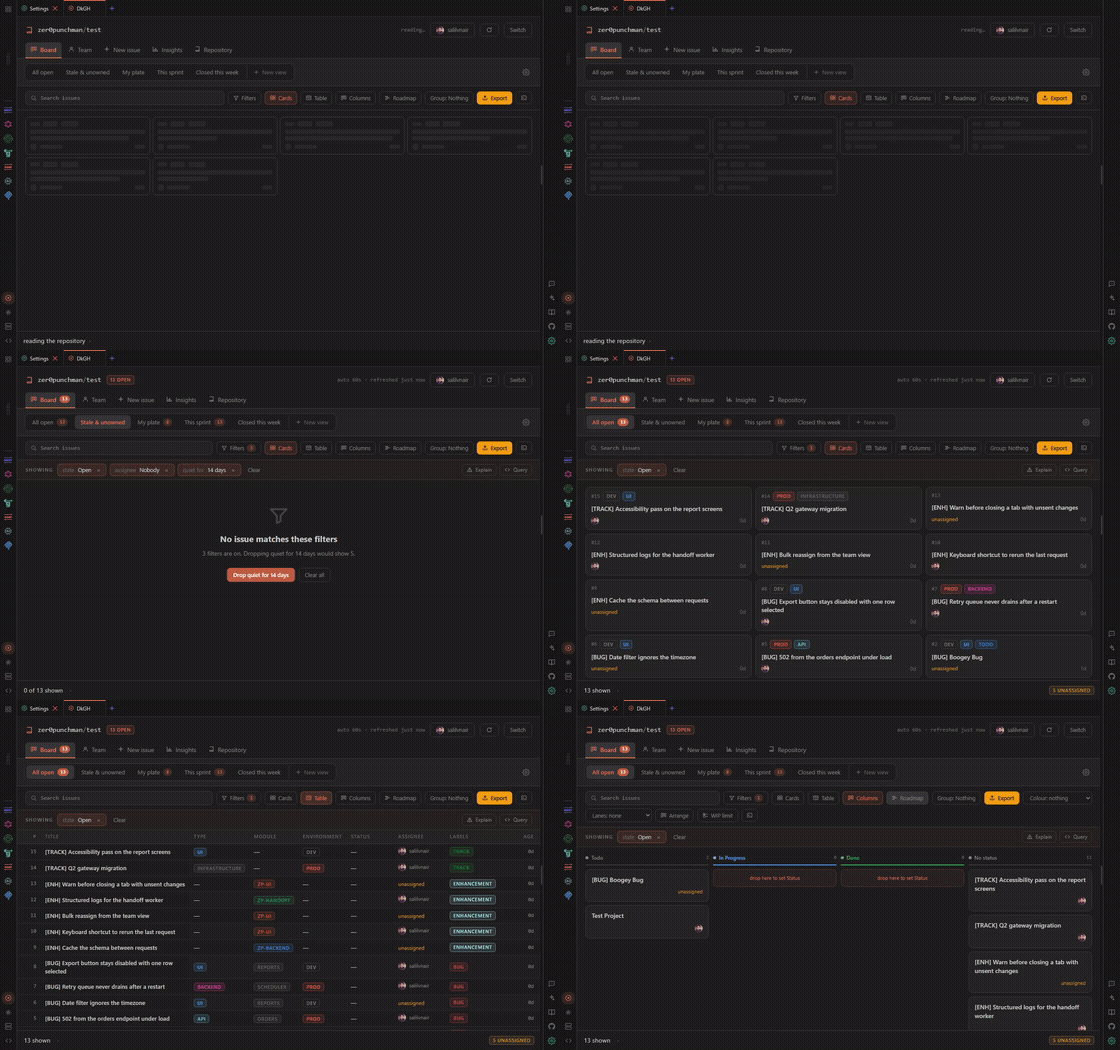
The DkGH board — cards, table, columns and roadmap from one filter

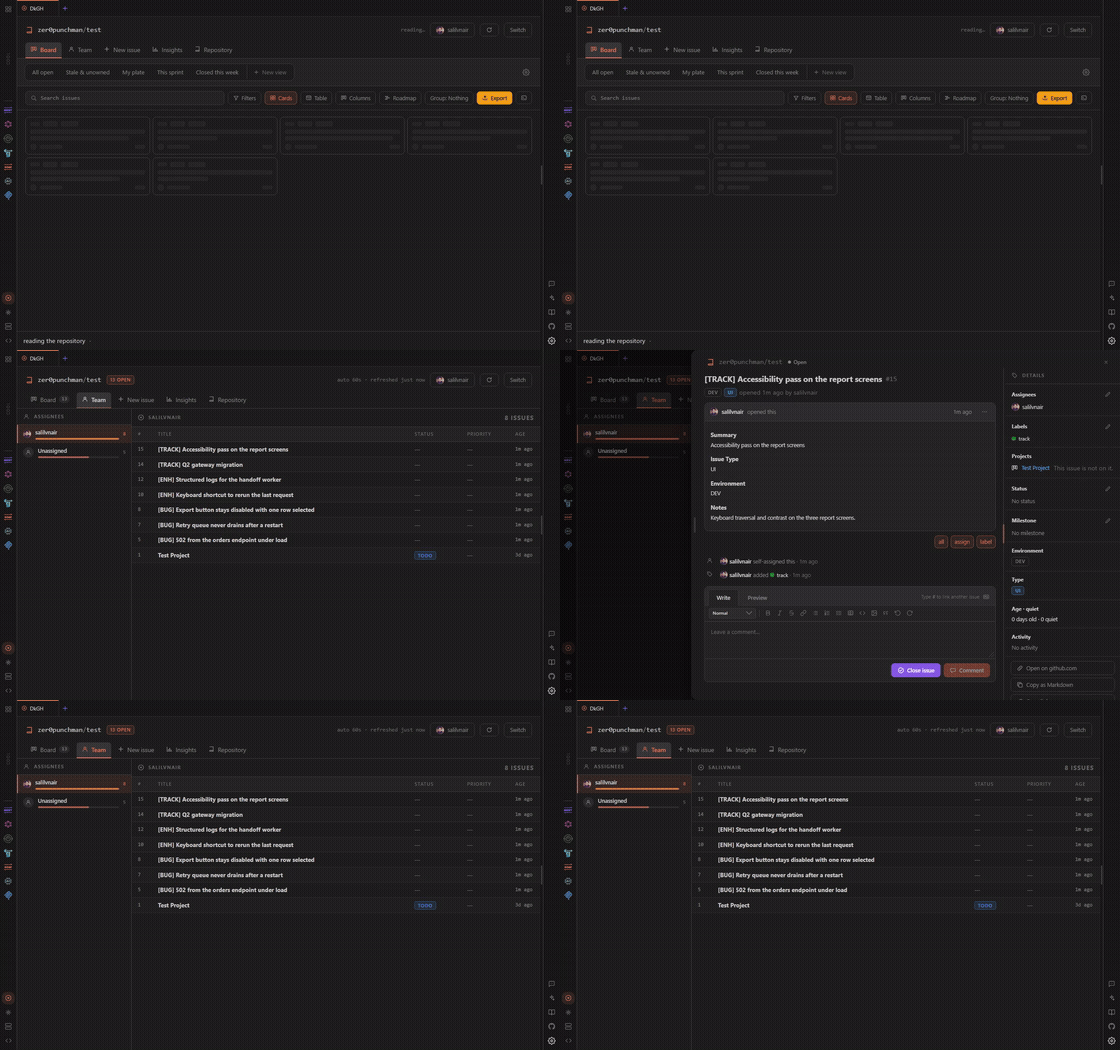
The team view, and an issue opened as a sheet over the board

Insights — open issues over time, by module, by age, by assignee

Board, in four shapes from one filter — cards, a table, columns by status, and a roadmap over time.

Saved views — "All open", "Stale & unowned", "My plate", "This sprint", "Closed this week", and your own. Each carries its count, and a shared link says what it drops rather than silently narrowing.

Team — who is carrying what, unassigned first, because that is the row a lead needs.

One issue in full, as a sheet over the board rather than a navigation away from it: comments, closing with a reason, labels, relations, and rail edits the way github.com does them.

Insights — open issues over time, where they are by module split by environment, how long they sit, who is carrying what; plus your own charts, pinned, and a comparison against the period before.

Repository — where the chips come from. Import the repo's issue-form templates and their dropdowns become board columns; move a field map between repositories; take a label set from somewhere else.

Export — a real .xlsx, a PDF that reads as a status mail, a repository's whole history, and a scheduled export that runs every Friday.

Filing — a composer with the metadata beside it, generate-with-AI, and screenshot upload. Creation runs as a sequence with duplicate detection and retry.


Daakia AI

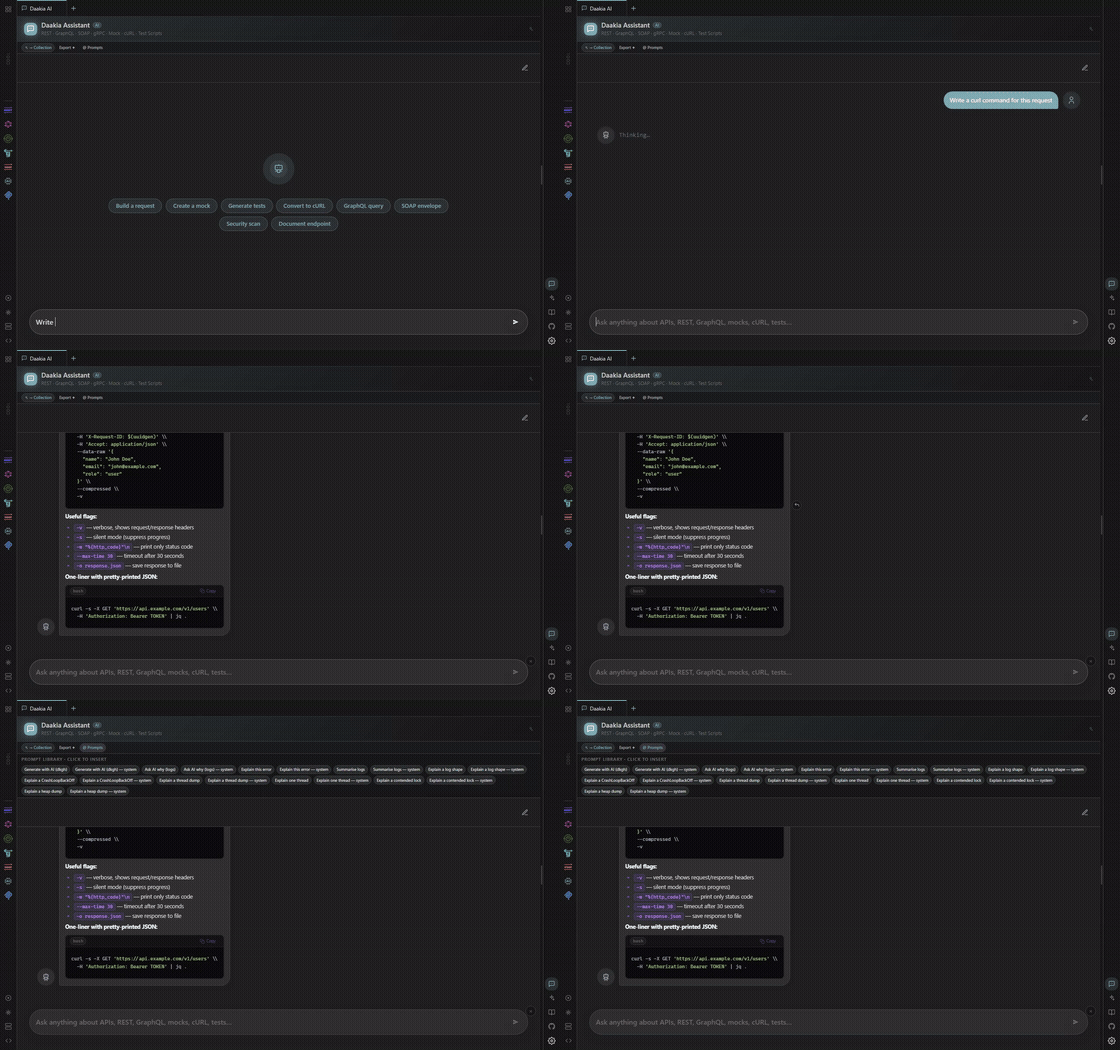
The assistant answering, with the Prompt Library open over it

The panel

A chat tab that knows about the request in front of you: it can turn a description into a request, explain a response, write test scripts, convert a cURL command, and hand its answer straight into a collection.

Providers

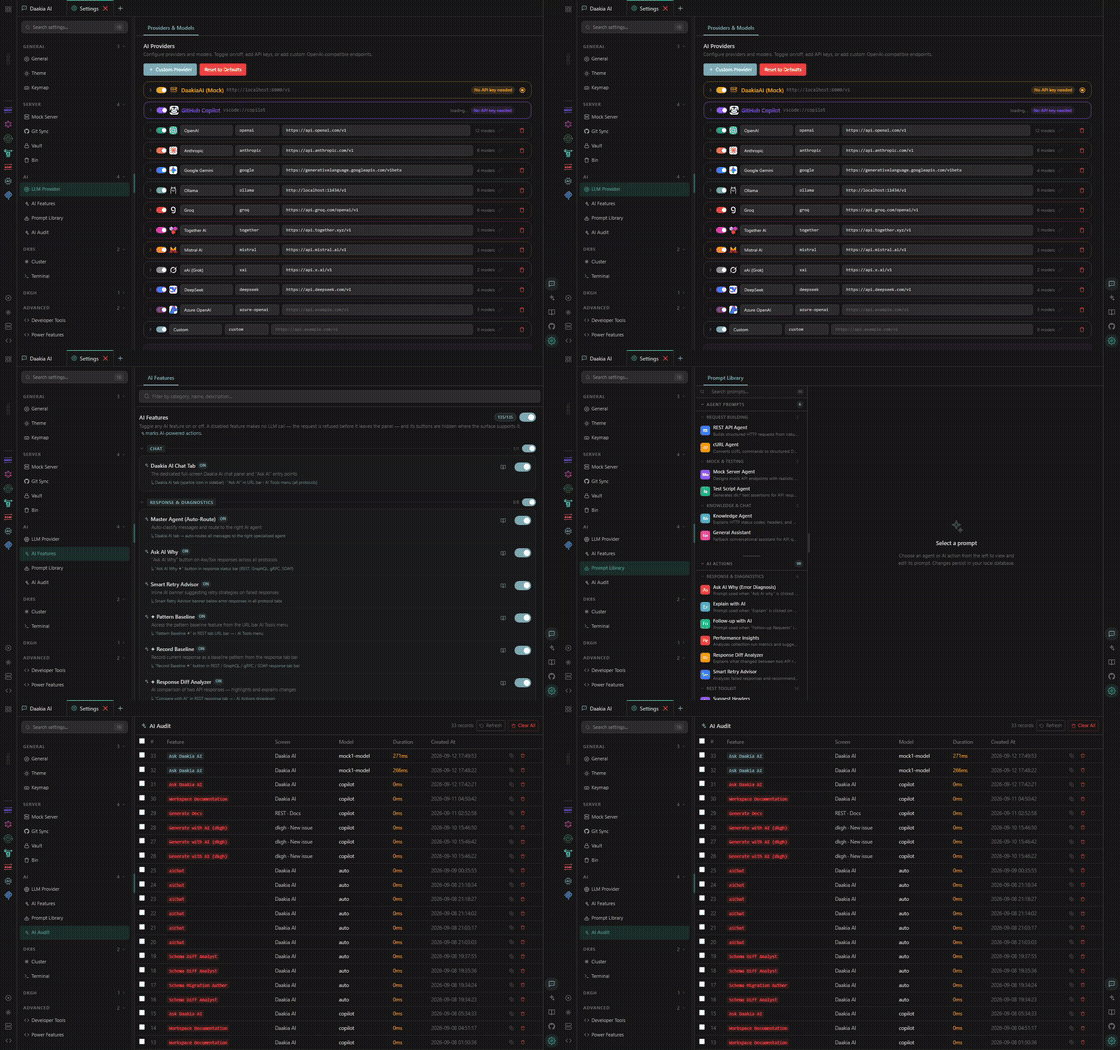
Thirteen, configured in Settings → LLM Provider: GitHub Copilot (no key — it uses your VS Code session), OpenAI, Anthropic, Google Gemini, Ollama (local), Groq, Together AI, Mistral, xAI, DeepSeek, Azure OpenAI, any OpenAI-compatible endpoint, and DaakiaAI (Mock) pointed at your own AI mock server. Keys are stored through VS Code's SecretStorage, which means the OS keychain.

The tools

Around eighty AI features, each attached to the screen where it is useful rather than to a separate menu — schema validation, semantic diff, security audit, SDK generation, data generation, contract testing, mock intelligence, traffic analysis, a dependency graph, protocol-specific explainers for GraphQL, gRPC and SOAP, and an agent that can compose several of them.

Three things make that number bearable:

  • Every feature has a switch, and the switch stops the call — not the rendering of the result, the network call itself.
  • Every call has a name, a screen and one door, and leaves an entry in the AI Audit log, including the ones that fail.
  • The Prompt Library holds the prompt behind every feature, editable, so a house style or a domain hint applies everywhere.

@daakia in Copilot Chat

A registered chat participant, with /request, /mock, /test, /curl and /explain.


Power features

  • Load Tester — concurrency, duration and ramp, against real requests.
  • Bulk URL Tester — a list of URLs in, what the server actually said out.
  • Request Interceptor — a proxy that captures traffic into Daakia.
  • API Monitor — scheduled checks with rules, editable after the fact.
  • Request Chaining — take a value out of one response and into the next.
  • Response Diff and Schema Diff — two responses or two schemas, compared structurally, with anomaly detection.
  • Compare with clipboard — right-click anything holding data.
  • Response Visualization — tables, images and PDFs rendered inline.
  • Client Certificates, Cookie Manager, Proxy Settings including the operating system's proxy and PAC files — honoured inside VS Code too (see REST).

Import and export

Import — Postman, Insomnia, Bruno, Thunder Client, HTTPie, HAR, OpenAPI (v2/v3), cURL commands, and Daakia's own format. One detector decides what a document is, so every entry point recognises the same set.

Export — Daakia JSON, Postman, Bruno, Insomnia, HTTPie, OpenAPI and HTML/Markdown docs. The OpenAPI export describes a real API: inferred body schemas with types and formats rather than { type: 'object' }, and responses built from your saved examples.


The CLI

node cli/daakia-run.mjs collection.json \
  --env staging.json --iterations 5 --concurrency 4 \
  --filter smoke --bail --junit results.xml

--env, --env-var, --data, --folder, --filter, --iterations, --concurrency, --delay, --timeout, --insecure, --bail, --json, --junit. Exit codes are honest, which took fixing: a passing run used to exit 127 on Windows.

cli/daakia-heap-check.mjs runs Doctor's heap analysis headlessly.


Git Sync, Vault, Bin

Git Sync commits your collections, environments, mock servers, history, themes and AI config to a repository — on an interval or on demand — each category individually switchable, with a status card that says what happened.

  • A folder per person. Each install has a sync id and a name — git's global user.name, or your OS user — and writes only users/<id>/. Two people syncing at the same time never touch the same file, so there is nothing for git to conflict on; a sync fetches, writes your folder and pushes, retrying if someone pushed first.
  • Private by default. Everything in your folder is imported only by you — on your other machines, linked by pasting the same sync id. Private means private from the app, not from git clone, so history leaves with credentials redacted (auth headers, cookies, auth-tab values, secret variables, ?api_key=) and environments with secret values redacted.
  • Sharing is per workspace — see Workspaces.
  • Settings live in Daakia's database, not VS Code's workspace settings, so sync is configured once for every window and for the browser build.

Vault encrypts secret environment values with AES-256-GCM, the passphrase held in the OS keychain. Secrets stay redacted across every export format.

Bin is a 30-day soft delete for history, collections, mock servers and environments — deleting is recoverable, and a restore goes back to the workspace it was deleted from.


DevTools

Daakia's own console, network log, performance timeline and AI insights

Daakia's own instrumentation, not the browser's: a Console carrying script console output, a Network log of what the extension host sent, a Performance timeline, and — when the Intelligence Dashboard feature is on — AI Insights. Settings → Developer Tools adds a database explorer, a debug snapshot, and the request and session audit trails.


Settings

The four AI sections — LLM Provider, AI Features, Prompt Library, AI Audit

Dk8s settings — cluster, terminal themes, and the app theme

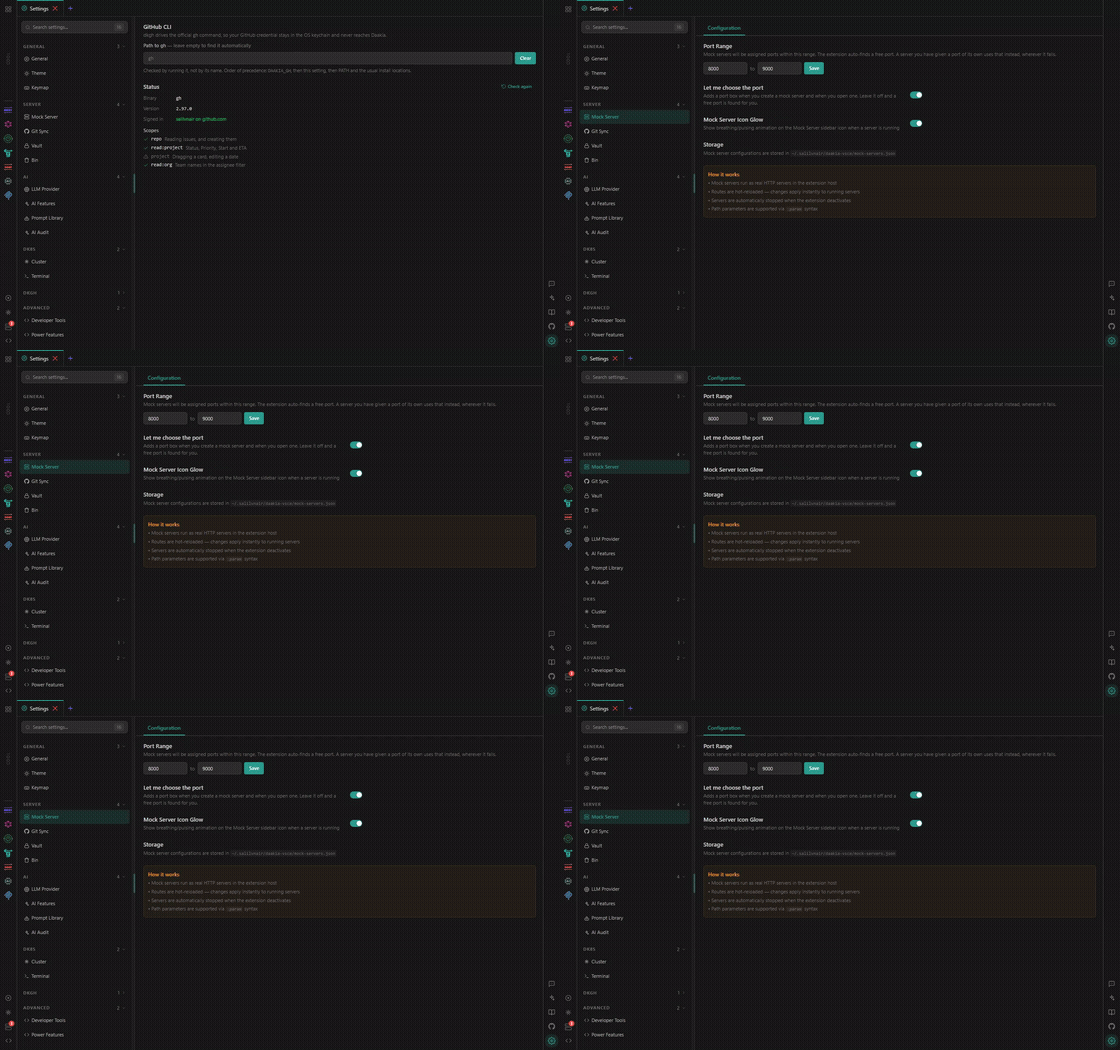
Mock Server settings — port range and defaults

Sixteen sections, searchable:

General · Theme · Keymap — appearance, and the keyboard map. Theme has custom palettes the way the terminal does: build one from thirteen colours with a live preview and contrast check, start from a file, copy one, drag to reorder. Palettes live in the database, so Git Sync carries them.

Mock Server · Git Sync · Vault · Bin — the server side.

LLM Provider · AI Features · Prompt Library · AI Audit — the four AI sections.

Cluster · Terminal — Dk8s: log formats, diagnostics limits, terminal themes.

GitHub CLI — which gh, which account, which scopes, with a live status check.

Developer Tools · Power Features.

Six settings are also exposed to VS Code's own settings.json under daakia.*: dbPath, requestTimeout, followRedirects, sslVerification, maxHistoryEntries and saveResponseInHistory. Git Sync's moved into the database in 3.2.0 and are carried over on first run.


Commands and keybindings

Key Command
Ctrl+Enter Send request
Ctrl+N New request
Ctrl+S Save request
Ctrl+W Close tab
Ctrl+L Focus URL bar
Ctrl+K Command palette (Daakia's own)
Ctrl+Shift+I Import collection

Eighteen commands are registered under Daakia: in VS Code's palette, including Open Panel, Import Bruno Collection, Start/Stop Mock Server, Change Database Location, Rebuild SQLite, and the two Git Sync directions.


Architecture

┌──────────────────────────────────────────────────────────────┐
│  VS Code extension host  (Node)                              │
│  src/ — 444 files                                            │
│                                                              │
│  protocol clients · mock servers · SQLite · kubeconfig       │
│  gh CLI · heap/thread/JFR analysers · importers/exporters    │
└───────────────────────────┬──────────────────────────────────┘
                            │  postMessage
┌───────────────────────────┴──────────────────────────────────┐
│  Webview  (React 19 + TypeScript + Vite)                     │
│  webview-ui/ — 895 files                                     │
│                                                              │
│  tabs · panels · Monaco · zustand stores · @salilvnair/dui   │
└──────────────────────────────────────────────────────────────┘

Everything privileged happens in the extension host. The webview renders and asks; it never opens a socket, reads a file or spawns a process itself. Messages are typed and one-way in each direction.

local-server/ is a third process used only in browser development. It mirrors the extension host over a WebSocket so the UI can be run and driven outside VS Code — which is also how the demo recorder works.

@salilvnair/dui is the component library, developed alongside Daakia. Every interactive component takes a testId, which is what makes the whole app drivable by Playwright.

Storage is SQLite (sql.js) at a path you can change, holding history, collections, environments, themes, mock configs and audit trails. Secrets are the exception: those go to SecretStorage. The extension and the browser build can open the same file: saves are atomic (write, then rename), a process that sees another write reloads rather than saving its stale copy over it, and a change it has to set aside is kept beside the database as daakia.db.conflict-<time> rather than dropped.

Tests — 261 test files across the extension host, the webview and the CLI, including VS Code end-to-end suites for read-only shared workspaces and for the proxy under VS Code's own proxy handling.


Development

git clone https://github.com/salilvnair/daakia.git
cd daakia
npm install
npm run watch          # extension host, incrementally
npm run dev:webview    # the webview, in another terminal
# then press F5 in VS Code — an Extension Development Host opens

To run the UI outside VS Code — which is also how the demo recorder drives it:

npm run local-server:dev   # the extension-host mirror on 7890, restarts on rebuild
npm run dev:webview        # the webview
Command
npm run build:all typecheck, then build both halves
npm run build:ext / build:webview one half at a time
npm run watch extension host, incrementally
npm run dev:webview Vite dev server for the webview
npm run typecheck tsc --noEmit across both halves
npm run lint ESLint over src/
npm run test:webview Vitest — the webview suites
npm run test:e2e the VS Code integration tests
npm run heap:all the Doctor analyser fixtures end to end
npm run dk8s:verify · threads:verify · logs:verify · proxy:verify · audit:verify the fixture suites, by area
npm run run:collection the CLI runner
npm run showcase re-record, compose, and write the short GIF

Packaging:

npm run vscode:package                       # -> daakia-3.0.0.vsix
code --install-extension daakia-3.0.0.vsix

License

MIT — see LICENSE.

  • Contact us
  • Jobs
  • Privacy
  • Manage cookies
  • Terms of use
  • Trademarks
  • Your Privacy Choices
  • Consumer Health Privacy
© 2026 Microsoft