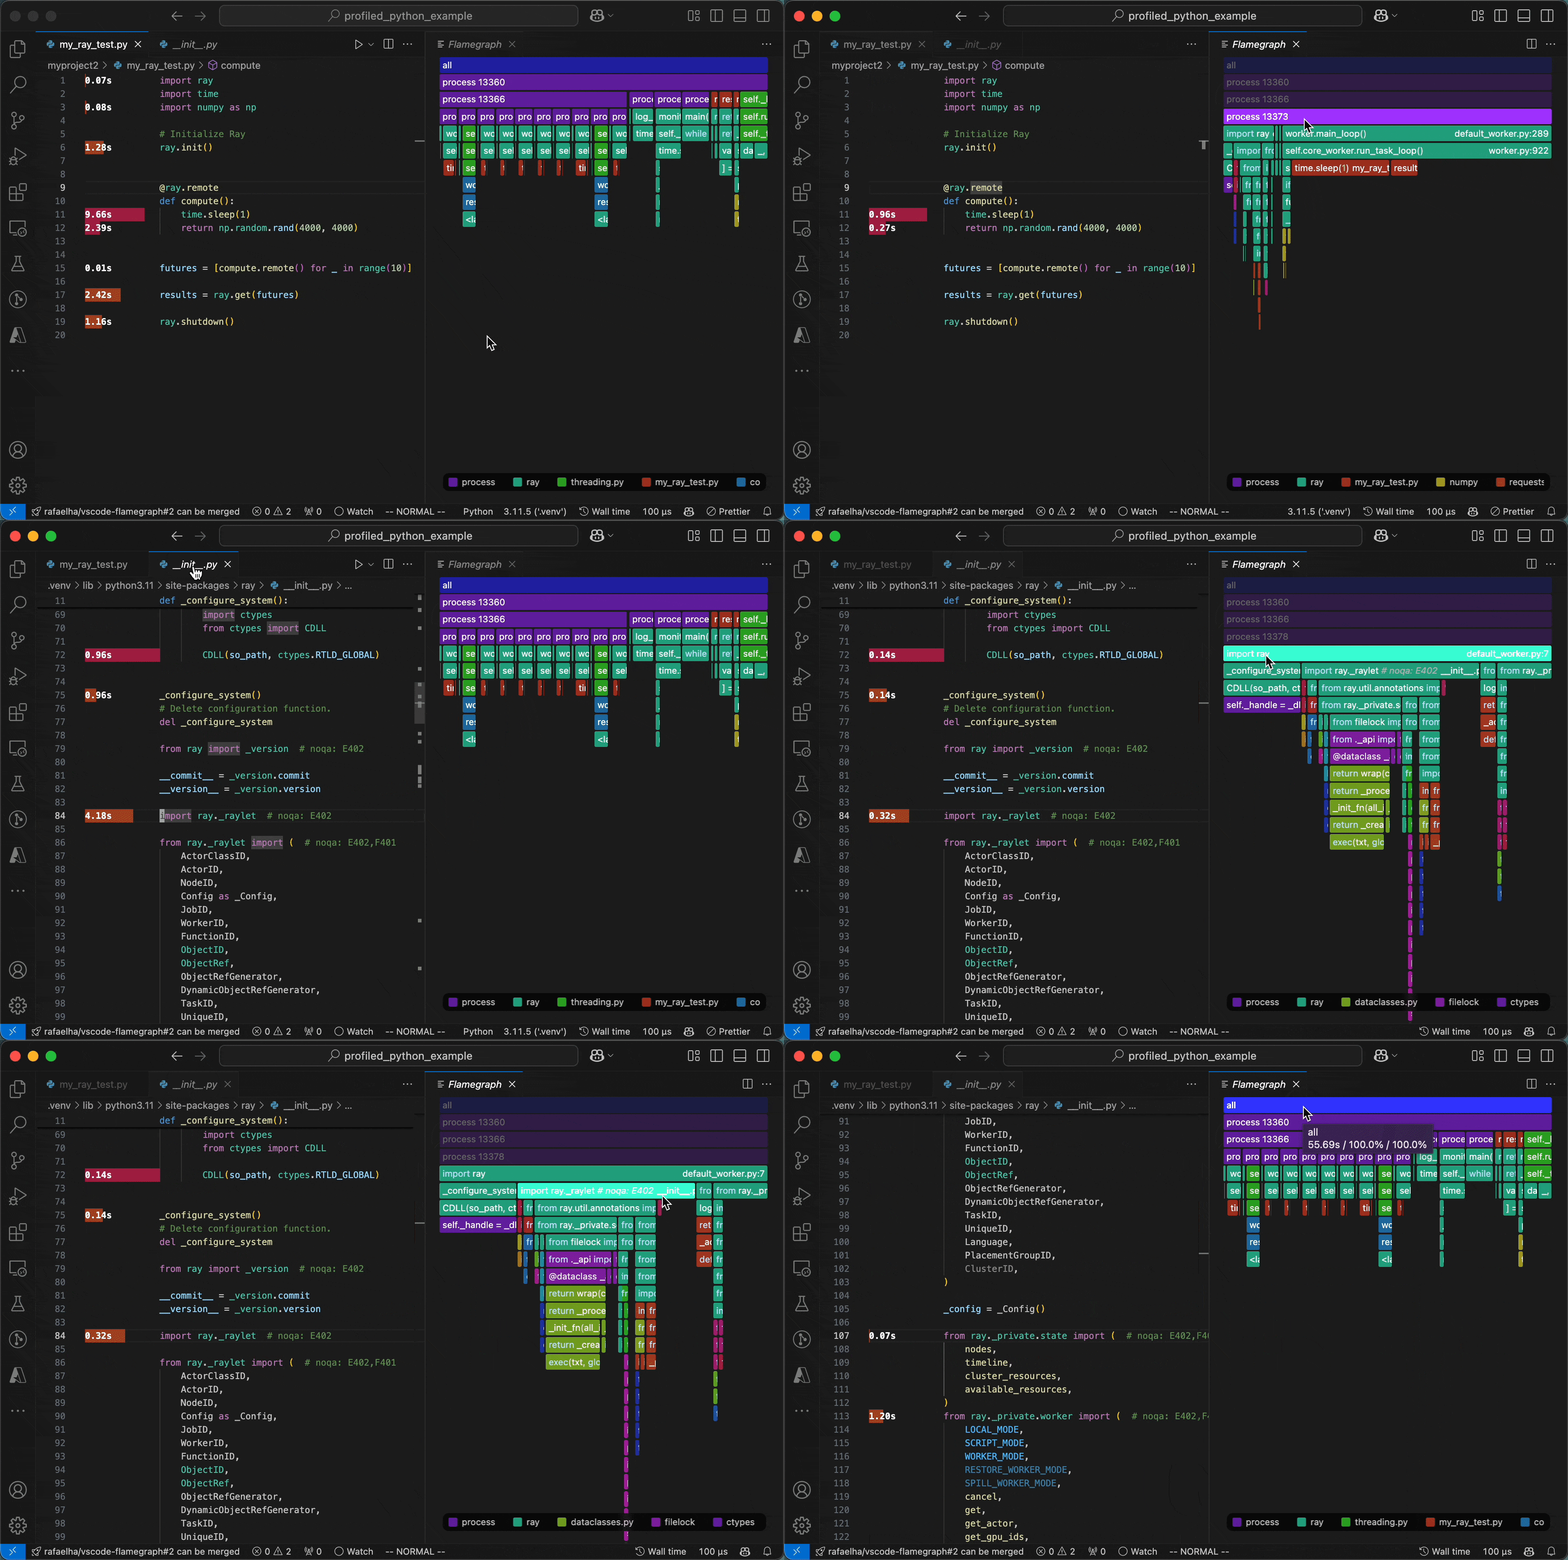
py-spy and memray integration for VS Code

Profiling your code with Flamegraph is simple.
In Jupyter notebooks, click the 🔥 button above the cell you want to profile:

For Python scripts, select Flamegraph: Profile file with py-spy from the dropdown menu next to the ▶️ icon:

Your code will be profiled with py-spy. You can interrupt the profiling anytime with Ctrl+C. The profiling results are visualized next to your code and as a flamegraph in a new tab.
To hide the inline annotations, right-click anywhere in the editor and select Flamegraph: Toggle Inline Profile.
Additionally, on Linux, macOS, and within WSL or Docker containers, basic memory profiling is supported with memray. Use the command palette in VS Code (Cmd+Shift+P/Ctrl+Shift+P) to select Flamegraph: Profile file with memray or Flamegraph: Profile cell with memray. This will show memory allocations for the time snapshot where heap memory usage reached its maximum.

Usage
The extension visualizes profiling data in two ways:
Inline Code Annotations: Shows timing or memory information for each function scope, with colors indicating the scope level.
Interactive Flamegraph: Displays the complete call stack of your profiled code (see this article about flamegraphs). You can:
- Click any element to zoom in
- Click parent elements to zoom out
Cmd+Click (Mac) or Ctrl+Click (Windows/Linux) to jump into the code.- Click legend elements to filter the flamegraph by module.
- Click the
</> button in the legend to toggle between code or function display.
The flamegraph and inline annotations are linked -
when you select an element in the flamegraph, the corresponding inline annotations are filtered.

Useful Commands
Open the Command Palette (Command+Shift+P on Mac and Ctrl+Shift+P on Windows/Linux) and type in one of the following commands:
| Command |
Description |
Flamegraph: Profile file with py-spy |
Profile the active file with py-spy and display the results |
Flamegraph: Toggle Inline Profile |
Show or hide the inline annotations. This is also accessible via right-click on the editor. |
Flamegraph: Show |
Open a new tab showing the flamegraph |
Flamegraph: Attach py-spy to running process |
Attach py-spy to a running process and display the results. The extension will ask for a Process ID (PID) to attach to |
Flamegraph: Profile all unit tests with pytest |
Run and profile the pytest command |
Flamegraph: Profile unit tests in file with pytest |
Run and profile the pytest command on the active file |
Flamegraph: Show py-spy top |
Displays a top like view of functions consuming CPU using py-spy |
Flamegraph: Load Profile |
Load a profile from a file. You may also right-click on .pyspy or .memray files in the file explorer and select Flamegraph: Load Profile. |
For memory profiling with memray, use the following commands. Note that memray is not supported on Windows. On Windows, you can still use the extension within Windows Subsystem for Linux (WSL) or Docker containers.
| Command |
Description |
Flamegraph: Profile file with memray |
Profile the active file with memray and display the results |
Flamegraph: Profile cell with memray |
Profile the active cell with memray and display the results |
Flamegraph: Profile notebook with memray |
Profile the entire notebook with memray and display the results |
Flamegraph: Attach memray to running process |
Attach memray to a running process and display the results. The extension will ask for a Process ID (PID) to attach to |
Flamegraph: Attach memray live view to running process |
Attach memray live view to a running process for real-time memory profiling |
Using the Command Line
You can run py-spy directly from the command line. The extension will watch for changes to the files profile.pyspy and profile.memray in the current workspace and load the profile when it changes.
To profile a script, use the command:
py-spy record --output profile.pyspy --format raw --full-filenames -- python my_script.py
Here, it is important to specify the output file as profile.pyspy and the format as raw. For best results, use the --full-filenames flag to allow the extension to resolve file names in the flamegraph. For additional configuration options, see the py-spy documentation or run py-spy record --help.
Using VS Code Tasks
The extension allows you to run the py-spy profiler from VS Code's task system. This makes it easy to integrate profiling into your workflow and configure custom tasks.
Using the Task Explorer
- Open the Command Palette (
Ctrl+Shift+P or Cmd+Shift+P on macOS)
- Type "Tasks: Run Task" and select "flamegraph"
- Choose one of the available flamegraph tasks or click the gear icon to customize the task.
Creating a tasks.json File
You can also create a tasks.json file in your .vscode folder to customize the tasks. This is currently only supported for py-spy profiling. For example, the task
{
	"version": "2.0.0",
	"tasks": [
		{
			"type": "flamegraph",
			"file": "${file}",
			"args": [
				"--my-custom-arg1",
				"value",
			],
			"label": "Flamegraph: My custom profile command"
		}
	]
}
will execute the command
py-spy <py-spy-args> -- python <current-file> --my-custom-arg1 value.
Or, you can profile a specific unit test (via pytest) with the following task definition:
{
	"version": "2.0.0",
	"tasks": [
		{
			"type": "flamegraph",
			"args": [
				"-m",
				"pytest",
				"path/to/my_test_file.py::test_my_function",
			],
			"subprocesses": false,
			"native": true,
			"subprocesses": false,
			"gil": false,
			"idle": false,
			"nonblocking": false,
			"label": "Flamegraph: Profile my_test_function"
		}
	]
}
Notice that we additionally enabled the py-spy native option. This will execute the command
py-spy <py-spy-args> --native -- python -m pytest path/to/my_test_file.py::test_my_function
Setting custom keyboard shortcuts
You can bind tasks to keyboard shortcuts by adding entries to your keybindings.json file:
- Open the Command Palette (
Ctrl+Shift+P or Cmd+Shift+P on macOS)
- Type "Preferences: Open Keyboard Shortcuts (JSON)" and select it
- Add entries like the following:
{
    "key": "ctrl+shift+enter",
    "command": "workbench.action.tasks.runTask",
    "args": "Flamegraph: My custom profile command"
}
Contributing
Development
- Clone the repository
git clone https://github.com/rafaelha/vscode-flamegraph.git
- Install dependencies for both the extension and the flamegraph-react UI
npm run install:all
- Build webview UI source code, i.e. the flamegraph react component
npm run build:webview
- In VS Code, press
F5 to open a new Extension Development Host window.
TODO
- [ ] Switch to
speedscope format. Eventually, this extension should be refactored to be compatible with all profilers that output speedscope files. Currently, only left-heavy profile view is supported.
- [ ] Unit tests
- [x] Performance tests
- [x] Option to filter the flamegraph by module.
- [ ] Refactor flamegraph react component. Currently, the whole graph is recomputed on every mouse hover event. We could consider using
speedscope npm package to render the flamegraph.
- [x] Memray memory profiles
- [ ] Select sampling interval
- [x] Jupyter notebook profiling.
- [ ] Inverted flamegraphs


