Fork / 分支声明
本项目是 adelphes/android-dev-ext(MIT License, Copyright (c) 2017 Dave Holoway)的社区维护分支,在原版 1.4.0 基础上持续修复问题并新增功能。感谢原作者 Dave Holoway 的开源贡献,原版权声明见 LICENSE。
This project is a community-maintained fork of adelphes/android-dev-ext (MIT License, Copyright (c) 2017 Dave Holoway). We keep fixing bugs and adding features on top of the original 1.4.0. Full license text is in LICENSE.
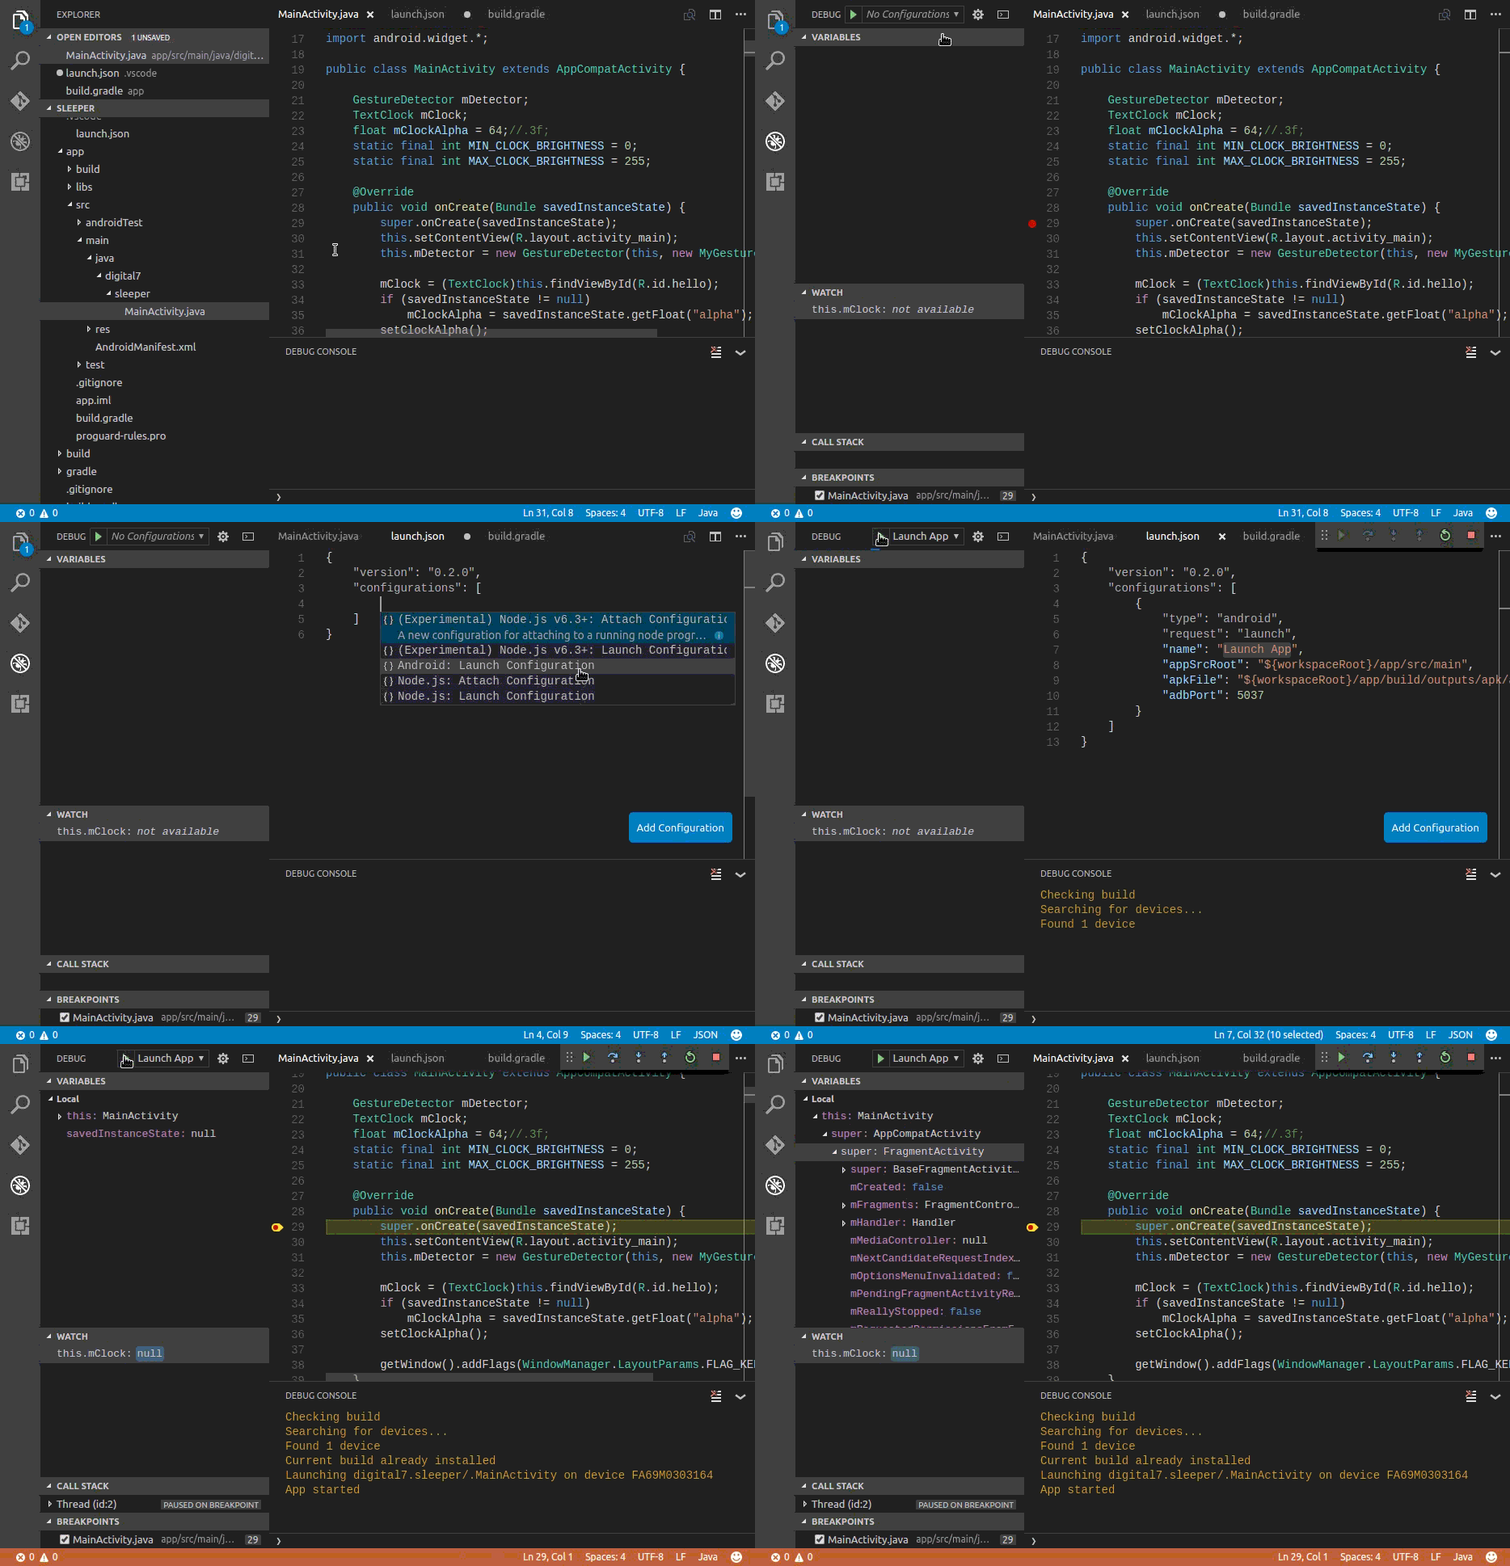
基于 JDWP + ADB 的 Android 应用调试扩展:在 VS Code 中安装、启动、调试 Android 应用。自带 IDEA 风格 Logcat 侧边栏、可视化启动控制与配置面板,界面支持中英文。
An Android debugging extension for VS Code, powered by JDWP + ADB. Install, launch and debug your Android apps right in VS Code, with an IDEA-style Logcat sidebar, visual launch controls and a settings panel. The UI is fully localized in English and Simplified Chinese.
功能特性 / Features
- 逐步调试:断点、变量查看与修改、异常断点、步进 Android 源码 / Line-by-line stepping, breakpoints, variable inspection & modification, break on exceptions, step through Android sources
- IDEA 风格 Logcat 侧边栏(可拖到底部面板):级别过滤、暂停/继续、自动滚动、正则过滤、结构化列(时间/级别/PID/TID/标签/消息)、可拖拽列宽、固定列头 / IDEA-style Logcat sidebar: level filters, pause, auto-scroll, regex filter, structured columns (time/level/PID/TID/tag/message), draggable columns, sticky headers
package:mine 只看当前应用:自动跟踪主/子进程,只显示当前应用的日志 / package:mine filter - only show logs from the current app, tracking its main & child processes- 进程筛选:按 PID 选择要查看的进程 / Filter logs by process (PID)
- 崩溃缓冲:一键查看
logcat -b crash / One-click crash buffer view (logcat -b crash)
- 导出日志:将当前 logcat 导出为文件 / Export logcat to a file
- 侧边栏启动视图:一键「启动并查看日志」「调试启动」「编译并启动 Release」/ Launch view: one-click "Launch + Logcat", "Debug Launch", "Build & Launch Release"
- 侧边栏设置视图:可视化编辑
launch.json / Settings view: visual editor for launch.json
openLogcatAfterLaunch:只跑 App 看日志,不附加调试器 / Run the app & auto-open Logcat without attaching the debugger- Java 智能提示(beta)/ Java Intellisense (beta)
- 中英文界面(i18n)/ English + Simplified Chinese UI
新增:
- 侧边栏 UI —— Activity Bar 三个视图(启动 / Logcat / 设置),告别纯命令面板工作流
- Logcat 侧边栏视图 + IDEA 风格工具栏(级别过滤 / 暂停 / 自动滚动 / 正则过滤 / 结构化列 / 可拖拽列宽 / 固定列头)
- i18n —— 英文 + 简体中文界面
- Logcat 切换为
-v threadtime 输出,显示 PID / TID 列
openLogcatAfterLaunch 启动配置 —— 启动后自动打开 Logcat 面板且不附加调试器(先清空缓冲,只显示本次启动日志)logcatFilter 启动配置 —— 限制全设备日志采集范围(如 --pid=$(pidof <pkg>))package:mine 过滤 —— 只显示当前应用的日志(对标 Android Studio)- 进程筛选器 —— 选择要查看的进程日志
- 崩溃缓冲视图(
logcat -b crash)
- 导出 Logcat 到文件
- 大规模日志渲染性能优化(DOM 上限 + 批量渲染 + 屏外跳过)
- 「编译并启动 Release」命令(自动映射 debug→release APK 路径,签名冲突自动重装)
修复:
- 调试器 attach 改为轮询等待目标进程(30s),覆盖安装 / 冷启动后可靠重连
- Logcat 渲染卡顿 —— 限制 DOM 节点上限(2000 行)+ 收窄后端历史缓存
- 华为 / EMUI 真机调试兼容(普通启动 + attach 替代
-D 等待调试器)
- 启动失败时自动用 manifest 的 launcher activity 回退重试
快速上手 / Quick Start
- 先构建出 APK(本扩展不负责构建,可用
preLaunchTask 自动构建,见下文);
- 在
launch.json 中添加 Android 启动配置(见下文示例);
- 按 F5 调试,或打开侧边栏「启动」视图一键启动。
只看日志(不调试)/ Run the App & View Logcat (no debugging)
在 launch.json 的 Android 启动配置中加一行:
{
    "type": "android",
    "request": "launch",
    "name": "Launch App & View Logcat",
    "openLogcatAfterLaunch": true,
    // ...其余配置同普通启动(appSrcRoot / apkFile 等)
}
按 F5 后:构建 → 安装 APK → 清空 logcat → 启动应用 → 自动打开 Logcat 面板(不进入调试模式)。
Press F5: build → install APK → clear logcat → launch the app → auto-open the Logcat panel (no debugger attached).
Requirements / 环境要求
You must have Android SDK Platform Tools installed. This extension communicates with your device via the ADB (Android Debug Bridge) interface.
You are not required to have Android Studio installed - if you have Android Studio installed, make sure there are no active instances of it when using this extension or you may run into problems with ADB.
需要安装 Android SDK Platform Tools,扩展通过 ADB(Android Debug Bridge)与设备通信。
无需安装 Android Studio;若已安装,使用本扩展时请确保没有正在运行的 Android Studio 实例,否则可能与 ADB 冲突。
Limitations
- This is a preview version so expect the unexpected. Please log any issues you find on GitHub.
- This extension will not build your app.
If you use gradle (or Android Studio), you can build your app from the command-line using ./gradlew assembleDebug or configure a VSCode Build Task to run the command (see below).
You must use gradle or some other build procedure to create your APK. Once built, the extension can deploy and launch your app, allowing you to debug it in the normal way. See the section below on how to configure a VSCode Task to automatically build your app before launching a debug session.
- Some debugger options are yet to be implemented. You cannot set conditional breakpoints and watch expressions must be simple variables.
- If you require a must-have feature that isn't there yet, let us know on GitHub.
Extension Settings / 启动配置
This extension allows you to debug your App by creating a new Android configuration in launch.json.
The following settings are used to configure the debugger:
本扩展通过在 launch.json 中创建 Android 启动配置来调试应用,常用配置项说明如下:
    {
        "version": "0.2.0",
        "configurations": [
            {
                // configuration type, request  and name. "launch" is used to deploy the app
                // to your device and start a debugging session.
                "type": "android",
                "request": "launch",
                "name": "Launch App",

                // Location of the App source files. This value must point to the root of
                // your App source tree (containing AndroidManifest.xml).
                "appSrcRoot": "${workspaceRoot}/app/src/main",

                // Fully qualified path to the built APK (Android Application Package).
                "apkFile": "${workspaceRoot}/app/build/outputs/apk/app-debug.apk",

                // `host:port` configuration for connecting to the ADB (Android Debug Bridge) server instance.
                // Default: localhost:5037
                "adbSocket": "localhost:5037",

                // Automatically launch 'adb start-server' if not already started.
                // Default: true
                "autoStartADB": true,

                // Launch behaviour if source files have been saved after the APK was built.
                // One of: [ ignore warn stop ]. Default: warn
                "staleBuild": "warn",

                // Target Device ID (as indicated by 'adb devices').
                // Use this to specify which device is used for deployment
                // when multiple devices are connected.
                "targetDevice": "",

                // Fully qualified path to the AndroidManifest.xml file compiled into the APK.
                // Default: "${appSrcRoot}/AndroidManifest.xml"
                "manifestFile": "${workspaceRoot}/app/src/main/AndroidManifest.xml",

                // Custom arguments passed to the Android package manager to install the app.
                // Run 'adb shell pm' to show valid arguments. Default: ["-r"]
                "pmInstallArgs": ["-r"],

                // Custom arguments passed to the Android application manager to start the app.
                // Run `adb shell am` to show valid arguments.
                // Note that `-D` is required to enable debugging.
                "amStartArgs": [
                    "-D",
                    "--activity-brought-to-front",
                    "-a android.intent.action.MAIN",
                    "-c android.intent.category.LAUNCHER",
                    "-n package.name/launch.activity"
                ],

                // Manually specify the activity to run when the app is started. This option is
                // mutually exclusive with "amStartArgs".
                "launchActivity": ".MainActivity",

                // Time in milliseconds to wait after launching an app before attempting to attach
                // the debugger. Default: 1000ms
                "postLaunchPause": 1000,

                // Set to true to output debugging logs for diagnostics.
                "trace": false
            }
        ]
    }
Building your app automatically
This extension will not build your App. If you would like to run a build each time a debug session is started, you can add a preLaunchTask option to your launch.json configuration which invokes a build task.
.vscode/launch.json
Add a preLaunchTask item to the launch configuration:
{
    "version": "0.2.0",
    "configurations": [
        {
            "type": "android",
            "request": "launch",
            "name": "App Build & Launch",
            "preLaunchTask": "run gradle",
            ...
        }
    ]
}
Add a new task to run the build command:
.vscode/tasks.json
{
    "version": "2.0.0",
    "tasks": [
        {
            "label": "run gradle",
            "type": "shell",
            "command": "${workspaceFolder}/gradlew",
            "args": [
                "assembleDebug"
            ],
            "presentation": {
                "echo": true,
                "reveal": "always",
                "focus": false,
                "panel": "shared",
                "showReuseMessage": true,
                "clear": false
            },
            "problemMatcher": [],
            "group": {
                "kind": "build",
                "isDefault": true
            }
        }
    ]
}
Java Intellisense
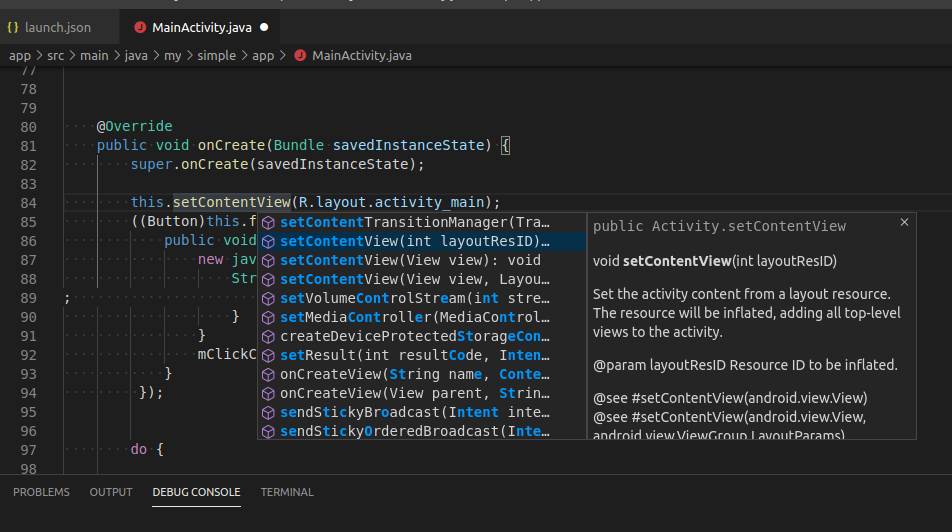
Support for Java Intellisense is currently in beta, so any feedback is appreciated.
To use Java intellisense, make sure the option is enabled in Settings (Extensions > Android > Enable Java language support for Android)
and press ctrl/cmd-space when editing a Java source file.
You can read more about using code-completion on the VSCode website and how to configure code-completion to suit your Android project in the wiki.
Expression evaluation
Format specifiers can be appended to watch and repl expressions to change how the evaluated result is displayed.
The specifiers work with the same syntax used in Visual Studio.
See https://docs.microsoft.com/en-us/visualstudio/debugger/format-specifiers-in-cpp for examples.
123              123
123,x            0x0000007b
123,xb           0000007b
123,X            0x0000007B
123,o            000000000173
123,b            0b00000000000000000000000001111011
123,bb           00000000000000000000000001111011
123,c            '{'
"one\ntwo"       "one\ntwo"
"one\ntwo",sb    one\ntwo
"one\ntwo",!     one
                 two
You can also apply the specifiers to object and array instances to format fields and elements:
arr,x            int[3]
   [0]           0x00000001
   [1]           0x00000002
   [1]           0x00000003
Note: Format specifiers for floating point values (e/g) and string encoding conversions (s8/su/s32) are not supported.
许可证与致谢 / License & Credits
本项目基于 adelphes/android-dev-ext fork,遵循 MIT License,原版权归 Copyright (c) 2017 Dave Holoway 所有,完整协议见 LICENSE。感谢原作者 Dave Holoway 创作并开源了这款优秀的扩展。本社区版由 Chenxin 维护。
This project is a community-maintained fork of adelphes/android-dev-ext under the MIT License (Copyright (c) 2017 Dave Holoway). Thanks to the original author Dave Holoway for creating the extension. Maintained by Chenxin.
Questions / Problems / 问题反馈
If you run into any problems, please open an issue on GitHub.
遇到问题请在 GitHub Issues 反馈。