UI Test Visualizer
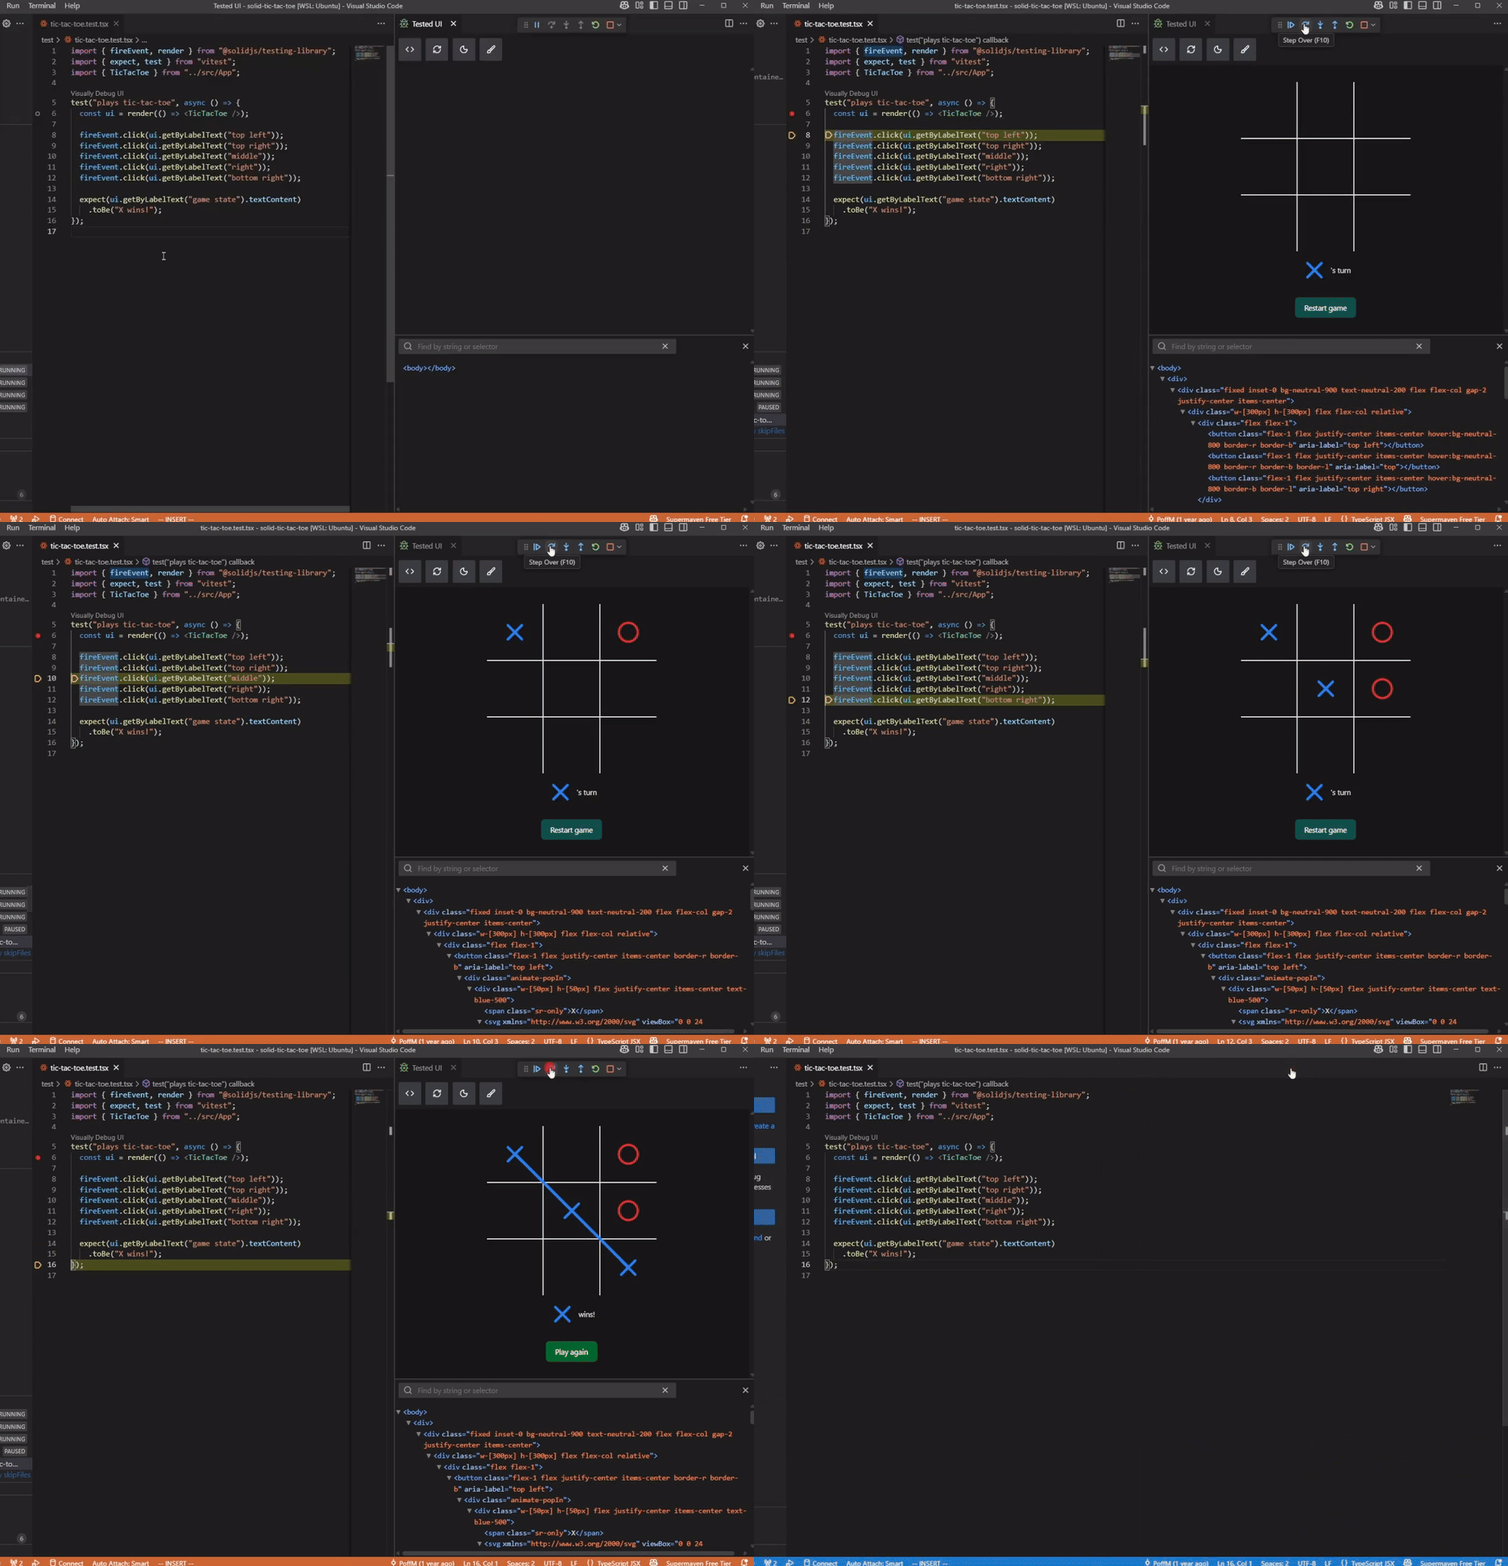
Visually step through your jsdom or happy-dom based UI tests with the debugger.
This is a VSCode extension: no code changes should be required to watch your UI tests.
Full Demo

Workspace Requirements
- Vitest or Jest v28+ or Bun Test Runner
- Your test framework is auto-detected by walking up the directories from your test file until it finds
vitest.config.{ts,js}, vite.config.{ts,js}, jest.config.{ts,js,json}, or bun.lock
- The Bun VSCode extension is required for Bun tests
- jsdom or happy-dom test environment (what you're probably already using for UI in Vitest or Jest)
Usage
Visualizing tests
Click the "Visually Debug UI" button above your test. If there's no breakpoint in your test already, the extension will add one automatically. A side panel should open, and render your UI as you step through with the debugger.
Demo Video
You can also write tests by recording your input as you interact with your UI.
Project Requirements:
- Test runner: Vitest, Jest, or Bun
- Testing libraries:
@testing-library/react or @solidjs/testing-library@testing-library/user-event
Steps:
Optional: Generate a starter test file for a React or Solid component by right-clicking the component name in the editor (e.g. MyForm) and clicking "Create UI test".
Click the "Visually Debug UI" button to start your test
Click "Step Over" until you get your UI into the state where you want to generate new code.
Click the "Record input as code" button in the side panel, and you'll see the recorder panel appear.
Click your UI elements, or change text inputs, and the extension will generate code for you to use in your test.
Right+click to generate expect statements or other mouse events.
The generated code is inserted into your test file when the test is ended or restarted.
UI Framework Compatibility
Since this extension hooks into the DOM API directly, you should be able to use any DOM-based UI framework, including React, Solid, Angular, Vue, Svelte, jQuery, etc.
Enabling Your Styles
Often UI tests run without the styles that would normally be in the <head> of your actual application. However, this extension's UI has a menu to manually enable any additional stylesheets.
Styles are converted from the source file to CSS depending on the source file extension. The supported types are:
- CSS
- Sass
- Scss
- Less
- Stylus
The supported post-processors are:
- Tailwind v4
- PostCSS (e.g. Tailwind v3)
This extension could fail to auto-build your source CSS files, in which case you could try pointing the extension to your built CSS files.
How It Works
Runs setup code before your test: This extension hooks a script to the beginning of your test process, adding listeners to mutable DOM method calls, like "appendChild", "removeChild", "setAttribute", etc.
The hooking point into the test depends on your test framework:
- Vitest:
- Adds a
--require argument to the Vitest command.
- Jest:
- Adds a
--setupFiles argument to the Jest command in addition to any setupFiles defined in your config.
- Bun:
- Adds a
--preload argument to the bun test command in addition to any preloads defined in your bunfig.toml.
Replicates the test DOM into a real DOM: The extension then replicates those method calls and their arguments in a VSCode WebView (the side panel), which renders your UI in a real Chromium DOM. This panel only shows a replica of the test DOM without your UI's Javascript, so you can't interact with it using the mouse or keyboard.
Caveats
- Possible de-synchronization: The visual DOM replica gets updated incrementally as your test runs, but accurate synchronization relies on this extension's code to correctly handle every possible DOM mutation that happens in your UI. The DOM replication code is pretty thorough, even accounting for weird cases involving nested Shadow DOMs and Web Component lifecycles, but it's still possible for the visual replica to get out of sync with your actual test DOM. If this happens, you can click the panel's Refresh button to re-sync it.
Contributing / Extension Development
See CONTRIBUTING.md


