Call Hierarchy Visualizer is a Visual Studio Code extension that visualizes function call relationships in your code. It provides an intuitive and aesthetically pleasing graphical interface to help developers understand the call structure of their code, improving code reading and comprehension efficiency.
Features
Bidirectional Call Relationship Visualization
Outgoing Calls: Shows which other functions are called by the current function
Incoming Calls: Shows which functions call the current function
Advanced Visualization Effects
Smooth Connection Lines: Uses curves to connect nodes, providing a more natural visual experience
Node Highlighting: Related nodes and connection lines are highlighted when hovering over a node
Frosted Glass Effect: Uses modern UI design for a premium visual experience
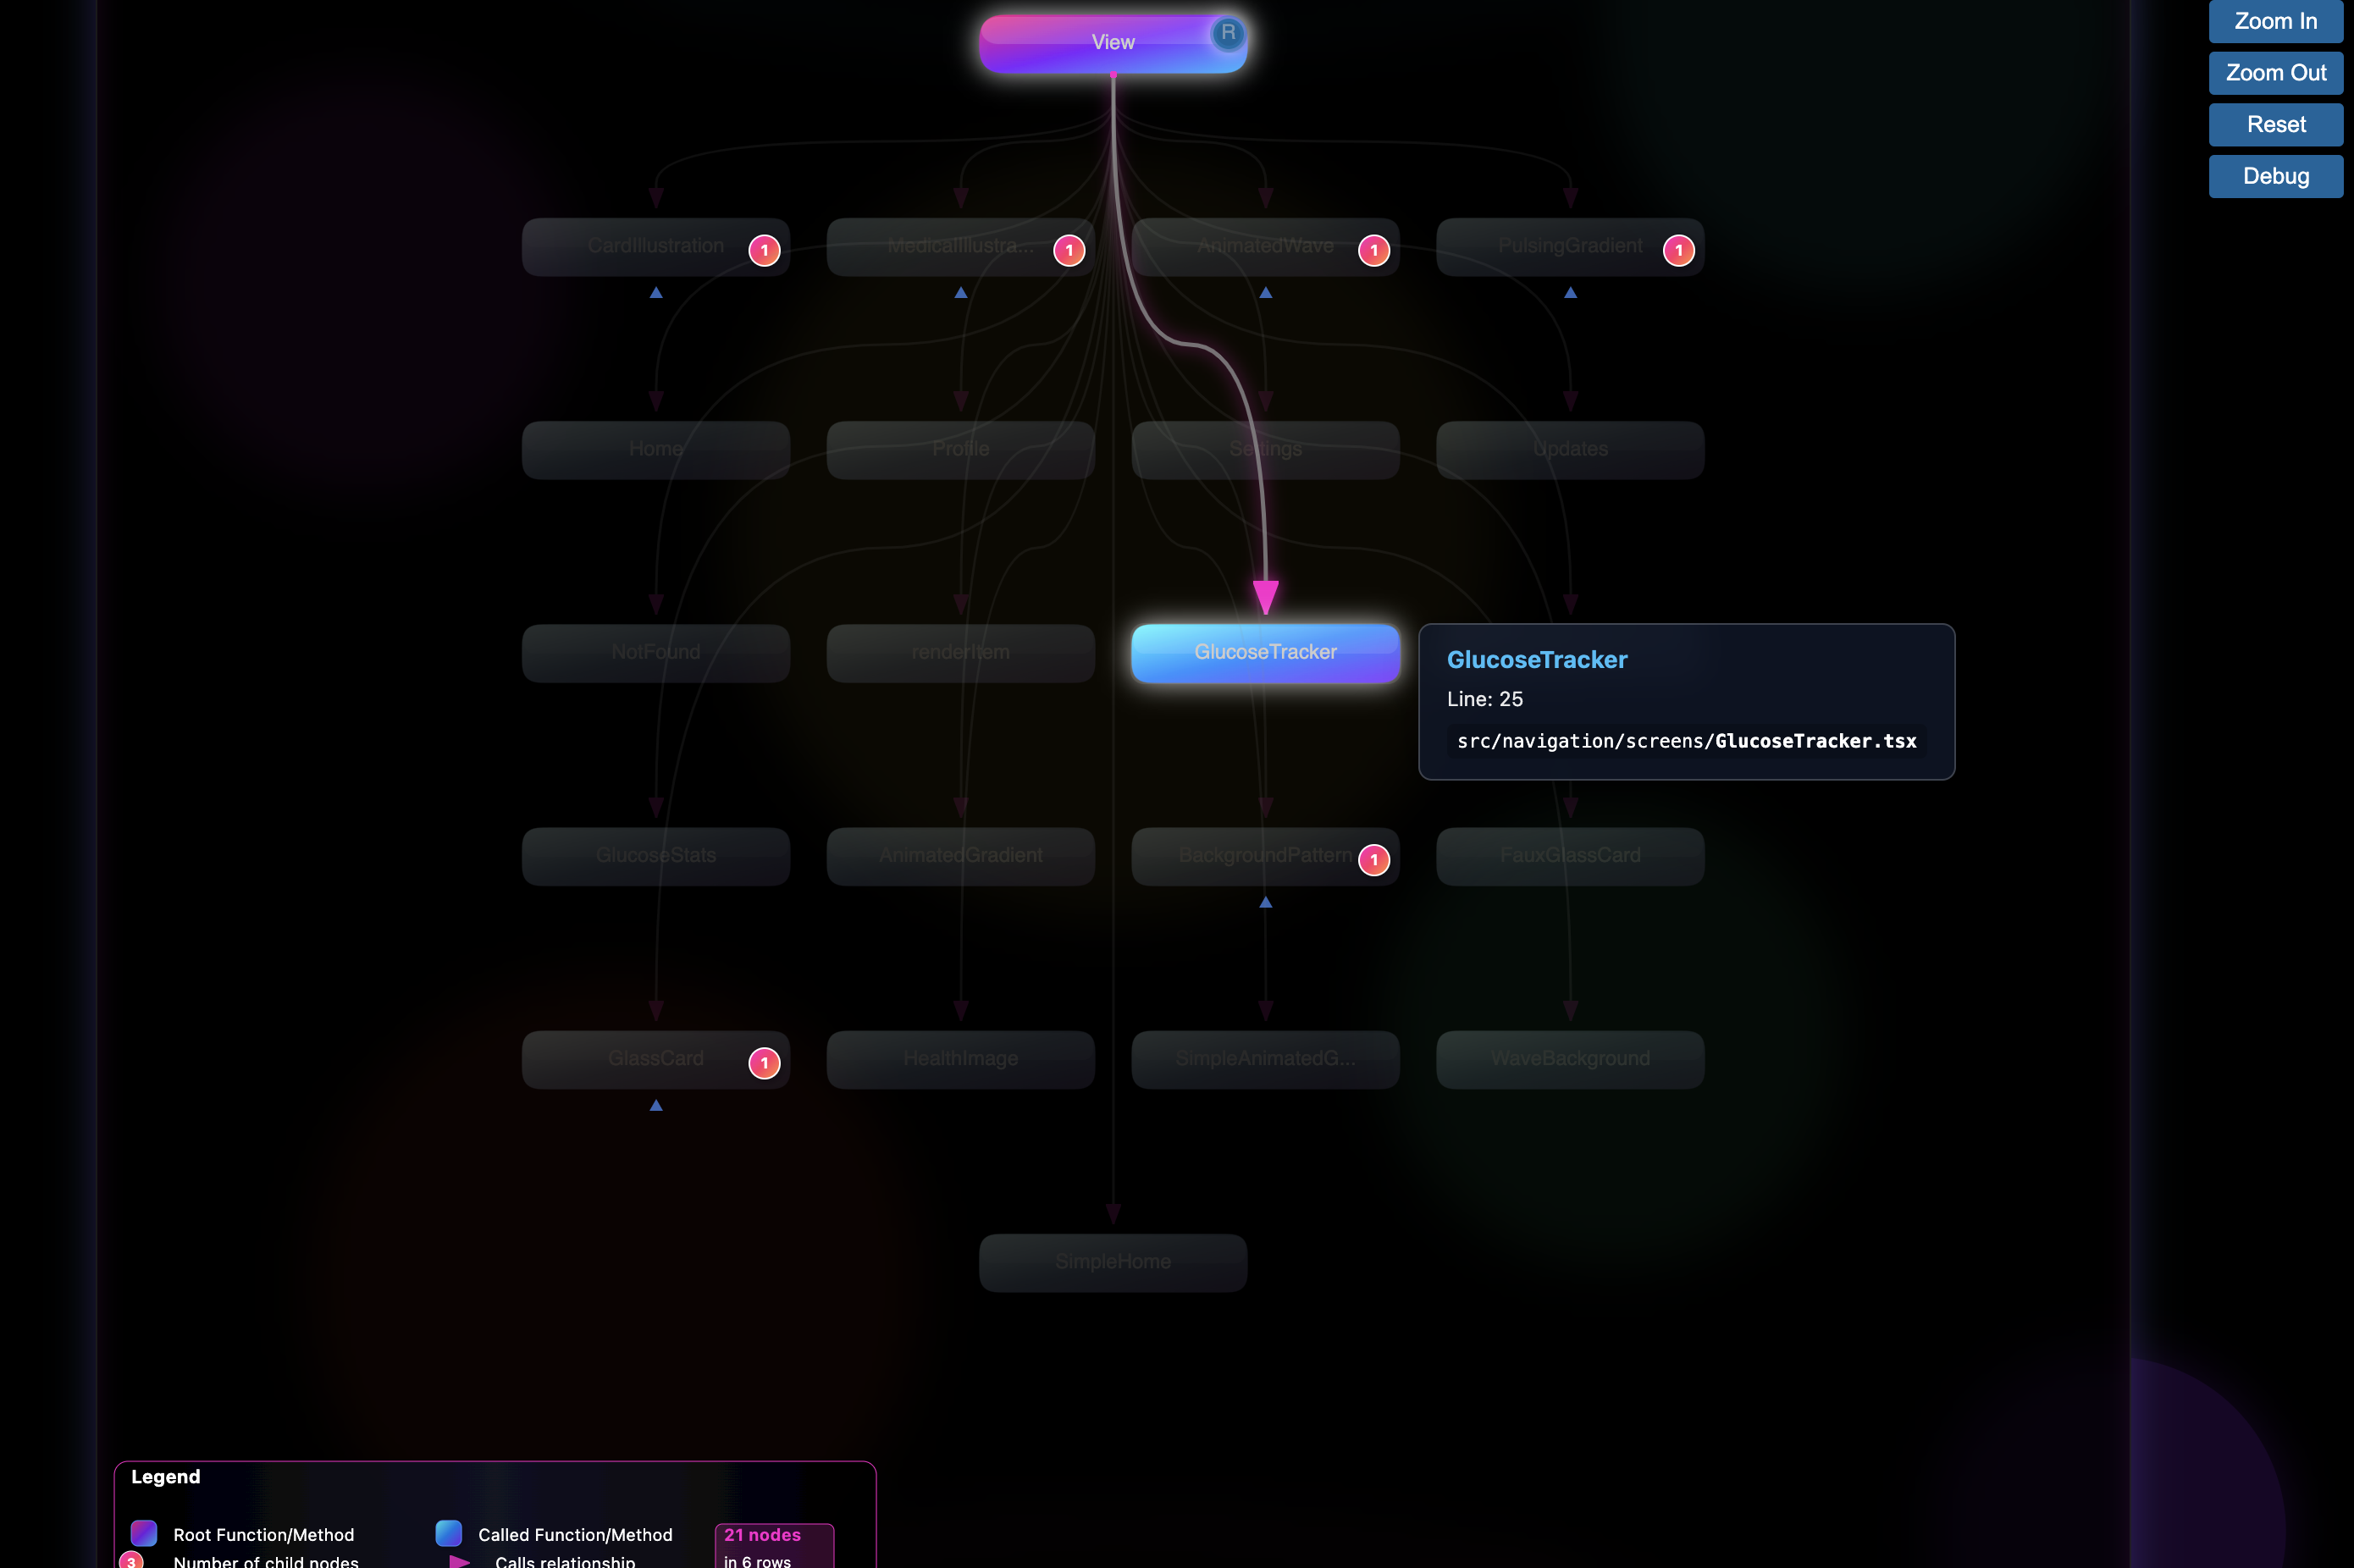
Node Click: Click on a node to navigate to the corresponding code location
Hover Tooltips: Hovering over a node displays detailed information, including function name, file path, and line number
Zoom Control: Supports zooming in, zooming out, and resetting the view
Debug Information: Provides a debug mode to display detailed call hierarchy data
How to Use
Select a Function or Method: In the code editor, place your cursor on the function or method you want to examine
Open Context Menu: Right-click on the selected function or method
Choose Visualization Option: From the context menu, select one of the following options:
Visualize Call Hierarchy... - Shows a selection dialog to choose between viewing outgoing or incoming calls
Visualize: Functions Called by This - Directly view functions called by the current function
Visualize: Functions Calling This - Directly view functions that call the current function
View Visualization: The extension will display a visualization of the call hierarchy in a new editor tab
Visualization Interface Guide
Node Types
Root Node: The currently selected function, with a gradient background
Child Nodes: Functions that are called (in outgoing mode) or caller functions (in incoming mode)
Connection Lines
Arrow Direction:
Outgoing Mode: Arrows point from the root node to child nodes, indicating "calls relationship"
Incoming Mode: Arrows point from child nodes to the root node, indicating "is called by relationship"
Control Buttons
Zoom In: Enlarge the view
Zoom Out: Shrink the view
Reset: Reset the view to its original size and position
Debug: Show/hide the debug information panel
Tips and Tricks
Node Interaction: The entire node area is clickable, not just the text part
Highlight Relationships: When hovering over a node, only directly related nodes (parent and child nodes) and connection lines are highlighted, not all nodes
Multi-row Layout: When there are many child nodes, they will be automatically arranged in multiple rows to maintain good readability
File Paths: Hover tooltips show only project-relative paths rather than full local file paths
System Requirements
Visual Studio Code 1.60.0 or higher
Languages that support call hierarchy (such as JavaScript, TypeScript, Java, C#, Python, etc.)
License
MIT
中文文档
简介
Call Hierarchy Visualizer 是一个 Visual Studio Code 扩展,用于可视化代码中的函数调用关系。它提供了一个直观、美观的图形界面,帮助开发者理解代码的调用结构,提高代码阅读和理解效率。