Skip to content
| Marketplace
Sign in
Visual Studio Code>Debuggers>Apex Debug Log ExplorerNew to Visual Studio Code? Get it now.
Apex Debug Log Explorer

Apex Debug Log Explorer

VarunPenna

|
8 installs
| (0) | Free
Explore Salesforce Apex debug logs with a local graph for Apex, triggers, Flow, DML, SOQL, async, callouts, email, and errors.
Installation
Launch VS Code Quick Open (Ctrl+P), paste the following command, and press enter.
Copied to clipboard
More Info

Apex Debug Log Explorer

Explore Salesforce Apex debug logs as an interactive execution graph inside VS Code. The extension is local-first: it reads the log file from your machine, renders the bundled graph experience in a VS Code webview, and does not upload debug log content.

Apex Debug Log Explorer execution graph

What It Does

  • Turns Salesforce .log and .txt debug logs into a clickable execution graph.
  • Shows Apex, triggers, Flow interviews, Flow elements, DML, SOQL, errors, Async Apex, email sends, and callouts in context.
  • Lets you click any node to inspect downstream execution, caller context, raw evidence, governor metrics, and exception details.
  • Groups DML, SOQL, errors, email sends, and callouts into indexes that jump to the exact graph node where each item happened.
  • Highlights repeated SOQL and DML patterns without flooding the graph with hundreds of duplicate nodes.
  • Keeps parsing local to VS Code. No Salesforce login, no org connection, and no server upload.

Why It Is Different

Salesforce debug logs are rich, but the raw text is hard to follow when a transaction moves through Apex, triggers, Flow, validation, automation, and downstream DML. This extension focuses on the architectural question you usually need to answer first:

What happened before this DML, SOQL, email, callout, or exception, and what did it trigger downstream?

Compared with table-first log viewers, this extension emphasizes:

  • graph-first cause-and-effect navigation
  • exact DML, SOQL, error, email, and callout indexes
  • Flow interview vs Flow element distinction
  • downstream expansion from any node
  • raw log evidence attached to the selected node
  • VS Code-native right-click and Command Palette flows

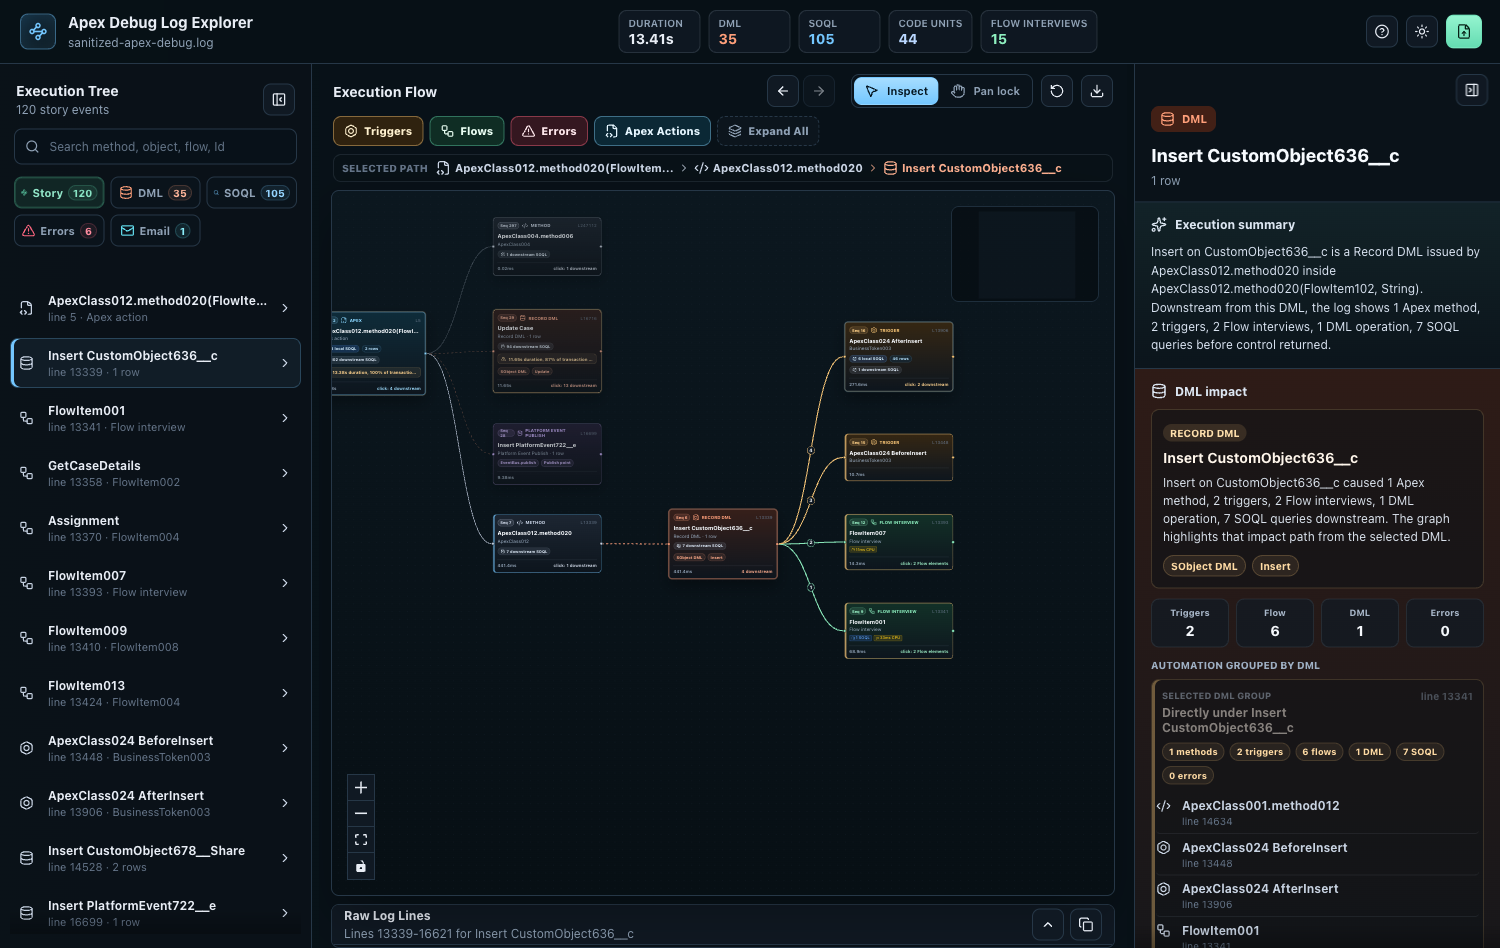
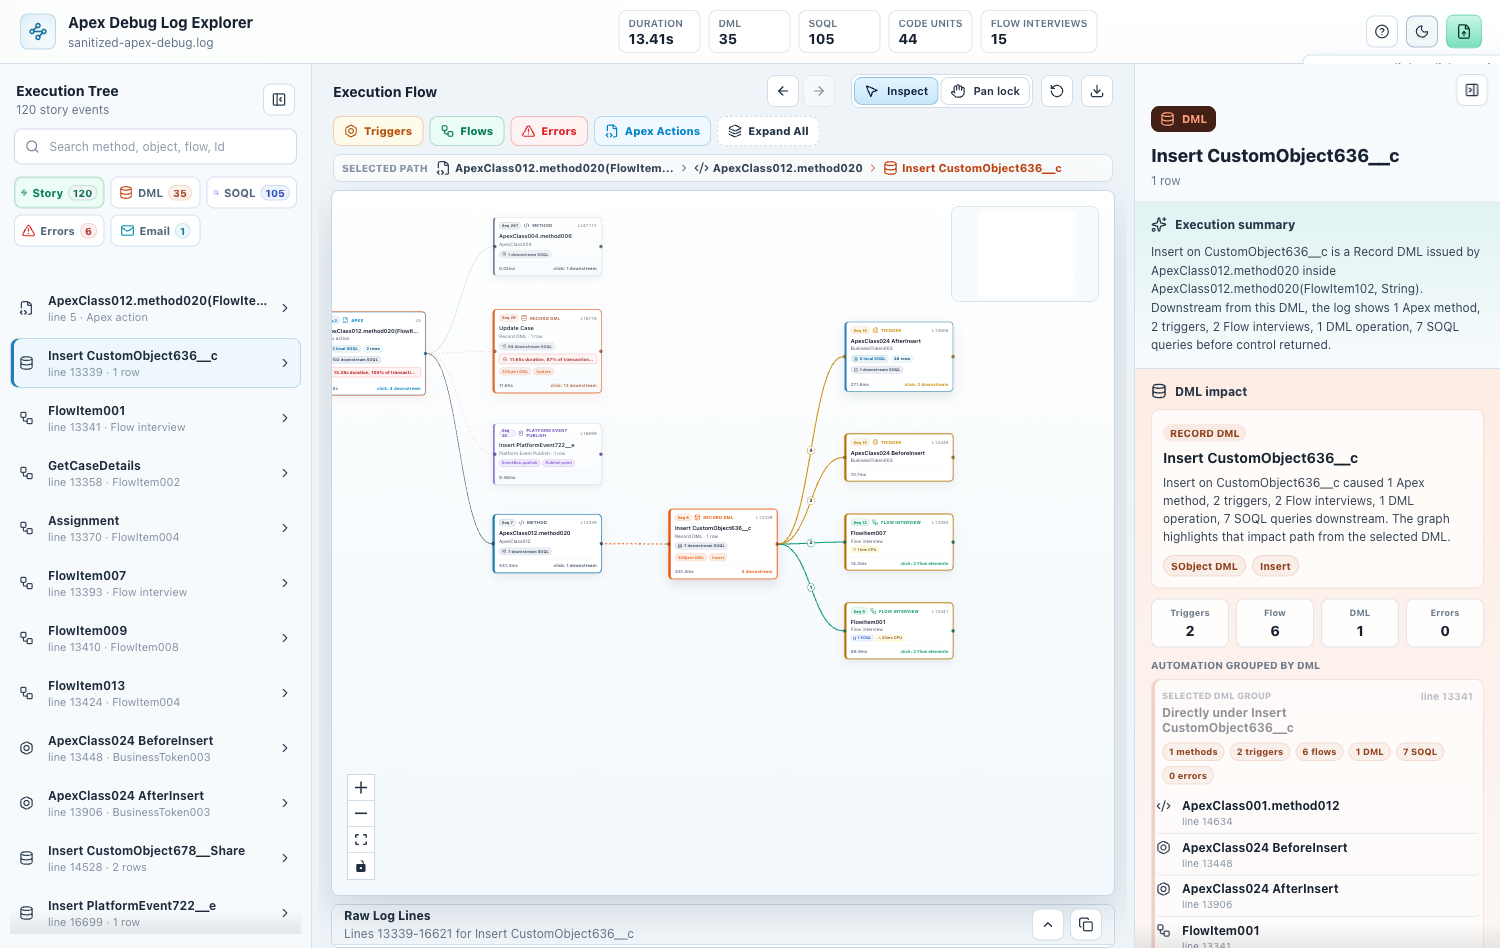
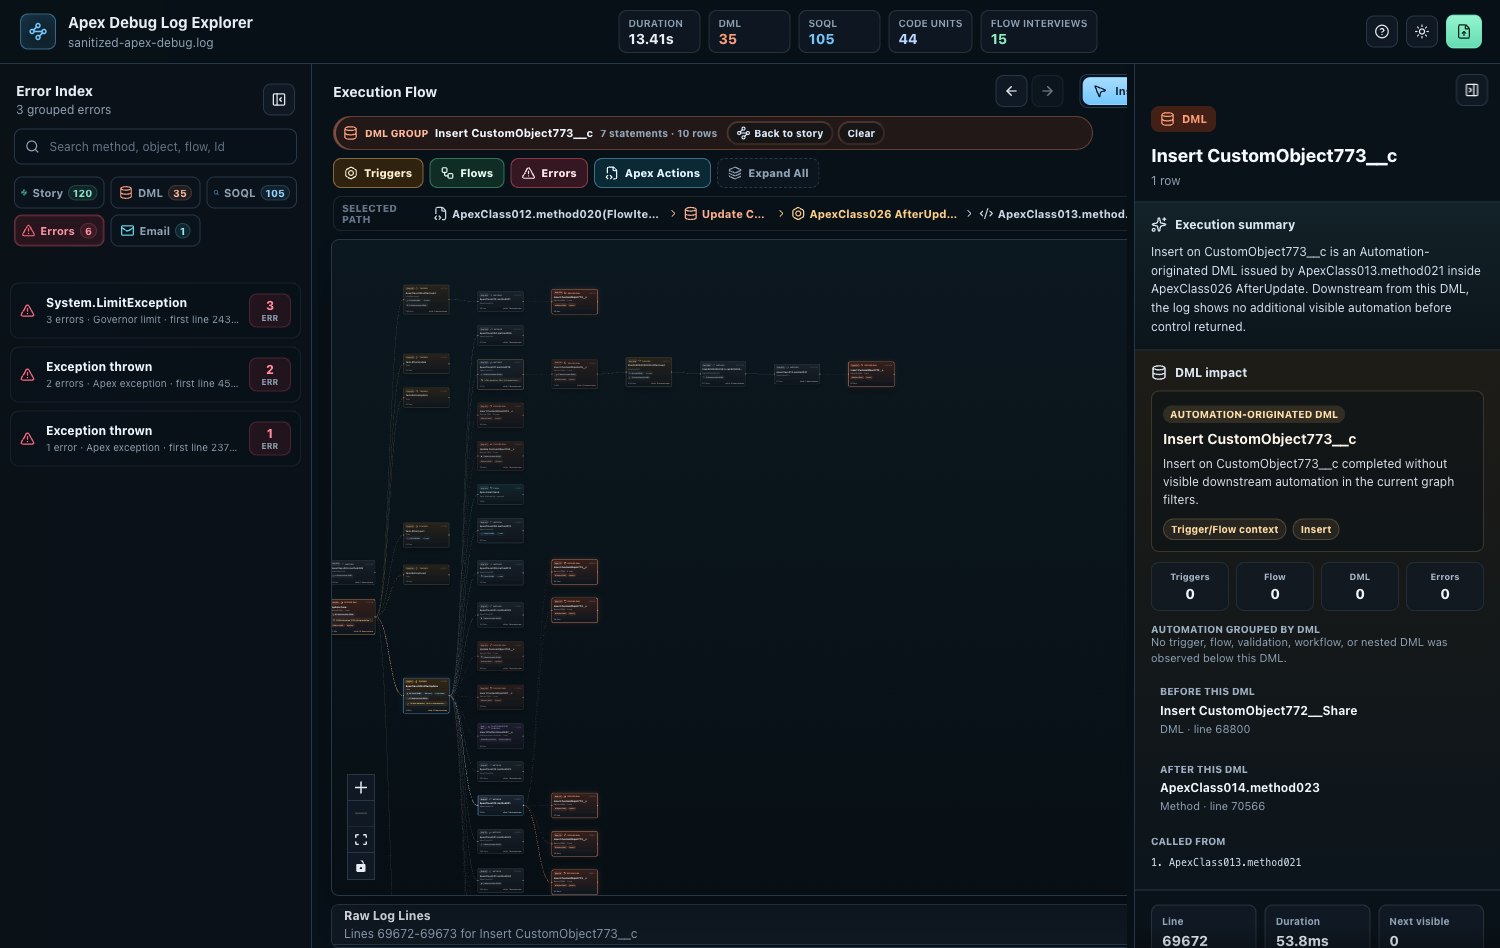
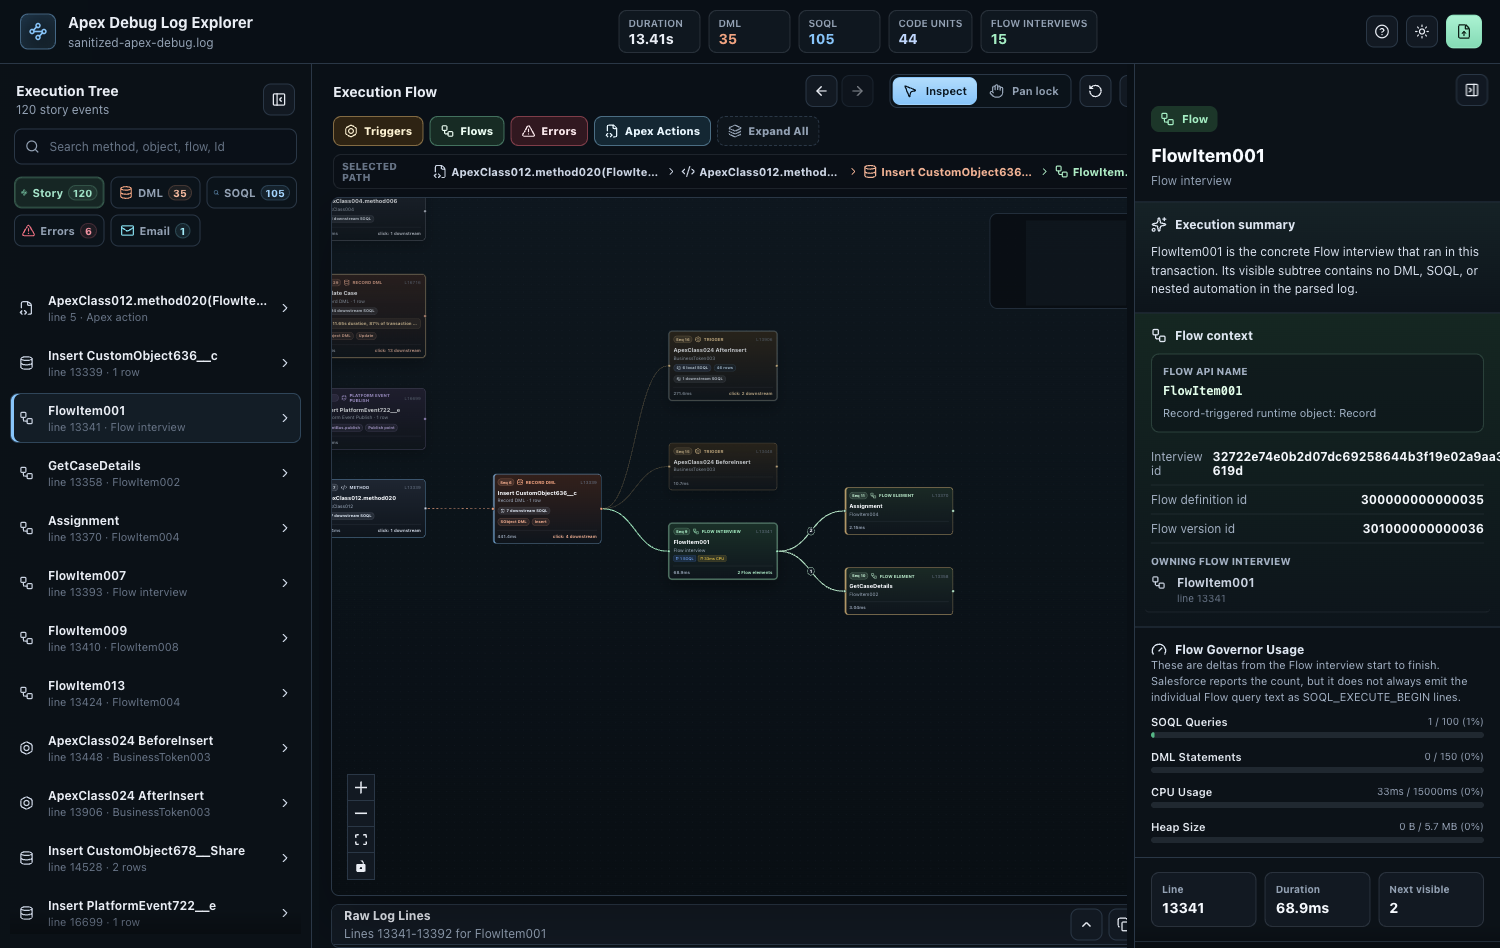
Compared with Apex Replay Debugger, this is not a breakpoint debugger. It is an after-the-fact transaction explorer for Salesforce debug logs that already exist.

Core Views

Execution Graph

Navigate the transaction visually. Expand downstream execution from the node you care about and keep context as you move through Apex, triggers, Flow, async work, DML, SOQL, and exceptions.
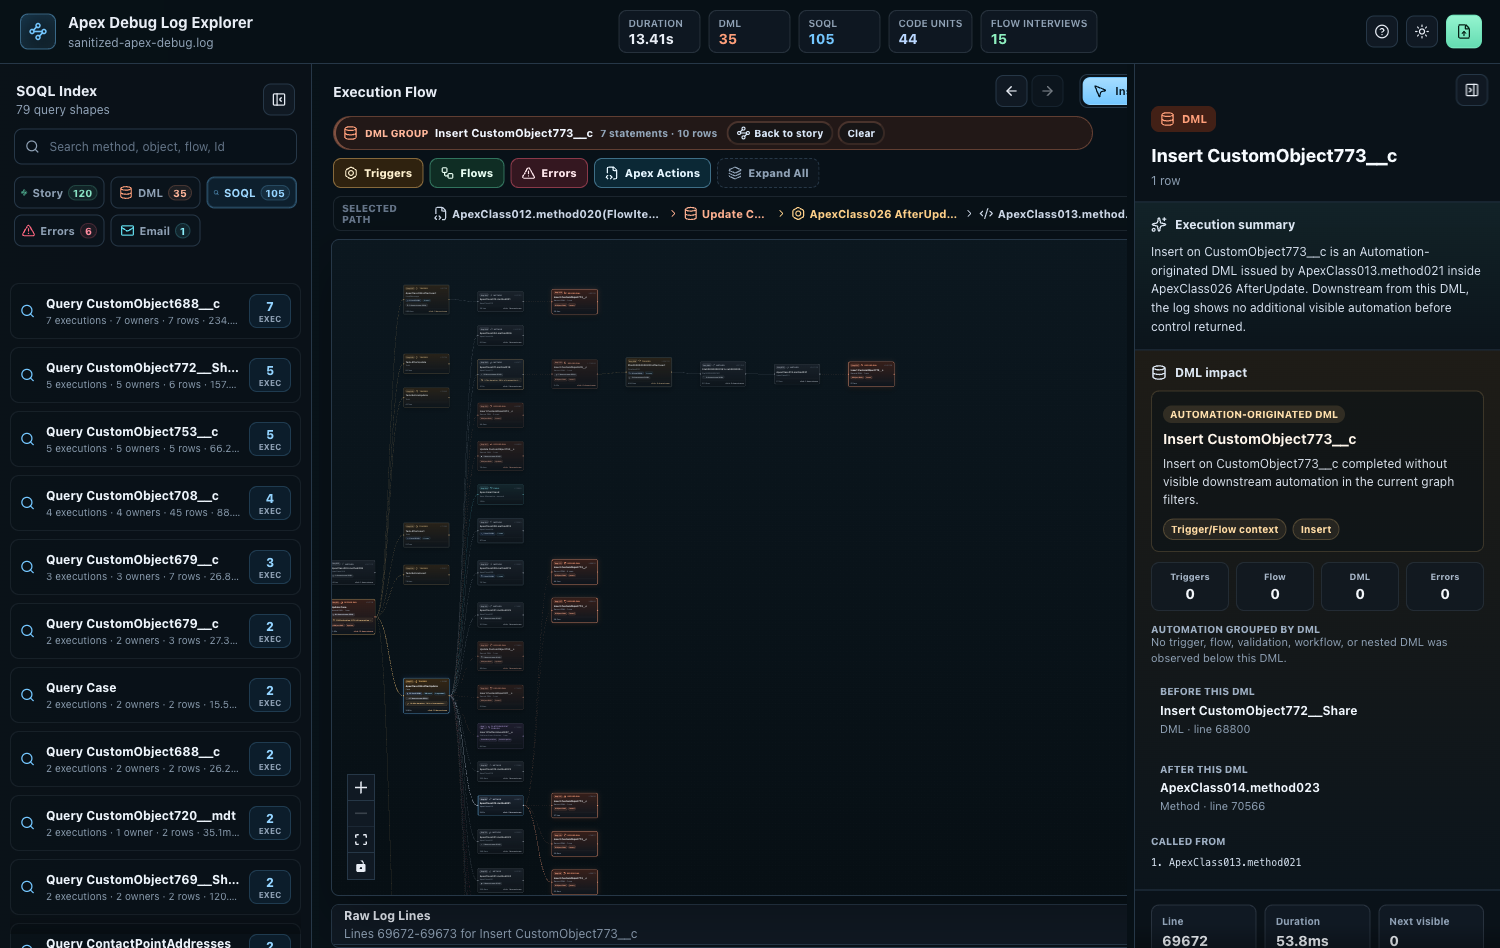
Execution graph light mode

SOQL Index

Find repeated queries, group identical SOQL, and jump back to every execution node where that query happened.
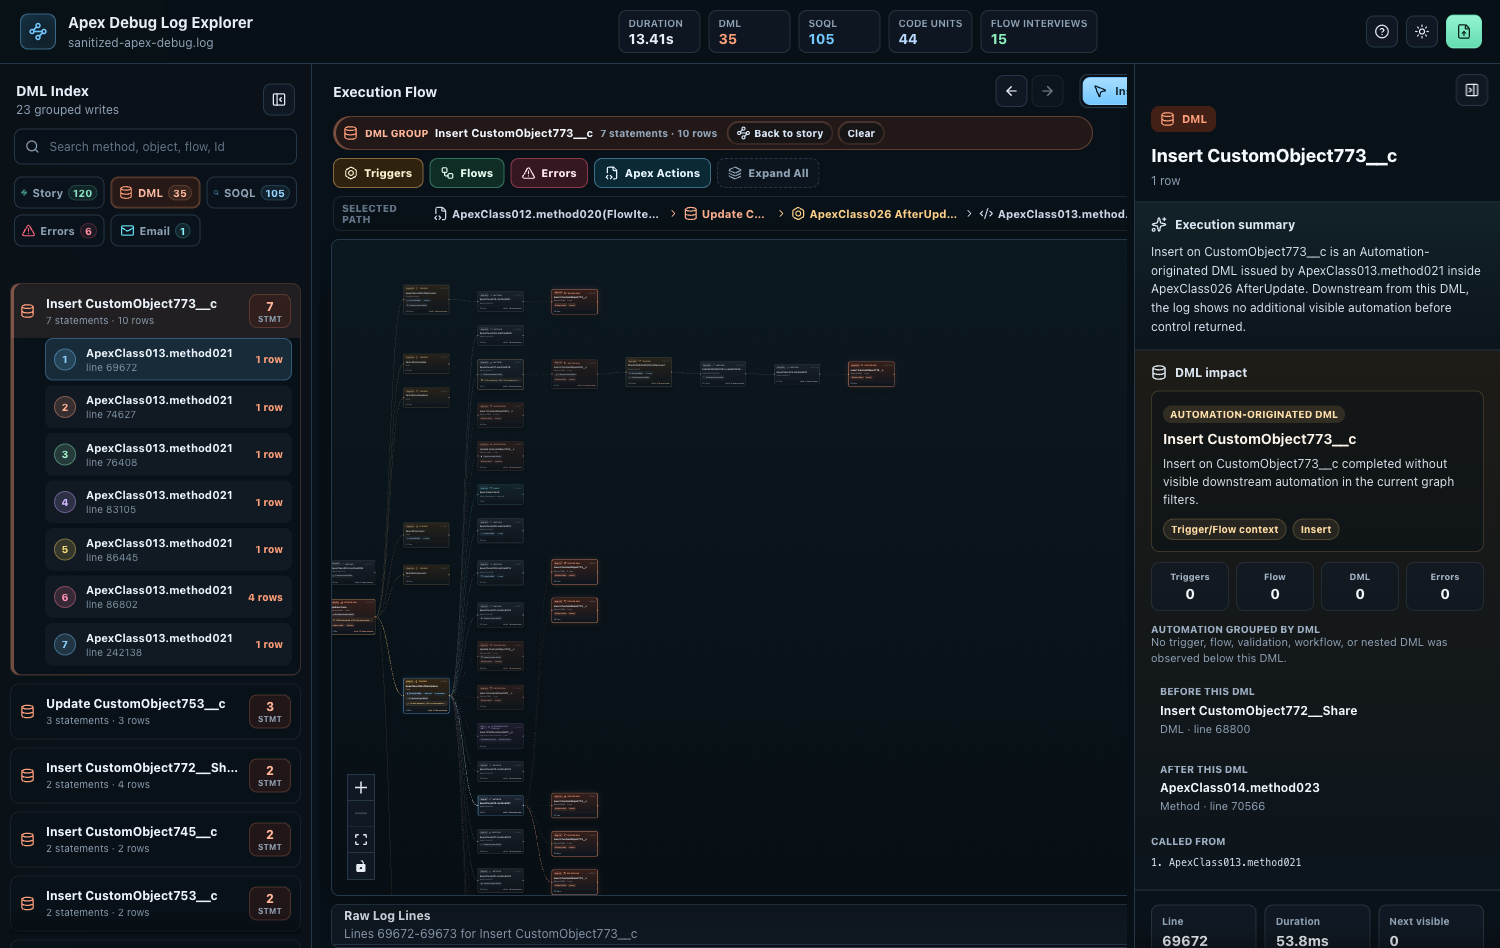
SOQL grouped index

DML Downstream

See which DML operation caused triggers, Flow interviews, validation, async work, or downstream automation.

DML downstream graph

Error Path

Open an error from the index, focus the exact node where it happened, and inspect exception details with raw evidence.

Error inspector

Flow Interviews And Elements

Separate the actual Flow interview from the individual Flow elements inside it, so the graph does not imply that runtime wrapper lines are meaningful business steps.

Flow interview and elements

Open A Log

  • Right-click a .log or .txt file in VS Code Explorer and choose Open with Apex Debug Log Explorer.
  • Right-click inside an open .log or .txt editor and choose Open with Apex Debug Log Explorer.
  • Run Apex Debug Log Explorer: Open Log from Command Palette.
  • Run Open with Apex Debug Log Explorer from Command Palette when a supported file is already open.

When the explorer opens, the extension automatically collapses the VS Code sidebar so the graph has more room.

Commands

  • Apex Debug Log Explorer: Open Log
  • Open with Apex Debug Log Explorer

Install From Marketplace

code --install-extension penna-vibe-code-apps.apex-debug-log-explorer

Install From VSIX

  1. Download apex-debug-log-explorer-<version>.vsix.
  2. Open VS Code.
  3. Run Extensions: Install from VSIX....
  4. Select the downloaded .vsix.
  5. Open a Salesforce debug .log or .txt file.
  6. Right-click inside the editor and choose Open with Apex Debug Log Explorer.
  7. You can also right-click the file in VS Code Explorer and choose Open with Apex Debug Log Explorer.
  8. Or run Apex Debug Log Explorer: Open Log from Command Palette.

Command-line install:

code --install-extension apex-debug-log-explorer-<version>.vsix

Privacy

The extension reads local files and renders the bundled webview locally. It does not upload debug log content to Salesforce, OpenAI, or any other service.

Known Limitations

  • The visualization depends on what Salesforce emitted in the debug log.
  • Truncated logs can omit downstream details.
  • This release does not include AI suggestions.
  • This release does not connect directly to Salesforce orgs.

Supported File Types

  • .log
  • .txt
  • Contact us
  • Jobs
  • Privacy
  • Manage cookies
  • Terms of use
  • Trademarks
© 2026 Microsoft