
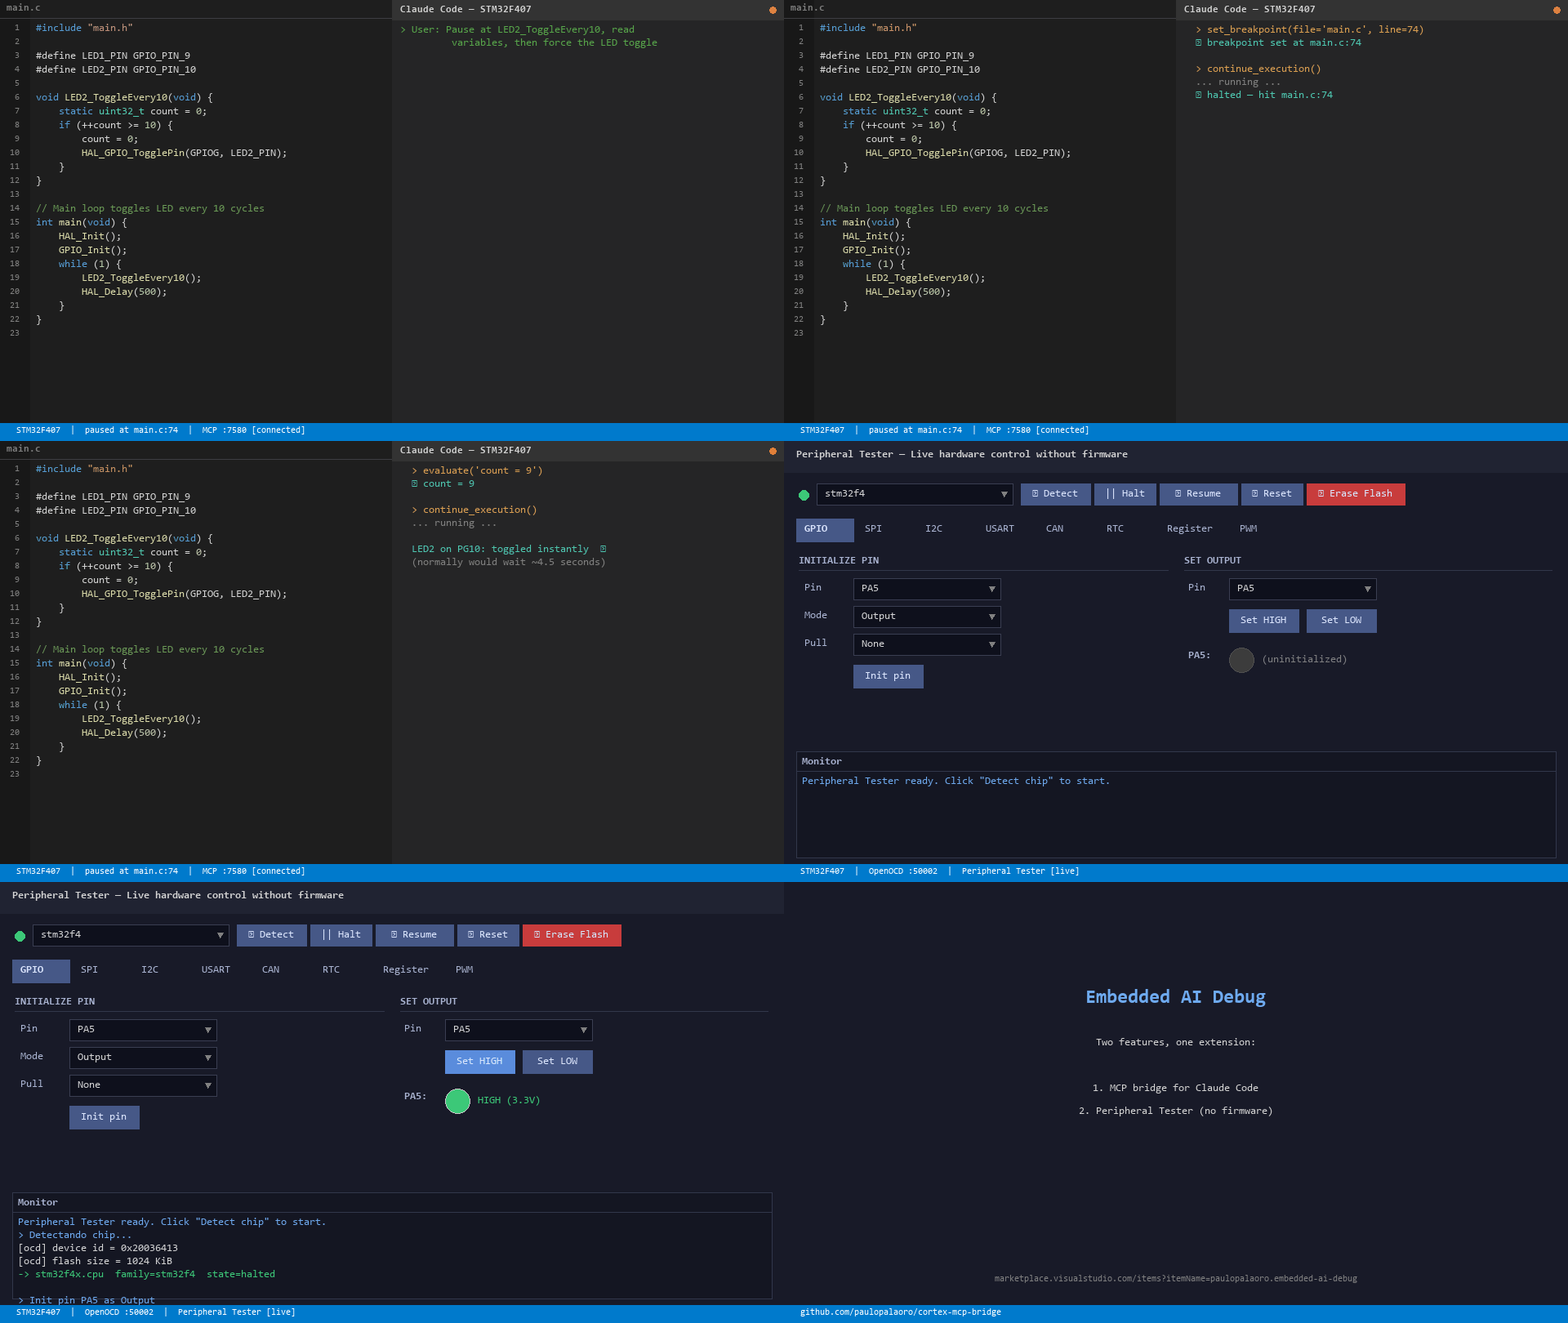
Embedded AI DebugAI-powered debug bridge for embedded systems — exposes a local MCP server so Claude Code and other AI tools can read live debug state (variables, registers, memory, call stack) from Cortex-Debug sessions. Installation Launch VS Code Quick Open ( Ctrl+P), paste the following command, and press enter.Copied to clipboard |

Embedded AI DebugA VSCode extension with two features for embedded development:
Quick Start
Available Commands (
|
| Command | Description |
|---|---|
| AI Debug: Start Bridge Server | Start the MCP server manually |
| AI Debug: Stop Bridge Server | Stop the MCP server |
| AI Debug: Show Server Status | Show current server status and port |
| AI Debug: Copy .mcp.json config to clipboard | Copy the MCP config snippet for your project |
| AI Debug: Open Peripheral Tester | Open the peripheral register tester UI (requires server running) |
| AI Debug: Reset Auto-Start Permission | Reset the auto-start permission dialog |
What it does
When you pause the target at a breakpoint, Claude Code can call these tools directly:
| Tool | Description |
|---|---|
get_session_info |
Check if a debug session is active and the target is paused |
get_call_stack |
Current call stack with file names and line numbers |
get_variables |
All local variables, arguments, globals in the current frame |
expand_variable |
Expand structs, arrays, and pointer children |
get_registers |
ARM core registers (r0–r12, SP, LR, PC, xPSR) |
get_memory |
Raw memory read at any address — shown as hex dump |
evaluate |
Evaluate any C/C++ expression (GDB watch syntax) |
set_breakpoint |
Set a source-level breakpoint programmatically |
pause_execution |
Halt the MCU |
continue_execution |
Resume MCU execution |
step |
Step over / into / out of current line |
gdb_command |
Raw GDB command passthrough (escape hatch) |
Requirements
- VSCode 1.85+
- Cortex-Debug or PlatformIO IDE
- Claude Code (or any MCP-compatible client)
- An ST-Link, J-Link, or CMSIS-DAP probe connected to your target
Installation
Option A — Build from source
git clone https://github.com/your-org/cortex-mcp-bridge
cd cortex-mcp-bridge
npm install
npm run build
npm run package         # creates cortex-mcp-bridge-0.1.0.vsix
code --install-extension cortex-mcp-bridge-0.1.0.vsix
Option B — Install from VSIX
Download the .vsix from the Releases page and run:
code --install-extension cortex-mcp-bridge-0.1.0.vsix
Setup
1. Create .mcp.json in your project root
{
  "mcpServers": {
    "cortex-debug": {
      "type": "sse",
      "url": "http://localhost:7580/sse"
    }
  }
}
Tip: Run
Ctrl+Shift+P→ AI Debug: Copy .mcp.json config to clipboard to generate this snippet automatically with the correct port.
2. Start a debug session
The extension starts the MCP server automatically when a Cortex-Debug or PlatformIO debug session begins. You can also start it manually via:
Ctrl+Shift+P → AI Debug: Start Bridge Server
3. Verify
Check the status bar — it shows $(debug-alt) MCP :7580 when the server is running.
Open a browser and visit http://localhost:7580/health — you should see {"status":"ok"}.
Usage with Claude Code
Once connected, Claude Code can interact with your hardware directly. Examples:
"What are the current values of pitch, roll, and yaw_rate?"
→ Claude calls get_variables → reads live RAM values

"Read 16 bytes from rxBuf"
→ Claude calls evaluate("&rxBuf[0]") to get address, then get_memory

"Set a breakpoint at line 59 of main.cpp and continue"
→ Claude calls set_breakpoint + continue_execution

"Step through the loop 5 times and report how rxLen changes"
→ Claude calls step + get_variables in a loop
Settings
| Setting | Default | Description |
|---|---|---|
embeddedAiDebug.port |
7580 |
Preferred TCP port. Auto-increments if busy. |
embeddedAiDebug.autoStart |
true |
Start server automatically when a debug session begins |
embeddedAiDebug.logLevel |
"info" |
Log verbosity: "off", "info", "debug" |
Architecture
extension.ts          — VSCode lifecycle, commands, status bar
mcpServer.ts          — HTTP server with SSE transport (MCP protocol)
dapBridge.ts          — All DAP calls via vscode.debug.activeDebugSession
tools/
  getSessionInfo.ts   — Session status check
  getCallStack.ts     — stackTrace DAP request
  getVariables.ts     — scopes + variables DAP requests
  expandVariable.ts   — variables (children) DAP request
  getRegisters.ts     — read-registers (Cortex-Debug custom)
  getMemory.ts        — read-memory (Cortex-Debug custom)
  evaluate.ts         — evaluate DAP request
  setBreakpoint.ts    — setBreakpoints DAP request
  continueExecution   — continue DAP request
  pauseExecution      — pause DAP request
  stepOver.ts         — next / stepIn / stepOut DAP requests
  gdbCommand.ts       — execute-command (Cortex-Debug custom)
Limitations
- Most tools require the target to be paused (halted at a breakpoint or manually paused). The Cortex-Debug adapter rejects read requests while the MCU is running.
- The
get_registersandget_memorytools use Cortex-Debug custom DAP commands — they work withcortex-debugandplatformio-debugsession types only. - Tested with STM32 targets. Should work with any ARM Cortex-M target supported by Cortex-Debug.
License
MIT