Cortex-Debug AIAI-powered companion for embedded debugging — extends Cortex-Debug with an MCP server so Claude Code and other AI tools can read live state (variables, registers, memory) and drive peripherals (GPIO, SPI, I2C, USART, CAN, RTC, PWM) via GDB/MI. Installation Launch VS Code Quick Open ( Ctrl+P), paste the following command, and press enter.Copied to clipboard |
Cortex-Debug AI
A VSCode extension with two AI-focused features for embedded development:
Quick Start
Available Commands (
|
| Command | Description |
|---|---|
| AI Debug: Start Bridge Server | Start the MCP server manually |
| AI Debug: Stop Bridge Server | Stop the MCP server |
| AI Debug: Show Server Status | Show current server status and port |
| AI Debug: Copy .mcp.json config to clipboard | Copy the MCP config snippet for your project |
| AI Debug: Open Peripheral Tester | Open the peripheral register tester UI (requires server running) |
| AI Debug: Reset Auto-Start Permission | Reset the auto-start permission dialog |
What it does
When you pause the target at a breakpoint, Claude Code can call these tools directly:
| Tool | Description |
|---|---|
get_session_info |
Check if a debug session is active and the target is paused |
get_call_stack |
Current call stack with file names and line numbers |
get_variables |
All local variables, arguments, globals in the current frame |
expand_variable |
Expand structs, arrays, and pointer children |
get_registers |
ARM core registers (r0–r12, SP, LR, PC, xPSR) |
get_memory |
Raw memory read at any address — shown as hex dump |
evaluate |
Evaluate any C/C++ expression (GDB watch syntax) |
set_breakpoint |
Set a source-level breakpoint programmatically |
pause_execution |
Halt the MCU |
continue_execution |
Resume MCU execution |
step |
Step over / into / out of current line |
gdb_command |
Raw GDB command passthrough (escape hatch) |
Requirements
- VSCode 1.85+
- Cortex-Debug or PlatformIO IDE
- Claude Code (or any MCP-compatible client)
- An ST-Link, J-Link, or CMSIS-DAP probe connected to your target
Installation
Option A — Build from source
git clone https://github.com/paulopalaoro/cortex-mcp-bridge
cd cortex-mcp-bridge
npm install
npm run build
npm run package         # creates embedded-ai-debug-x.y.z.vsix
code --install-extension embedded-ai-debug-x.y.z.vsix
Option B — Install from VSIX
Download the .vsix from the Releases page and run:
code --install-extension embedded-ai-debug-x.y.z.vsix
Setup
1. Create .mcp.json in your project root
{
  "mcpServers": {
    "cortex-debug": {
      "type": "sse",
      "url": "http://localhost:7580/sse"
    }
  }
}
Tip: Run
Ctrl+Shift+P→ AI Debug: Copy .mcp.json config to clipboard to generate this snippet automatically with the correct port.
2. Start a debug session
The extension starts the MCP server automatically when a Cortex-Debug or PlatformIO debug session begins. You can also start it manually via:
Ctrl+Shift+P → AI Debug: Start Bridge Server
3. Verify
Check the status bar — it shows $(debug-alt) MCP :7580 when the server is running.
Open a browser and visit http://localhost:7580/health — you should see {"status":"ok"}.
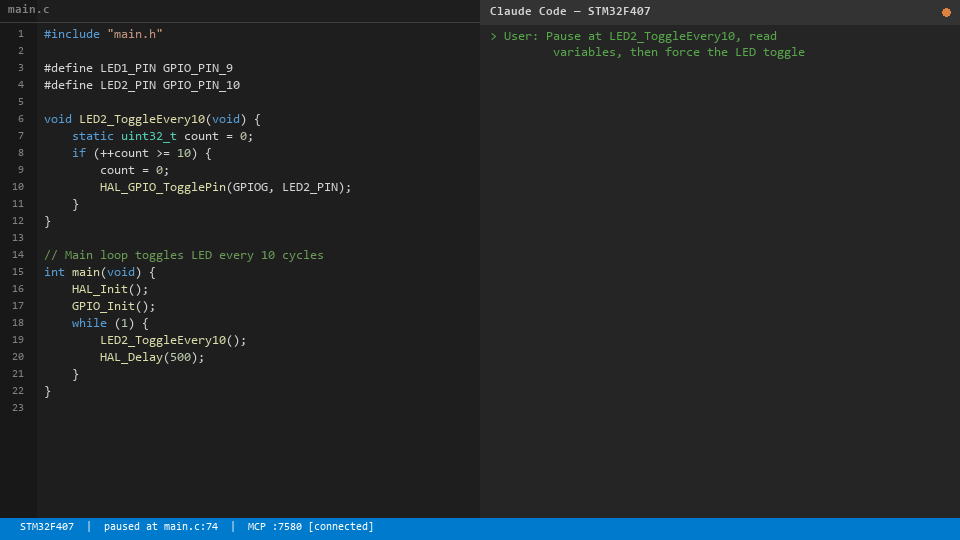
Usage with Claude Code
Once connected, Claude Code can interact with your hardware directly. Examples:
"What are the current values of pitch, roll, and yaw_rate?"
→ Claude calls get_variables → reads live RAM values

"Read 16 bytes from rxBuf"
→ Claude calls evaluate("&rxBuf[0]") to get address, then get_memory

"Set a breakpoint at line 59 of main.cpp and continue"
→ Claude calls set_breakpoint + continue_execution

"Step through the loop 5 times and report how rxLen changes"
→ Claude calls step + get_variables in a loop
Settings
| Setting | Default | Description |
|---|---|---|
embeddedAiDebug.port |
7580 |
Preferred TCP port. Auto-increments if busy. |
embeddedAiDebug.autoStart |
true |
Start server automatically when a debug session begins |
embeddedAiDebug.logLevel |
"info" |
Log verbosity: "off", "info", "debug" |
Architecture
extension.ts          — VSCode lifecycle, commands, status bar
mcpServer.ts          — HTTP server with SSE transport (MCP protocol)
dapBridge.ts          — All DAP calls via vscode.debug.activeDebugSession
tools/
  getSessionInfo.ts   — Session status check
  getCallStack.ts     — stackTrace DAP request
  getVariables.ts     — scopes + variables DAP requests
  expandVariable.ts   — variables (children) DAP request
  getRegisters.ts     — read-registers (Cortex-Debug custom)
  getMemory.ts        — read-memory (Cortex-Debug custom)
  evaluate.ts         — evaluate DAP request
  setBreakpoint.ts    — setBreakpoints DAP request
  continueExecution   — continue DAP request
  pauseExecution      — pause DAP request
  stepOver.ts         — next / stepIn / stepOut DAP requests
  gdbCommand.ts       — execute-command (Cortex-Debug custom)
Limitations
- Most tools require the target to be paused (halted at a breakpoint or manually paused). The Cortex-Debug adapter rejects read requests while the MCU is running.
- The
get_registersandget_memorytools use Cortex-Debug custom DAP commands — they work withcortex-debugandplatformio-debugsession types only. - Tested with STM32 targets. Should work with any ARM Cortex-M target supported by Cortex-Debug.
Credits & Acknowledgments
Cortex-Debug AI stands on the shoulders of giants. In particular:
- Cortex-Debug by Marcel Ball and contributors — this project's foundation. Cortex-Debug AI extends Cortex-Debug's architecture and re-uses adapted portions of its GDB/MI backend code. See NOTICE for the full MIT licence text and attribution.
- OpenOCD — the open-source on-chip debugger.
- PlatformIO — development environment that makes STM32 accessible.
- Model Context Protocol by Anthropic — the protocol that lets Claude Code speak to external debug state.
If you appreciate this extension, please also star Cortex-Debug — none of this would exist without their work.
License
MIT — see LICENSE.txt.
This project includes code derived from Cortex-Debug (MIT, © Marcel Ball). See NOTICE for the full attribution.