Flutter Log Explorer

Structured Capture, Smart Classification & Real-Time Log Explorer for Flutter & Dart in VS Code





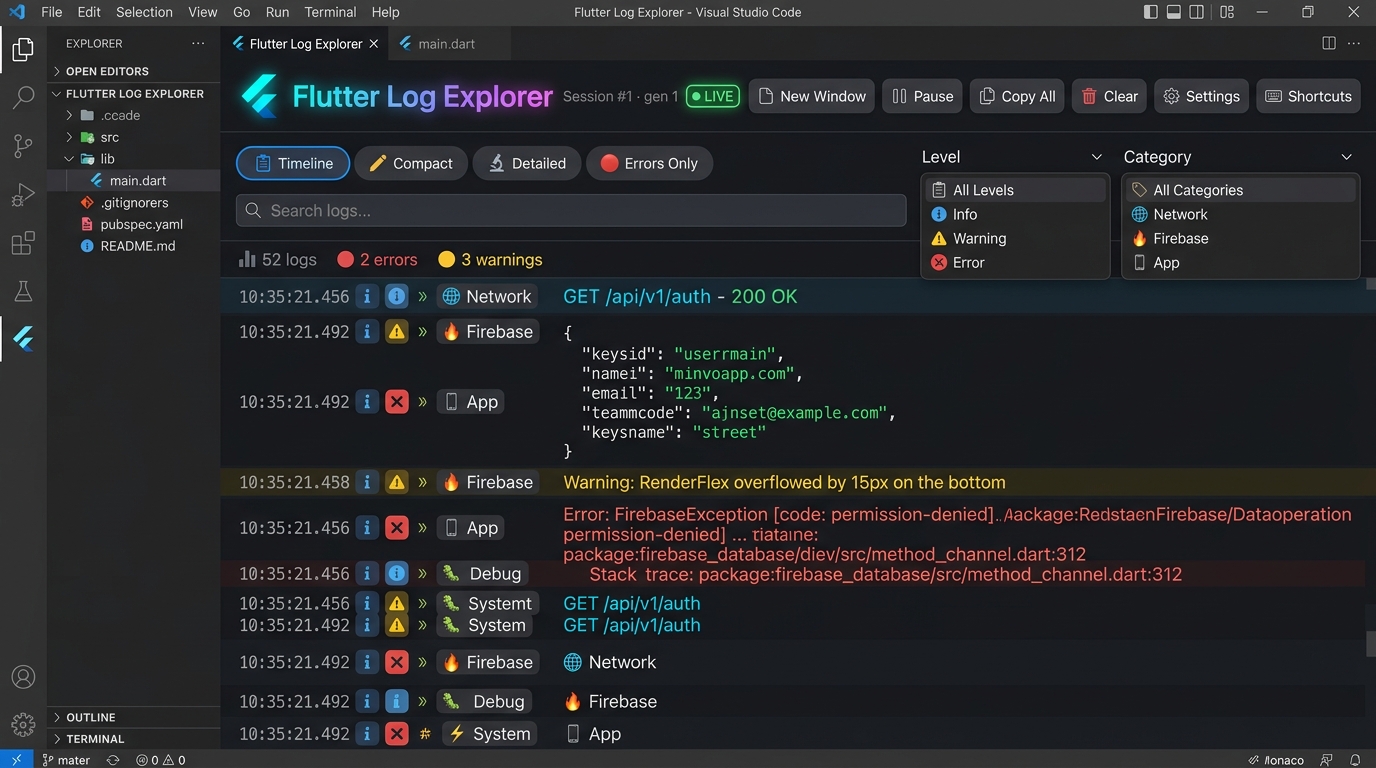
🚀 Overview
Flutter Log Explorer is a high-performance VS Code extension designed to replace the messy, unstructured, and noisy Debug Console when developing Flutter and Dart applications.
It automatically captures logs via both the Debug Adapter Protocol (DAP) and the Dart VM Service WebSocket, intelligently reassembles fragmented output chunks, deduplicates overlapping streams, and presents your logs in an interactive, color-coded, real-time viewer right in your VS Code Activity Bar.
✨ Why Flutter Log Explorer?
| Feature |
Default Debug Console |
Flutter Log Explorer |
dart:developer log() support |
⚠️ Often stripped or missing |
✅ Captured in full via VM Service |
| Output Chunk Reassembly |
❌ Chunks can break mid-line |
✅ Multi-chunk LineBuffer normalization |
| Log Classification |
❌ Flat monochrome text |
✅ Automatic ERROR, WARN, INFO, NETWORK, FIREBASE, NAV |
| Stream Controls |
❌ Uncontrolled auto-scrolling |
✅ Pause/Resume, Scroll-Lock, "↓ New logs" pill |
| Hot Reload / Restart Tracking |
❌ Blended output stream |
✅ Generational awareness (Hot Reload vs Hot Restart) |
| Memory & Performance |
⚠️ Can freeze on heavy loops |
✅ Configurable ring-buffer store (default 50,000 logs) |
| Privacy & Security |
✅ Local |
✅ 100% Local-first, zero telemetry, zero cloud calls |
⚡ Quick Start (1-Minute Setup)
1. Requirements
2. Usage
- Open any Flutter project in VS Code.
- Click the Flutter Log Explorer icon on the Activity Bar (left sidebar).
- Press F5 to start debugging your Flutter app as usual.
- Watch structured, classified logs stream in real-time!
import 'dart:developer' as developer;

// Standard prints
print("User logged in successfully");

// Rich structured logs (captured via Dart VM Service)
developer.log(
  "Failed to fetch user profile",
  name: "auth.service",
  level: 1000, // Mapped automatically to ERROR
  error: Exception("401 Unauthorized"),
);
🔍 Key Features
📡 Zero-Config Dual-Collector Engine
Captures logs simultaneously from:
- Debug Adapter Protocol (DAP): Intercepts stdout, stderr, process output, and framework diagnostic events.
- Dart VM Service WebSocket: Connects directly to the Dart VM Service to capture
dart:developer log() entries with custom levels, logger names, error objects, and stack traces.
🏷️ Compact Icons & Intelligent Classification
Logs are analyzed and tagged with space-saving, recognizable icons with full hover tooltips:
- ❌ ERROR / 💀 FATAL: Unhandled exceptions, error objects, 5xx responses, RenderFlex errors.
- ⚠️ WARNING: Deprecations, framework alerts, 4xx responses.
- ℹ️ INFO / 🐛 DEBUG / 🔍 TRACE: Standard
print(), debugPrint(), fine-grained debug events.
- 🌐 NETWORK / ⚡ API: HTTP / REST / GraphQL queries, status codes, endpoints.
- 🧭 NAVIGATION: Route changes, push/pop events, deep links.
- 🔥 FIREBASE: Authentication, Firestore, Remote Config, Analytics logs.
- 💾 DATABASE / 🔐 AUTH / 🔄 STATE / 🎨 UI / 💙 FLUTTER / 🎯 DART / ⚙️ SYSTEM / ⏱️ PERFORMANCE: Full ecosystem coverage with custom dynamic category support.
🎨 Fully Customizable Display Settings
Press Cmd+, / Ctrl+, or click ⚙ Settings to open the live-preview display settings panel:
- Font Size: Ultra-compact
9px by default, customizable from 6px to 24px.
- Line & Row Spacing:
1.0× by default (tight row packing with zero wasted space) up to 3.0× for spacious viewing.
- Cross-Platform Fonts: Native font stacks for VS Code Editor Font, Menlo / SF Mono (macOS), Consolas (Windows), Cascadia Code / Mono, Fira Code, JetBrains Mono, Courier New, Inter / Modern Sans, System UI, and Rounded Trebuchet.
- Themes & Coloring: Dark Glow, GitHub Dark, Tokyo Night, Monokai Pro, Solarized Dark, Cyberpunk 2077, Forest Emerald, Rose Pine, VS Code Light, Nord Frost, and more.
- Layout Toggles: Wrap long lines, toggle timestamps, alternate zebra stripes, and buffer limits.
🛡️ Smart Deduplication & Chunk Assembly
When the same log line is emitted through both DAP and the VM Service, the built-in Deduplicator matches and suppresses the duplicate within a 1.5s sliding window while preserving naturally repeating application logs.
⏸️ Interactive Stream Controls & Clean Copying
- Pause / Resume: Freeze the live view to inspect logs while the background collector continues buffering.
- Auto-Scroll Lock: Scrolling up locks the view; a "↓ New logs" pill alerts you when new lines arrive.
- Clear Logs: Instant reset of buffer and counters.
- ⛶ Full Window: Return and dock the viewer as a full editor tab inside the main VS Code window.
- 🗗 New Window: Pop the viewer out into a separate, resizable OS window — move it to a second monitor and read every log at full width while you keep coding.
- ⧉ Copy All & Row Copy: Copies logs to clipboard (ANSI codes and chrome stripped). Includes non-intrusive, auto-dismissing 3-second status bar and in-webview snackbar feedback.
🏗️ Architecture
Flutter Application (F5 Debug Session)
       │
       ├────────────────────────────────────────┐
       ▼                                        ▼
Debug Adapter Protocol (DAP)            Dart VM Service
(stdout / stderr / framework)        (Logging / Stdout / Stderr)
       │                                        │
       ▼                                        ▼
  LineBuffer                               LineBuffer
       │                                        │
       └───────────────────┬────────────────────┘
                           ▼
                     Deduplicator
                           ▼
                  LogStore (In-Memory)
                           ▼
               Flutter Log Explorer Panel
               (VS Code Activity Bar Webview)
⚙️ Configuration Settings
Customize Flutter Log Explorer via VS Code Settings (Cmd+, or Ctrl+, > search flutterLogExplorer):
| Setting |
Type |
Default |
Description |
flutterLogExplorer.fontSize |
number |
9 |
Font size in pixels for log messages (6–24). |
flutterLogExplorer.lineHeight |
number |
1.0 |
Vertical row spacing and line height multiplier for log messages (1.0–3.0). |
flutterLogExplorer.maxLogs |
number |
50000 |
Maximum number of logs retained in memory. Oldest logs are evicted first; error counters and session history remain intact. |
flutterLogExplorer.vmService.enabled |
boolean |
true |
Connects to the Dart VM Service WebSocket when detected to capture dart:developer log() streams. |
flutterLogExplorer.diagnostics.logDapTraffic |
boolean |
false |
Dumps raw Debug Adapter Protocol traffic to the "Flutter Log Explorer (Diagnostics)" Output channel for troubleshooting. |
⌨️ Keyboard Shortcuts & Commands
Flutter Log Explorer comes with built-in keyboard shortcuts for both macOS and Windows / Linux so you can manage everything without lifting your hands off the keyboard.
🌐 Global VS Code Shortcuts (Work Everywhere in VS Code)
| Action |
macOS |
Windows / Linux |
Command ID |
| Open Flutter Log Explorer |
⌥ ⌘ L |
Ctrl + Alt + L |
flutterLogExplorer.open |
| Toggle Pause / Resume |
⌥ ⌘ Space |
Ctrl + Alt + Space |
flutterLogExplorer.togglePause |
| Clear All Logs |
⌥ ⌘ K |
Ctrl + Alt + K |
flutterLogExplorer.clearLogs |
| Open Log Display Settings |
⌥ ⌘ , |
Ctrl + Alt + , |
flutterLogExplorer.openSettings |
| Show Keyboard Shortcuts |
⌥ ⌘ / |
Ctrl + Alt + / |
flutterLogExplorer.showShortcuts |
| Restart DAP & VM Collectors |
⌥ ⌘ F5 |
Ctrl + Alt + F5 |
flutterLogExplorer.restartCollector |
🖥️ In-Viewer Keyboard Shortcuts (Inside Flutter Log Explorer)
| Feature |
Action |
macOS |
Windows / Linux |
| 🔍 Search & Filter |
Focus Search Box & Select |
⌘ F or / |
Ctrl + F or / |
|
Focus Level Filter Dropdown |
⌥ L |
Alt + L |
|
Focus Category Filter Dropdown |
⌥ C |
Alt + C |
|
Clear Search / Close Modal / Defocus |
Esc |
Esc |
| 📋 View Switcher |
Switch to Timeline View |
1 or ⌥ 1 |
1 or Alt + 1 |
|
Switch to Compact View |
2 or ⌥ 2 |
2 or Alt + 2 |
|
Switch to Detailed View |
3 or ⌥ 3 |
3 or Alt + 3 |
|
Switch to Errors Only |
4 or ⌥ 4 |
4 or Alt + 4 |
| ⚡ Actions |
Toggle Pause / Resume Live Stream |
Space or ⌥ P |
Space or Alt + P |
|
Clear All Logs |
⌘ K or ⌘ L |
Ctrl + K or Ctrl + L |
|
Copy All Filtered Logs |
⇧ ⌘ C |
Ctrl + Shift + C |
|
Open Display Settings Dialog |
⌘ , |
Ctrl + , |
|
Open Shortcuts Cheat Sheet |
? or ⌘ / or F1 |
? or Ctrl + / or F1 |
| 🧭 Navigation |
Select Next / Previous Log Row |
↓ / ↑ or J / K |
↓ / ↑ or J / K |
|
Copy Selected Log Entry |
C |
C |
|
Expand / Collapse Log Details |
Enter |
Enter |
|
Scroll to Oldest Logs (Top) |
Home or ⌘ ↑ |
Home or Ctrl + Home |
|
Scroll to Newest Logs (Bottom) |
End or ⌘ ↓ |
End or Ctrl + End |
| 🗗 Window Control |
Pop Out into Separate OS Window |
⌥ W |
Alt + W |
|
Return to Full Window |
⌥ F |
Alt + F |
💡 Tip: Click the ⌨ Shortcuts button in the top toolbar or press ? inside the viewer anytime to open the interactive, OS-adaptive shortcuts cheatsheet!
❓ FAQ & Troubleshooting
Why do some logs show up under WARNING or ERROR automatically?
The built-in classifier scans log content and VM Service levels. Lines containing exceptions, stack traces, 5xx HTTP codes, or level >= 1000 are labeled as ERROR, while 4xx codes or framework warnings are labeled as WARNING.
Does Flutter Log Explorer work with physical devices and emulators?
Yes! As long as you run your Flutter app in debug mode (F5) through VS Code on an Android Emulator, iOS Simulator, physical device, macOS, Windows, Linux, or Web, logs are captured automatically.
Are my logs private?
100% Yes. Flutter Log Explorer operates entirely locally within your VS Code instance. No analytics, no telemetry, and no external network calls are made. Logs are stored strictly in local memory and are never persisted to third-party servers.
Where can I see raw adapter diagnostic logs?
Open the Output panel in VS Code (View > Output) and select "Flutter Log Explorer (Diagnostics)" from the dropdown.
🛣️ Roadmap
- [x] Milestone 1: Zero-config DAP + Dart VM Service collectors, in-memory store, live Webview stream, deduplication, pause/resume.
- [x] Milestone 2: Regex classifier engine, categorized severity tags (Network, Firebase, Navigation, System).
- [ ] Milestone 3: Advanced search syntax (
level:error category:network text), stack-trace click-to-source navigation.
- [ ] Milestone 4: Session selector, incident reporting, network payload viewer & sensitive data auto-redaction.
- [ ] Milestone 5: Export logs (JSON, CSV, Plaintext), custom user classification rules.
📄 License
This extension is licensed under the MIT License.
Developed with ❤️ for the Flutter & Dart community.
| |

