kanrai
See how an HTTP request moves through your code, and jump through it with Cmd/Ctrl+click.
Your AI agent leaves short comments along the request path:
// [POST: /api/auth/login flow-1] Reads email and password
// [POST: /api/auth/login flow-1 fail:400] Body fails validation
// [POST: /api/auth/login flow-2 db:users:read] Looks the user up by email
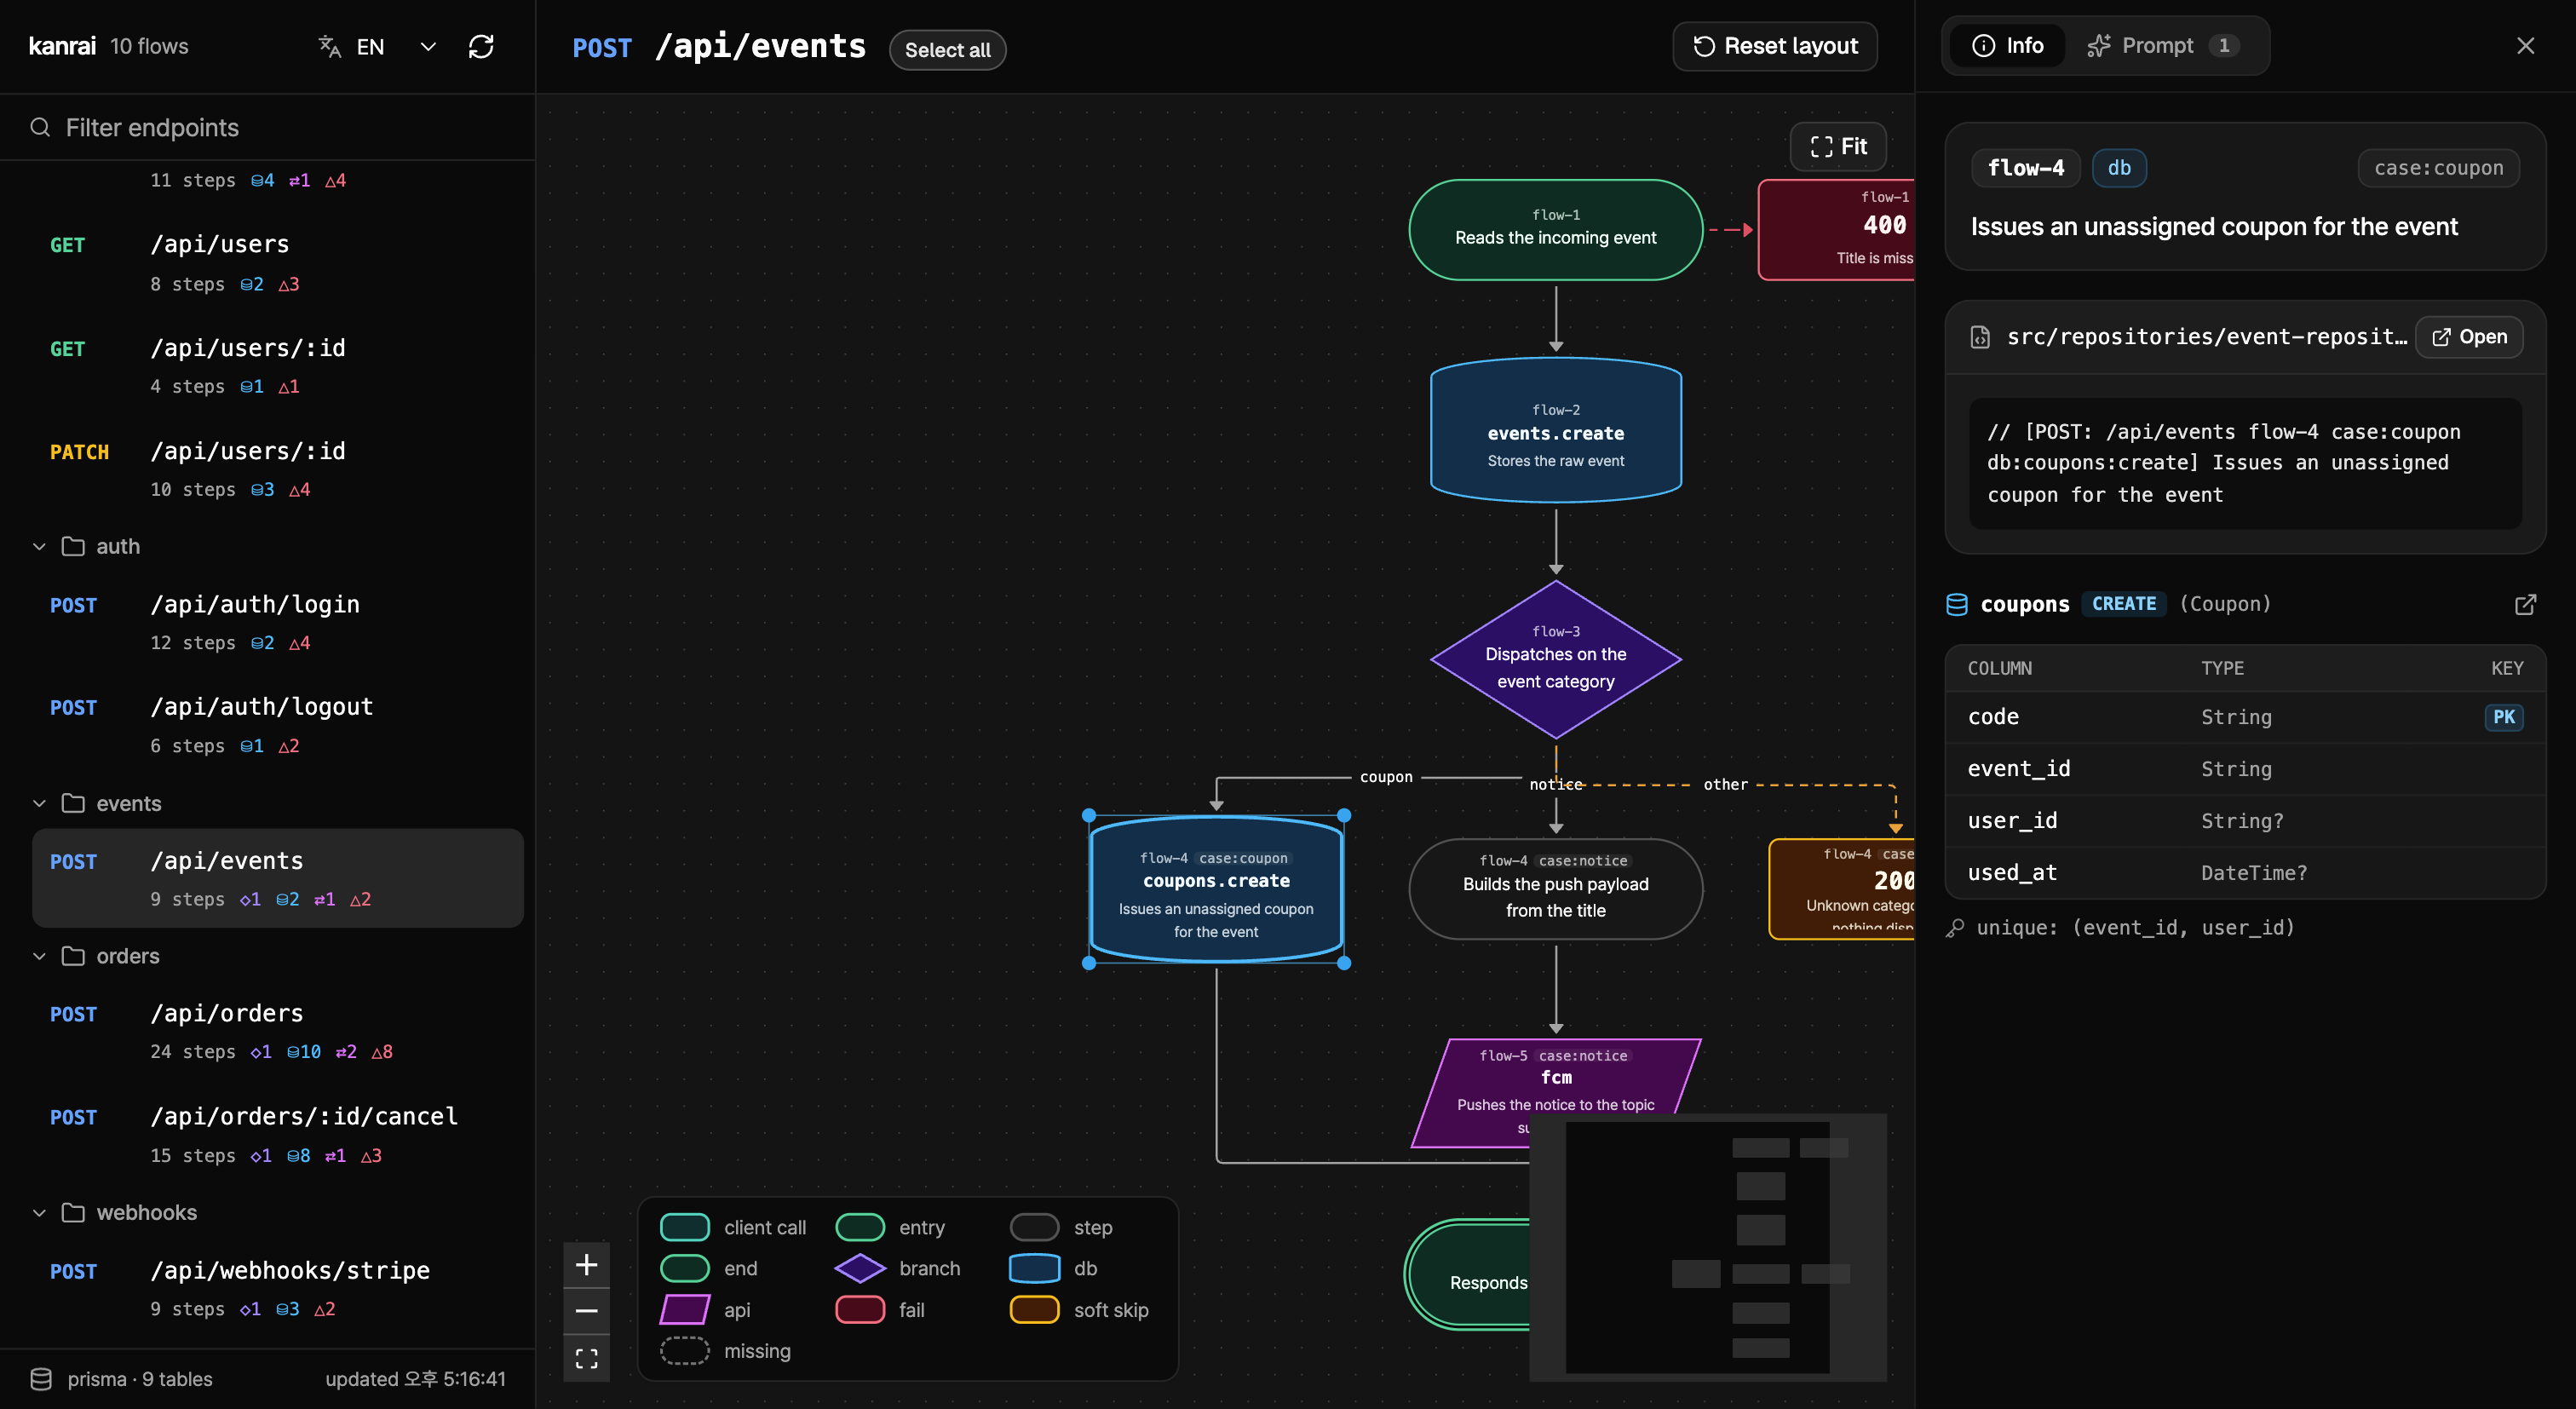
kanrai turns those comments into a flow you can follow in the editor and see as a graph.
Features
- Jump to the next step. Cmd/Ctrl+click an annotation to go to the next step, even in another file. Branches and failures open as a peek list.
- Broken flows in Problems. Gaps, duplicates and typos in a route show up as soon as a file is saved.
- Colored annotations. Steps,
api:, db:, fail: and case: each get their own color.
- Table schema on hover. Hover
db:users:read to see the users columns. Works with Prisma, Drizzle, TypeORM, Sequelize, Django, SQLAlchemy and SQLModel.
Getting started
- In your project, run
npx kanrai init. It prints a prompt for your AI agent.
- Paste the prompt into Claude Code, Codex or a similar agent to annotate your code.
- Open the project in VS Code. The extension picks up the annotations on its own.
To see the graph above, run npx kanrai visualize, then run kanrai: Open flow viewer in browser.
Commands
| Command |
|
| kanrai: Rescan flows |
Rebuild the flow index from scratch |
| kanrai: Open flow viewer in browser |
Open localhost:4477 (needs npx kanrai visualize) |
Settings
Change annotation colors under kanrai.annotation*, for example kanrai.annotationFailForeground.
Python projects need python3 (3.9+) on PATH to read the table schema.
The flow index lives in .kanrai/. It is generated, so add it to .gitignore.
GitHub · Report an issue · MIT

