nimblescape Mindbug
See the memory of your TypeScript program while you debug it: the stack and the heap, as a diagram next to the code.
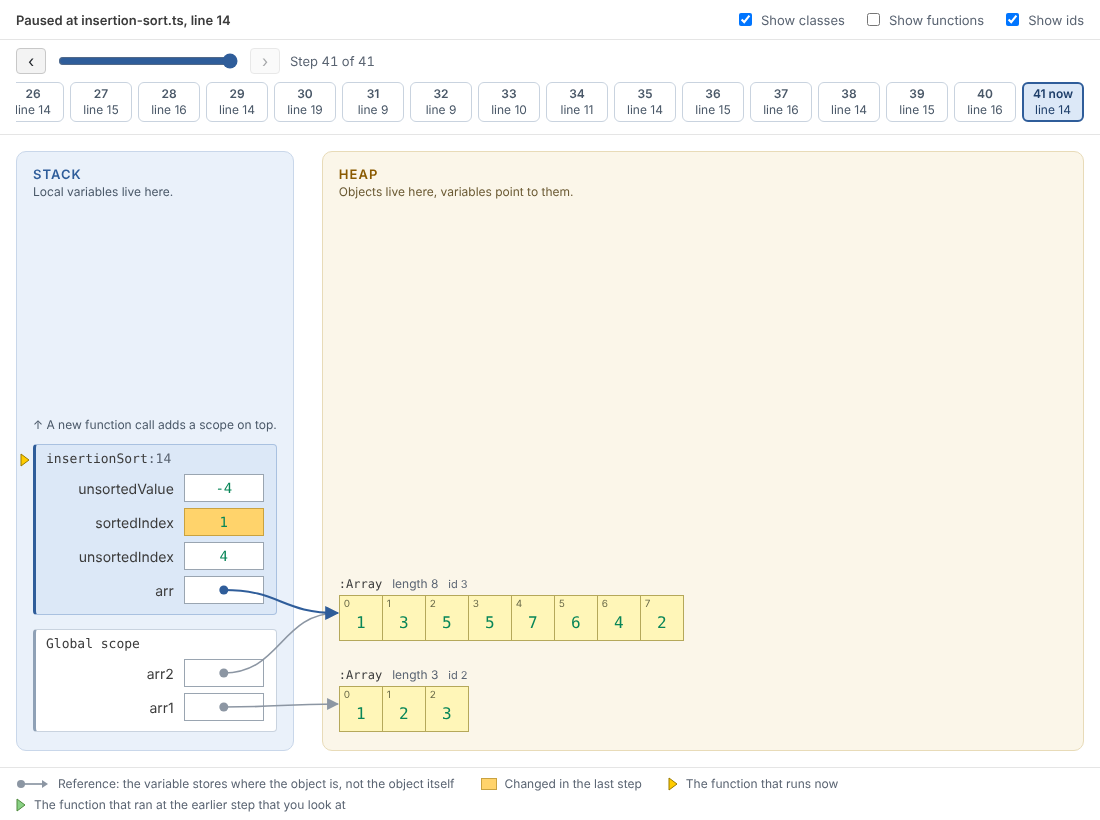
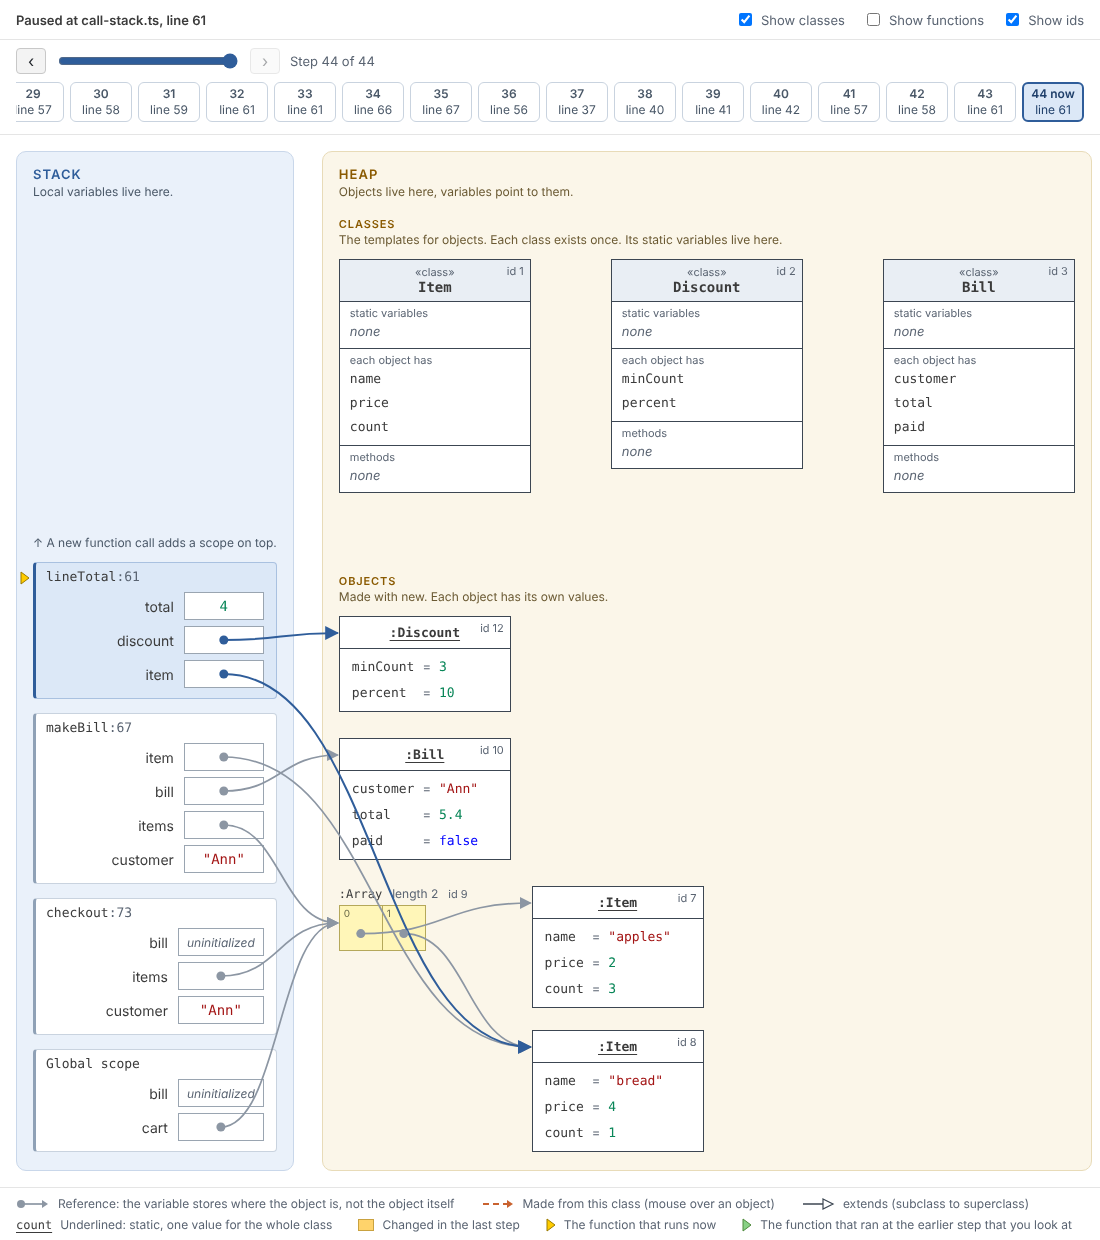
Mindbug is a VS Code extension for teaching. It shows the stack, with one scope for each function call and its local variables, and the heap, with the objects and arrays that the variables point to. Arrows go from the variables to the objects. Mindbug works like Python Tutor, but inside VS Code, with its normal debugger. It runs the program with Deno or Node.js.
What Mindbug does on your computer
- When it works. Mindbug starts when a debug session starts in VS Code, or when you run one of its commands. Before that, it does nothing.
- Runtimes. Run with Mindbug and a launch configuration of type
mindbug first run deno --version or node --version (the programs of the settings nimblescape.mindbug.denoPath and nimblescape.mindbug.nodePath) to find a runtime. Then the JavaScript debugger of VS Code starts your TypeScript file with Deno (deno run --inspect-brk=127.0.0.1:9229 --allow-all) or with Node.js 22.7 or newer (node --inspect-brk=127.0.0.1:9229 --experimental-transform-types), in the workspace folder, and connects to it on your computer only (127.0.0.1, port of the setting nimblescape.mindbug.inspectPort). With --allow-all, Deno gives your program all the rights of your user, as Node.js does. Run with Mindbug saves the file before it starts it.
- Code in your program. At each pause of a debug session of the JavaScript debugger, also of one that Mindbug did not start, Mindbug runs a small helper in the paused program with the
evaluate request of the debugger. The helper reads the variables of the scopes and the objects that they reach, and gives each object a number that stays the same from step to step. It adds one hidden global variable, __mindbug, to the program, calls no getter, and changes no variable and no object of the program. Only an object that is a Proxy runs code of the program when the helper reads it.
- Files and data. Mindbug changes no file, except the save of Run with Mindbug. It keeps the steps of the step history in the memory of VS Code, until the next debug session starts, and the view keeps its three switches while it is open. Mindbug writes nothing to the disk.
- Network. Mindbug connects to no address. The debugger connects to the runtime on your computer. Deno downloads the modules that your program imports from the web (for example
npm: and jsr: imports), as deno run always does. Mindbug collects no telemetry.
Security describes each step and where its protection ends.
Features
- Stack and heap. The stack and the heap build bottom up: the Global scope and its objects are at the bottom, and each function call adds a scope, with its objects, on top. A triangle at the left points to the scope that runs.
- UML notation. Objects are UML objects (
:Person, with one line for each attribute), and arrays are rows of indexed cells.
- Classes. The classes are at the top of the heap, with their static variables, attributes, methods and superclass, because in JavaScript a class is also an object on the heap.
- Aliasing. Two arrows to one object show that two variables point to the same object.
- Changes. Everything that changed in the last step has a yellow background.
- Step history. Go back to an earlier step. The view then shows the memory of that step, and the editor marks its line.
- Any runtime. The view shows every debug session of the JavaScript debugger of VS Code, also one that a launch configuration of type
node starts.
- Themes. The view follows the light, dark and high contrast themes of VS Code.
Requirements
- VS Code 1.125 or later. Mindbug uses the JavaScript debugger that is part of VS Code.
- Deno 2, or Node.js 22.7 or newer. Mindbug takes Deno when it is installed, else Node.js.
Getting started
- Open a TypeScript file.
- Run the command Run with Mindbug (Command Palette, or the button at the top right of the editor).
- The program pauses at its first line, and the Mindbug view opens next to the code.
- Use Step Over (F10) and Step Into (F11) of the debugger. The view changes at each step.
Without a launch.json file, F5 in a TypeScript file also offers Mindbug. The user guide explains the launch configurations of type mindbug, and the examples are four small programs to start with.
Settings
| Setting |
Default |
What it does |
nimblescape.mindbug.runtime |
auto |
The runtime: auto (Deno when it is installed, else Node.js), deno or node. |
nimblescape.mindbug.denoPath |
deno |
Path to the Deno program. |
nimblescape.mindbug.nodePath |
node |
Path to Node.js 22.7 or newer. |
nimblescape.mindbug.inspectPort |
9229 |
Port on which Deno or Node.js waits for the debugger. |
nimblescape.mindbug.stopOnEntry |
true |
Pause at the first line of the program. |
nimblescape.mindbug.openAutomatically |
true |
Open the Mindbug view at the first pause of a debug session. |
nimblescape.mindbug.maxHistorySteps |
500 |
Number of steps that the view keeps for the step history. |
nimblescape.mindbug.maxObjects |
300 |
Number of heap objects that are read per scope. |
nimblescape.mindbug.maxArrayItems |
100 |
Number of array items, set members and map entries per object. |
nimblescape.mindbug.maxStringLength |
200 |
Number of characters per string. |
All commands, settings and details are in the user guide.
Security and privacy
A program that you run with Mindbug is code that you run. It runs with the rights of your user, as with deno run --allow-all or node in a terminal. Run only programs that you trust. VS Code debugs a program only in a trusted workspace, so Mindbug does not run in Restricted Mode. See Security.
Mindbug connects to no address, stores nothing on the disk, and collects no telemetry.
Uninstall
Uninstall the extension in VS Code. Mindbug stores no data, so nothing else is left. A launch.json file with a configuration of type mindbug stays; VS Code then shows that it does not know the type.
Change log · Contributing · User guide · Support · Issues · Source
© 2026 Hannes Stauss (scalarion@nimblescape.com) · MIT License.
| |

