Nightgauge
The cockpit for the Nightgauge autonomous software factory, built into VS Code.
Nightgauge guides work through planning, implementation, validation, and pull
request stages, and this extension is where you watch it
work: queue issues, approve plans, follow live pipeline state, and review
the evidence behind each run. A six-stage pipeline combines
documentation-first planning with deterministic checks at key boundaries:
a plan you approve before any code is written, a hard build/test gate, and
a manual test checklist before a PR is opened.
It is not a chatbot or an inline code-completion tool. It's a pipeline
orchestrator: each stage runs as a fresh AI agent that receives a
structured JSON handoff from the previous stage instead of the full
conversation history, so context stays focused and any stage can be retried
independently. Deterministic code verifies repository state and selected stage
outputs; provider behavior and manual review remain part of the trust model.
Quick Start
Before you start
Nightgauge drives real tools on your machine, so three things must be in place
before the pipeline can run a single stage. See
Requirements for versions.
git, and a repository with a GitHub remote.- The
gh CLI, signed in — run gh auth login.
This is how the pipeline authenticates to GitHub. Signing in to Nightgauge
inside VS Code (step 2 below) does not replace it.
- An AI coding agent — the
claude
CLI (Claude Code) is
the supported adapter path. The other adapters — Codex, Gemini, Copilot,
and direct API keys — are beta: they work, but are far less exercised
and rougher; see Settings.
Run Nightgauge: Adapter Doctor from the Command Palette at any point to
check all three. (The nightgauge binary ships inside the extension and is
not added to your PATH, so there is no shell command to run until you
clone the repository.)
Steps
- Install — Install Nightgauge from the VS Code Marketplace. The
Marketplace serves the build matching your platform automatically.
- Sign in (optional) — Run Nightgauge: Sign In with GitHub from the
Command Palette. This connects a Nightgauge account for hosted features. It
is not how the pipeline reaches GitHub — that is
gh auth login above,
or a token in .nightgauge/config.yaml.
- Trust the folder — Open the repository you want to automate. VS Code
opens a folder it has not seen before in Restricted Mode, which
disables Nightgauge entirely: there is no Nightgauge icon in the activity
bar until you trust it. Click Manage in the Restricted Mode banner,
then Trust, and the icon appears.
- Initialize the repo — Open the Nightgauge sidebar and click
Initialize Repository in the welcome view. This starts your AI agent
(the
claude CLI by default) in a VS Code terminal, so expect an
interactive session — the agent may ask its own questions, including its
own folder-trust prompt, before it does anything. It then writes
.nightgauge/config.yaml, standard labels, and links your GitHub
Project board. Nothing is written until you opt in.
- Claim an issue — Click Nightgauge: Pick Up Issue (or drag an
item out of the Ready list) to start the pipeline on a GitHub issue.
- Watch it run — The pipeline moves through
issue-pickup →
feature-planning → feature-dev → feature-validate → pr-create →
pr-merge automatically, pausing only for your plan approval and a manual
test confirmation. When it finishes, you have a reviewed, issue-linked
pull request.
Installing
Nightgauge ships a separate build per platform. The Marketplace picks the right
one for you; macOS (Apple Silicon and Intel) and Linux x64 are supported.
Windows is not supported yet — the pipeline backend is a native binary that has
no Windows build, so the Marketplace will report the extension as unavailable
there.
To install a specific build instead, download the VSIX matching your OS and
architecture from the GitHub
Release and use
Extensions → … → Install from VSIX. For extension development, clone the
repository and run scripts/dev-install.sh; that builds the working tree with a
timestamped development version and is not a release-validation path.
Features
- Command Palette Integration - Run pipeline stages, dashboards, and
utilities from the command palette
- Status Bar - Visual feedback showing current pipeline state
- Settings - Configurable authentication and model selection
- Output Channel - Structured logging for pipeline events
- Pipeline Queue - Queue issues for sequential processing when a pipeline is
already running
- Batch Processing - Process multiple issues through the full pipeline with
dynamic queue addition
- Multi-repository workspaces and autonomous mode - Route issues across
several repositories and let a scheduler pick up ready work on its own. Both
are available but materially less finished than the single-repository loop
above; treat them as beta and keep a human watching the Action Center
- Knowledge Value Dashboard - Aggregates KB telemetry into header cards, a
hit-rate gauge, per-stage bar chart, top-recalled/stale tables, and
graduation history (see below)
- Adapter Usage & Quota - The active adapter's usage as a status-bar meter
(click to cycle windows) and, in the dashboard's Overview tab, a panel with
every window at once, per-model breakdown, burn rate, projected exhaustion,
and a recent-runs strip. Both read one snapshot, so they never disagree; a
window with no known ceiling shows an absolute figure rather than a bar, and
an adapter nothing can meter is labelled unknown rather than zero
One run, every surface
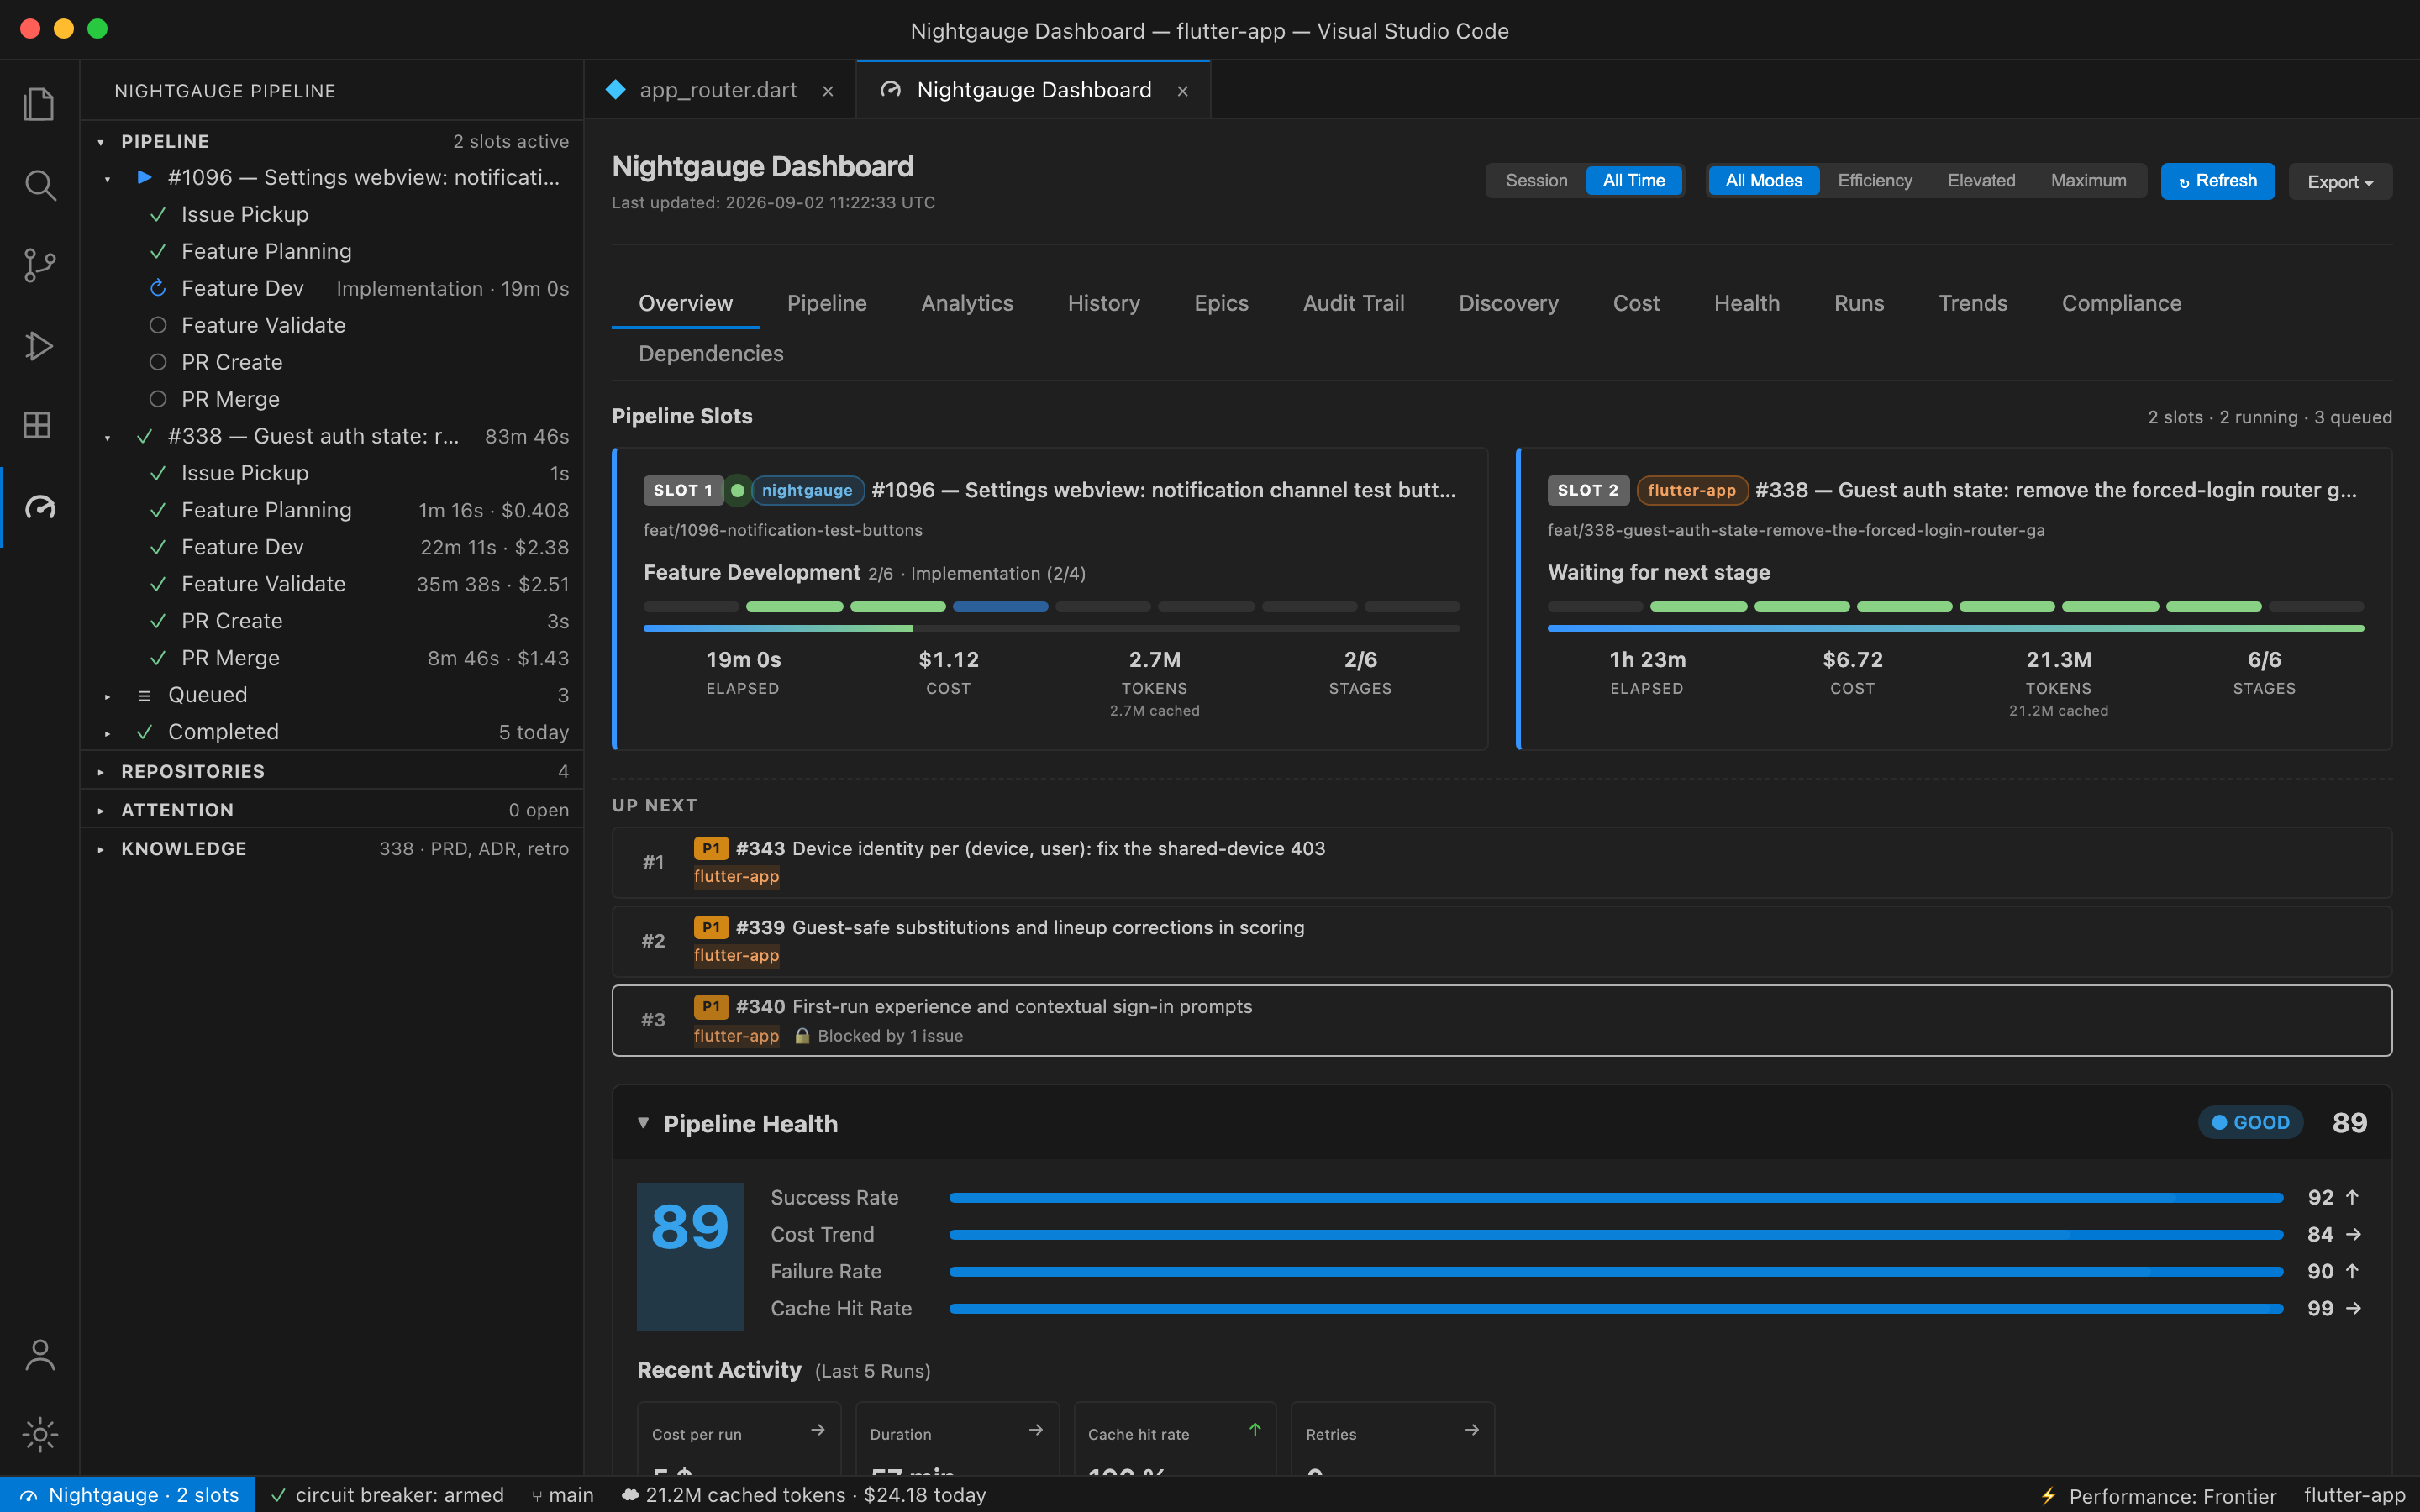
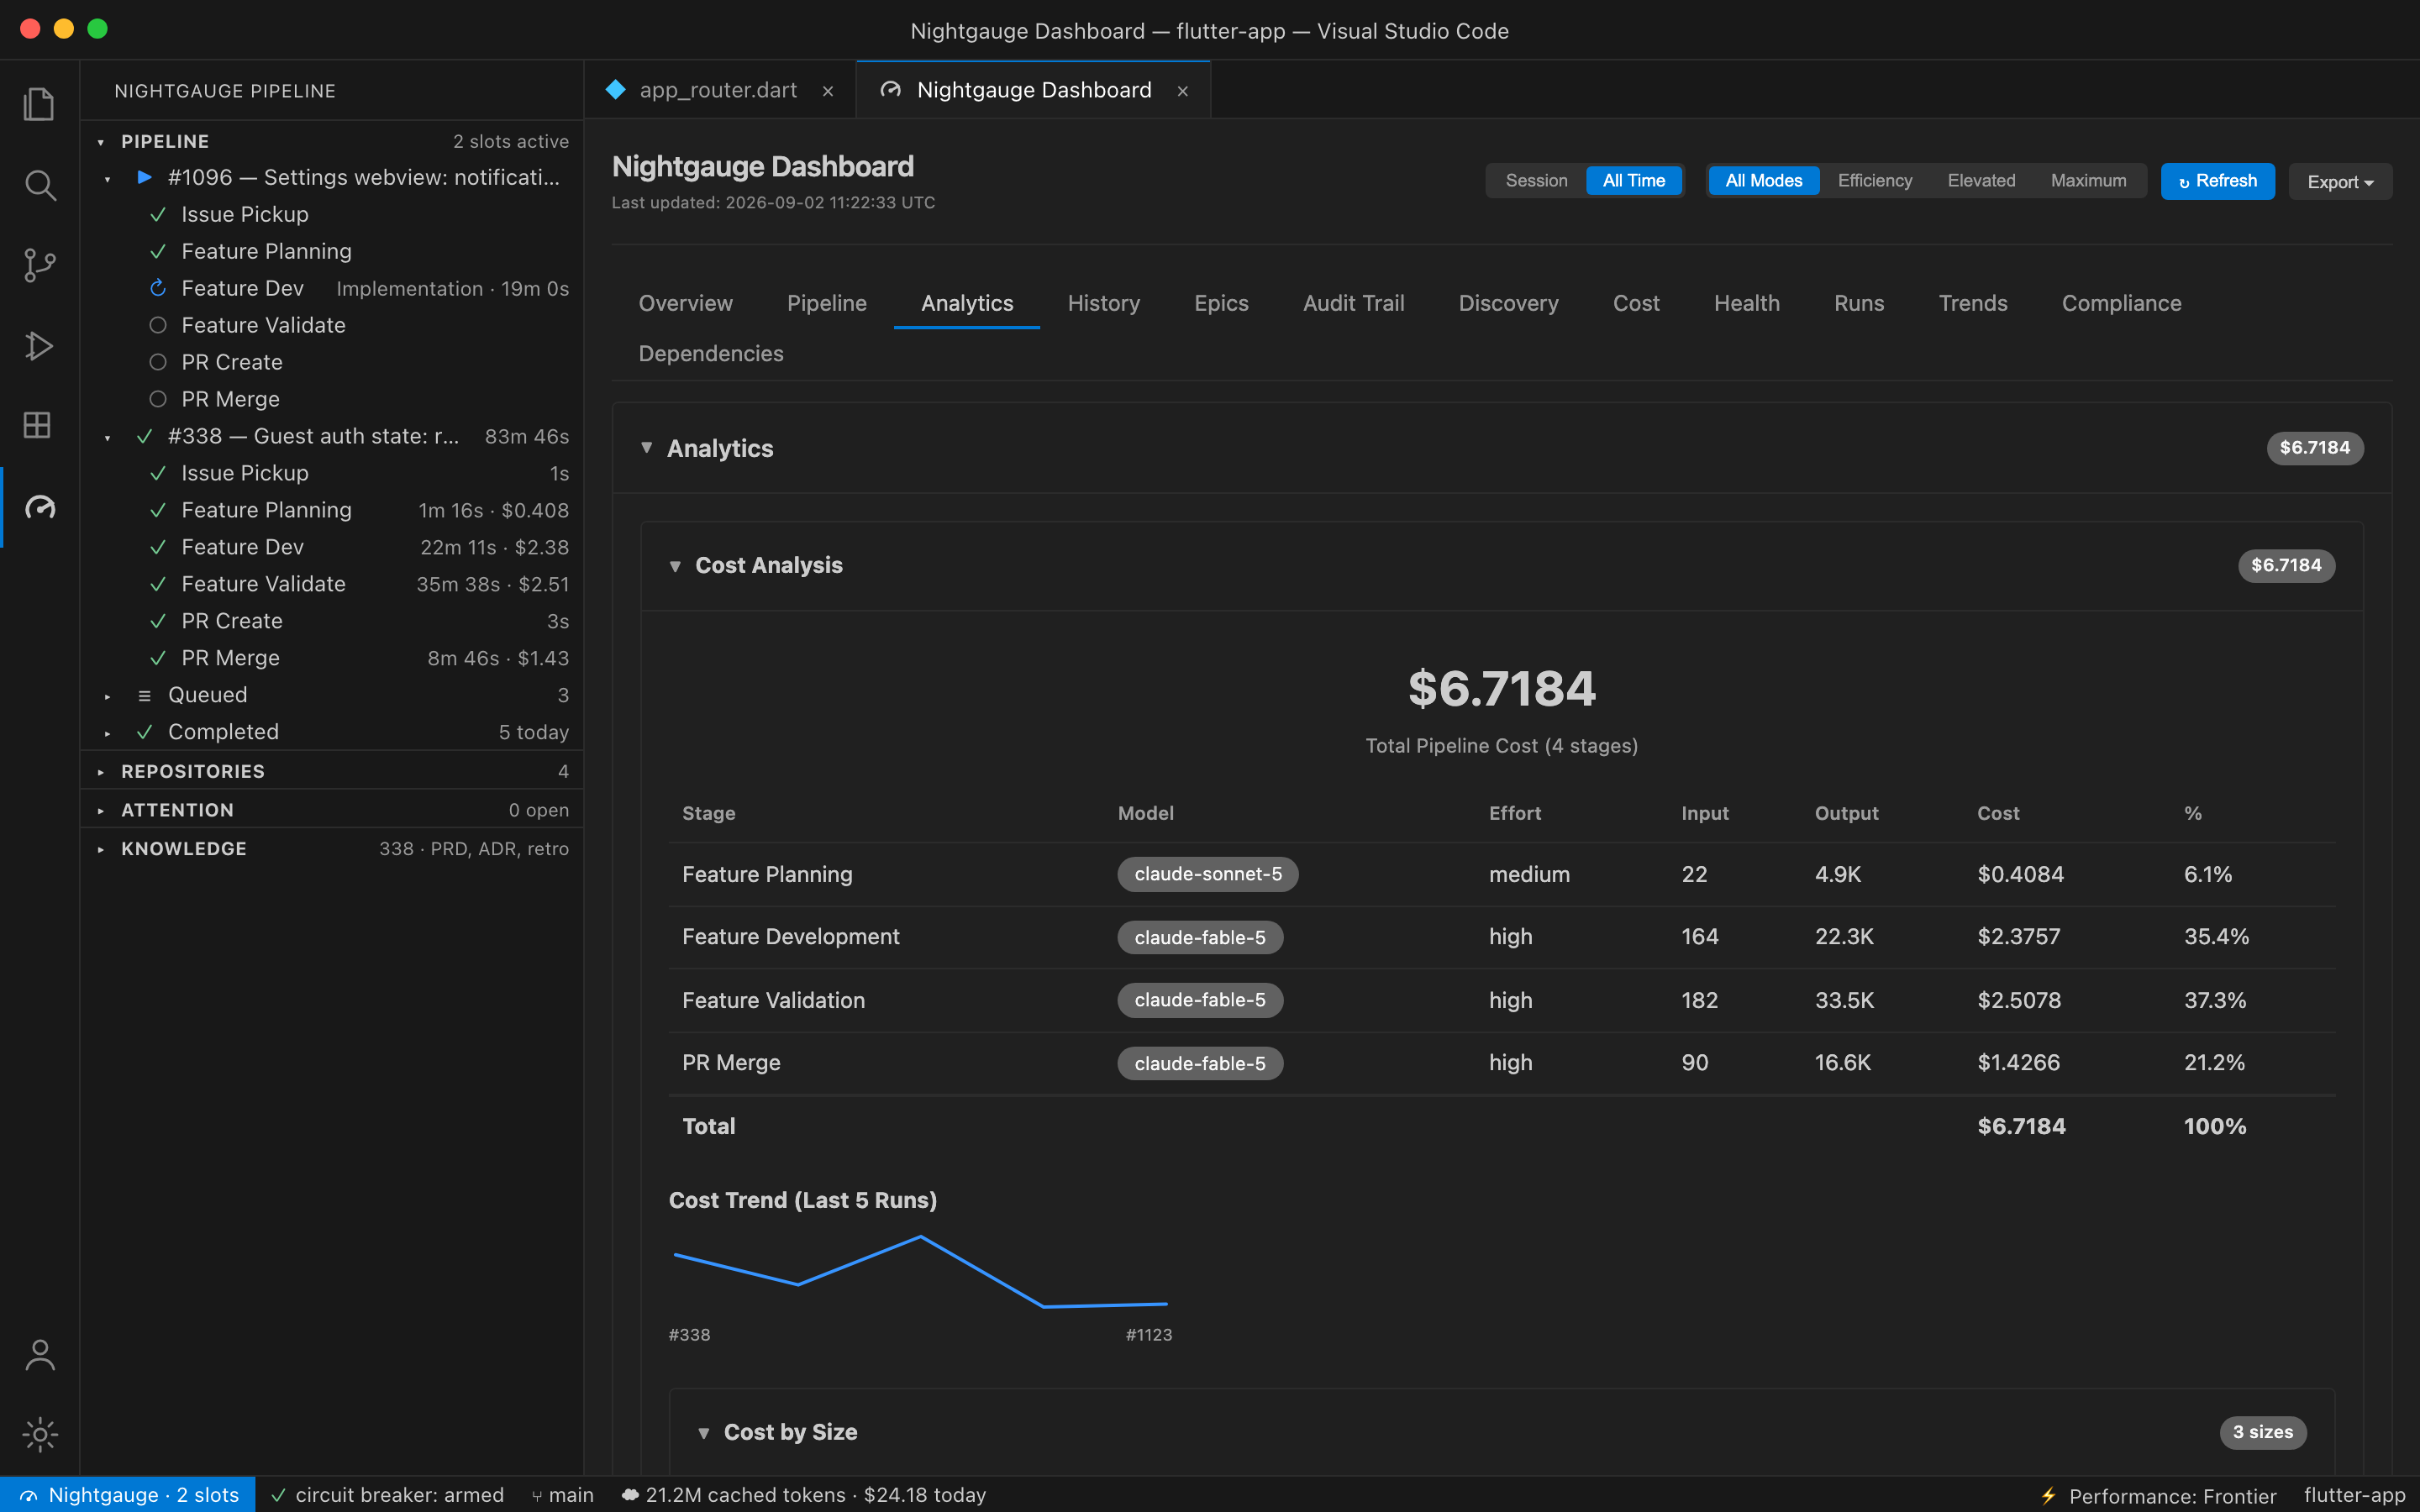
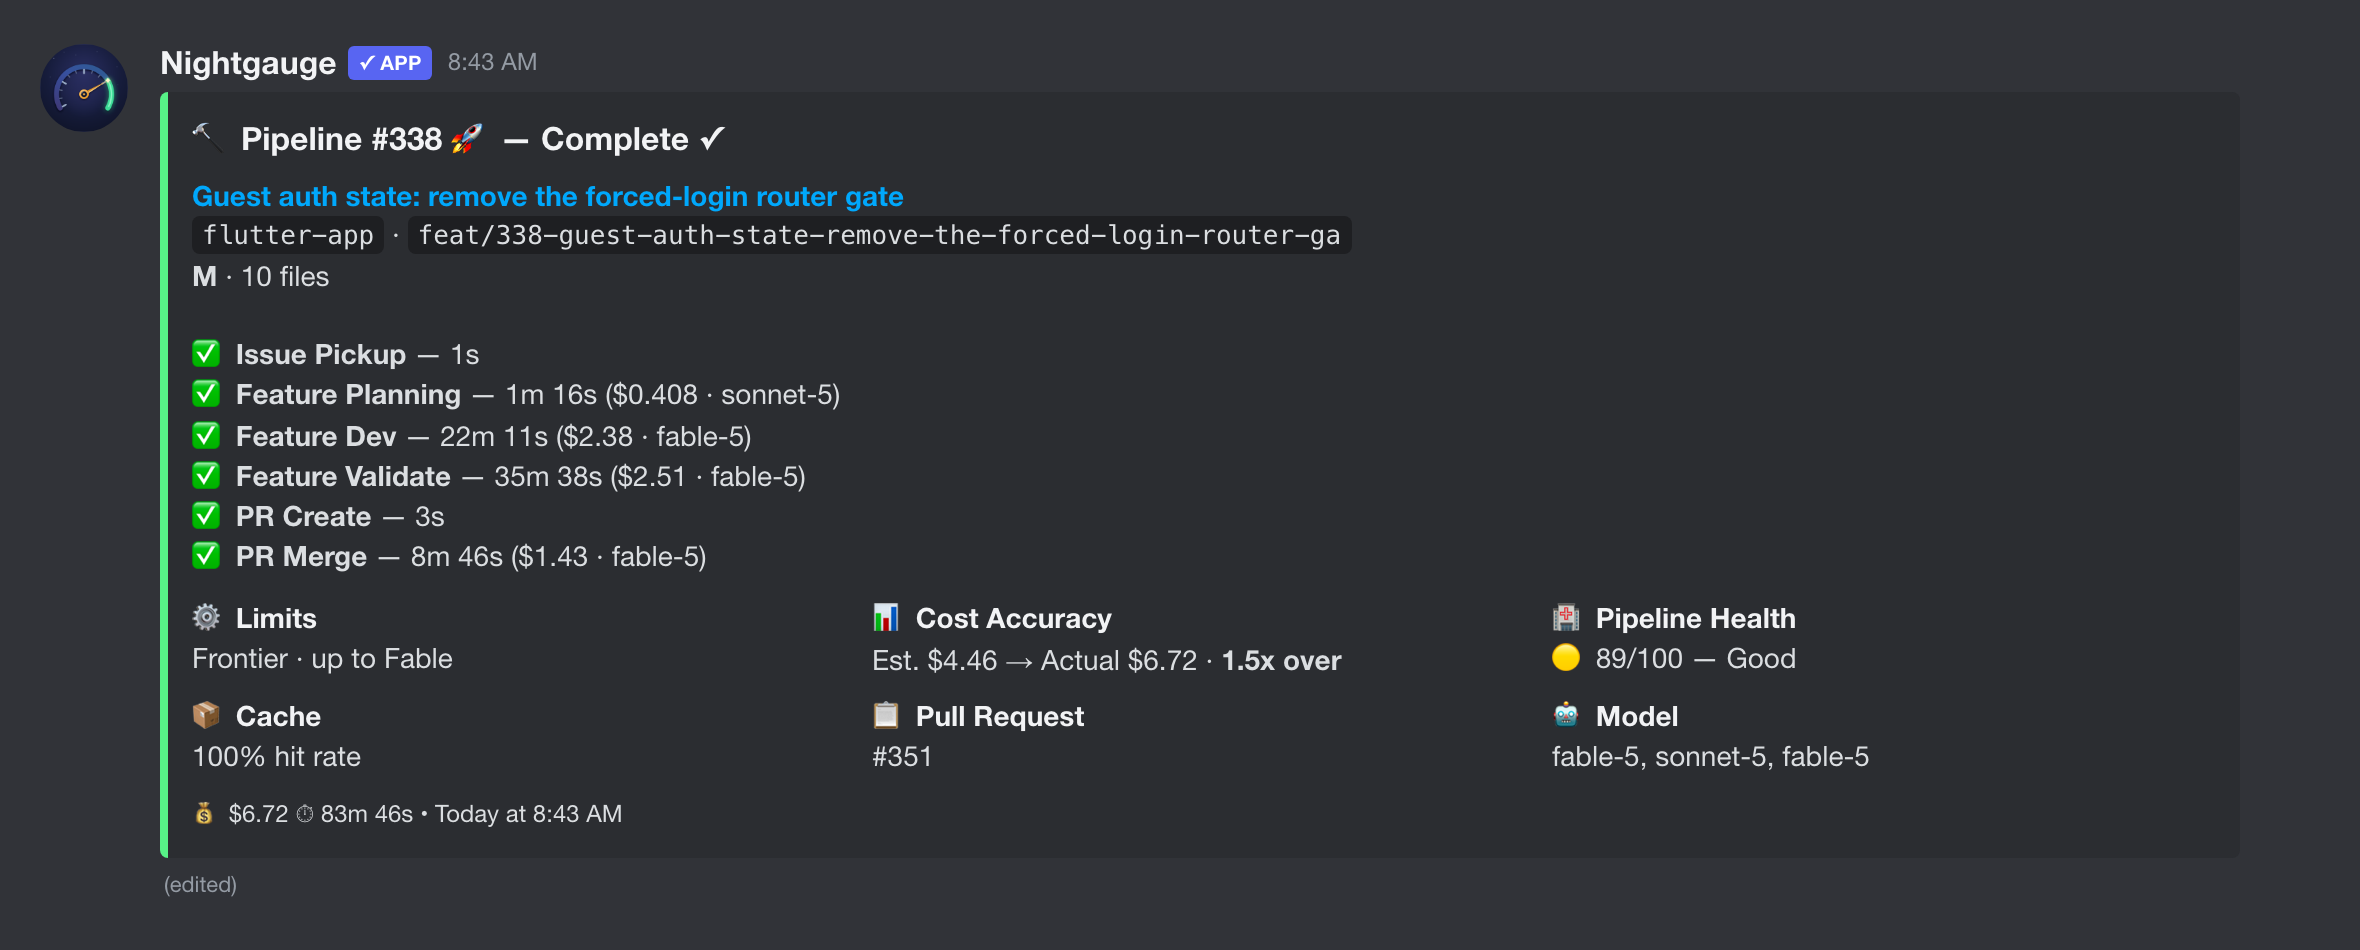
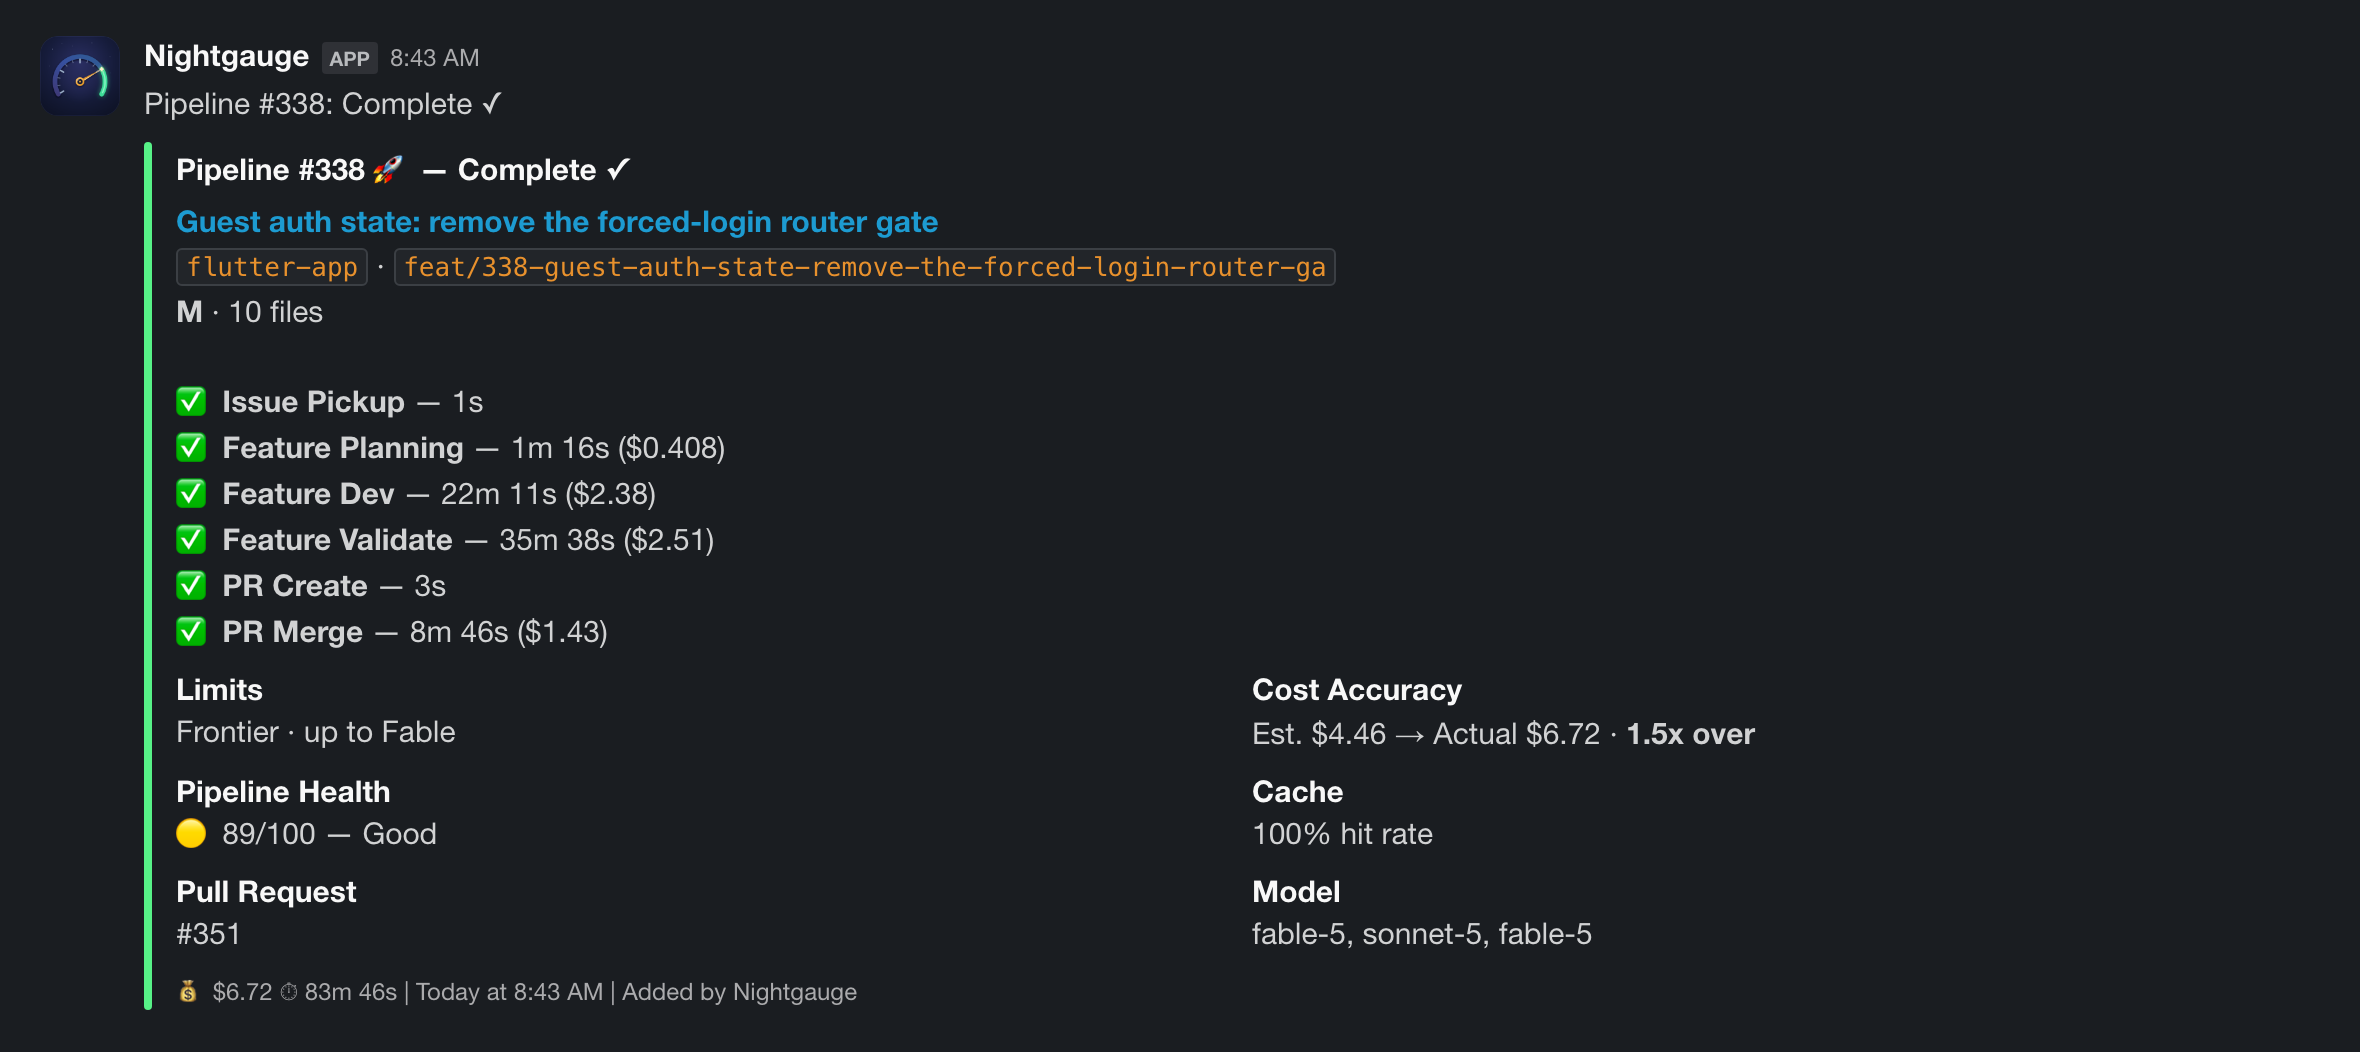
Every image on this page is rendered from the same real pipeline run by
npm run -w nightgauge-vscode marketing:screenshots: the dashboard HTML is the
extension's own renderer and the notification cards are the exact payloads the
Discord and Slack notifiers send. Only the window and chat chrome around them
are mocked.
Analytics — the model, effort level, tokens and cost of every stage in the
run, with the share of the total each stage took and the cost trend across
recent runs.
Notifications — the Discord embed and Slack attachment posted when the same
run merged. Configure either in .nightgauge/config.yaml.
Exact appearance varies with your VS Code theme, platform, and version.
Privacy and Telemetry
Telemetry is on by default and you are asked on first activation whether to
keep it on; turning it off there, or later in Settings, is honored permanently.
VS Code's global telemetry-off setting is honored as a hard stop. Without a
platform license key or sign-in nothing is uploaded at all. When enabled, the
pipeline-run stream includes the repository slug and issue number as
correlation keys, plus bounded outcome, duration, and token counters; it never
sends source code, file contents, prompts, secrets, branch names, or commit
SHAs. Streams can be disabled independently at any time.
Read Telemetry Privacy
for the complete field list, retention policy, controls, and deletion
instructions, and the Nightgauge Privacy Policy.
Commands
A full, current list of contributed commands is visible in VS Code's
Extensions view under this extension's "Feature Contributions" tab (sourced
directly from package.json). The most commonly used:
| Command |
Description |
Nightgauge: Sign In with GitHub |
Connect a Nightgauge account for hosted features (optional); not how the pipeline reaches GitHub. Nightgauge: Sign In offers the same plus a browser device-code flow. |
Nightgauge: Pick Up Issue |
Claim an issue and start the pipeline |
Nightgauge: Run Stage... |
Run a single pipeline stage |
Nightgauge: Show Dashboard |
Open the pipeline dashboard |
Nightgauge: Open Knowledge Value Dashboard |
Open the Knowledge Value dashboard |
Nightgauge: Stop Pipeline |
Stop the currently running pipeline |
Nightgauge: Open Settings |
Open the visual settings panel |
Active Issue Knowledge Panel
When a pipeline issue is in progress, the Active Issue Knowledge panel
appears in the Nightgauge sidebar showing:
- PRD.md — product requirements for the active issue
- decisions.md — architecture decisions recorded during planning
- Related Decisions — semantically similar decisions from prior issues (powered by
nightgauge knowledge recall)
The panel refreshes automatically when the active issue changes or when knowledge
files are modified on disk. Click any file item to open it in the editor.
Knowledge Value Dashboard
Opens a webview that aggregates
.nightgauge/pipeline/history/knowledge-events.jsonl into a single
"Is my Knowledge doing anything?" view.
Surfaces:
- 5 header cards: writes / reads / recalls / hits / graduations, with
delta vs. prior window
- Hit-rate gauge (
recall_hits / recalls) with color-coded bands
(green >50%, yellow 20–50%, red <20%)
- Per-stage bar chart of reads + writes
- Top-recalled table (paths sorted by read + recall_hit counts)
- Stale-entries table (paths whose last touch is older than the
configured
stale_days threshold)
- Graduation history timeline
Window selector: 7 d / 30 d / 90 d. Manual Refresh button + auto-refresh
every 5 min while the panel is visible. Empty states for "telemetry
disabled" and "no events in window" are rendered with actionable
instructions.
Enable telemetry by adding to .nightgauge/config.yaml:
knowledge:
  telemetry:
    enabled: true
    stale_days: 30
Identical data is available on the CLI, from a clone of this repository:
nightgauge knowledge metrics --window 7 --stale-days 30 --json
Settings
Configure the extension via VS Code Settings (Preferences > Settings):
| Setting |
Default |
Description |
nightgauge.authProvider |
max |
Authentication provider (max/bedrock/vertex) |
nightgauge.defaultModel |
sonnet |
Default model (sonnet/opus/haiku) |
nightgauge.contextPath |
.nightgauge/pipeline |
Path to pipeline context files (git root) |
nightgauge.plansPath |
.nightgauge/plans |
Path to plan files (git root) |
The full settings surface (adapters, orchestration budgets, notifications,
telemetry, and more) is best browsed through
Nightgauge: Open Settings, which reads/writes the layered
.nightgauge/config.yaml tiers directly.
Status Bar
The status bar shows the current pipeline state:
| State |
Display |
Action on Click |
| Idle |
$(dashboard) Nightgauge |
Run Pipeline |
| Running |
$(sync~spin) {Stage} |
Stop Pipeline |
| Complete |
$(check) Complete |
Run Pipeline |
| Error |
$(error) Error |
Show Dashboard |
Ready Issues View
The Ready Issues sidebar displays all issues with "Ready" status from your
GitHub Project board, intelligently sorted to help you focus on the highest
value work.
Smart Sort (Default):
Issues are automatically sorted by:
- Priority - Critical (P0) → High (P1) → Medium/Low (P2) → Unprioritized
- Blocked Status - Unblocked issues appear before blocked ones
- Size - Smaller issues (XS, S) before larger ones for quick wins
- Age - Older issues (lower numbers) first as tiebreaker
Configuration:
Change the sort order via Settings → Nightgauge → Ready Items → Sort By:
| Sort Option |
Description |
| Smart |
Priority → Unblocked → Size → Age (Recommended) |
| Board |
Preserve GitHub Project board order |
| Priority |
Sort by priority labels only |
| Number |
Sort by issue number |
| Size |
Sort by t-shirt size only |
| Dependencies |
Topological sort (unblocked issues first) |
Epic Grouping:
When epic grouping is enabled, board tabs show the complete epic — all
sub-issues — whenever at least one sub-issue matches the tab's status. Blocked
sub-issues display with lock icons (🔒) indicating they are waiting on a
predecessor. This gives full visibility into the pipeline sequence so you can
run an epic as a batch and watch issues unblock as each phase completes.
Auto-Refresh:
Enable auto-refresh in settings to keep the list up-to-date without manual
refreshes.
Pipeline Queue
When a pipeline is already running and you try to pick up another issue, the
extension automatically queues the new issue for processing after the current
pipeline completes.
Key Features:
- Automatic Queueing - Issues are queued automatically when a pipeline is
active
- Priority Sorting - Queue items are sorted by priority (P0-P3), then size
(S-XL), then issue number
- Dynamic Addition - Add issues to the queue while batch processing is
running
- Token Estimation - Queue displays estimated token consumption based on
issue size labels
- Visual Feedback - Queue section in the sidebar shows all queued issues
with position indicators
Size Label to Token Estimates:
| Size Label |
Token Estimate |
| XS |
5,000 |
| S |
10,000 |
| M |
20,000 |
| L |
40,000 |
| XL |
80,000 |
| (no label) |
20,000 |
Contributing
Contributing, architecture and the test tiers are documented in the repository:
https://github.com/nightgauge/nightgauge/blob/main/CONTRIBUTING.md
Repository Configuration Requirements
Auto-Merge Setting
Disable the repository's allow_auto_merge setting before running the pipeline.
The extension monitors this setting on workspace load and displays a warning
notification if enabled.
Why: The pipeline's pr-merge stage requires exclusive control over PR
merging to detect failures, apply corrections, and keep the UI in sync.
Auto-merge bypasses these mechanisms and causes stale pipeline state.
To disable via VS Code: click Disable Auto-Merge in the warning
notification that appears on workspace load; the extension turns the setting
off through the GitHub API.
To disable via CLI: from a clone of this repository, run
nightgauge repo disable-auto-merge --owner <org> --repo <repo>. The binary
bundled with the extension is not on your PATH.
Requirements
| Requirement |
Notes |
| VS Code 1.85.0 or higher |
|
git |
With a GitHub remote configured on the repository you point Nightgauge at. |
gh CLI, authenticated |
gh auth login. The pipeline resolves its GitHub token from .nightgauge/config.yaml, GITHUB_TOKEN, or gh auth token — in that order. The extension's Sign In with GitHub command authenticates a Nightgauge account and is not part of that chain. |
| An AI coding agent |
The claude CLI (Claude Code) is the supported adapter path. The other adapters — Codex, Gemini, Copilot, and direct API keys — are beta: they work, but are far less exercised and rougher. |
macOS (Apple Silicon and Intel) and Linux x64 only — see
Installing.
Verify all of it from the Command Palette with Nightgauge: Adapter
Doctor.
License
Apache-2.0
Author
nightgauge