Skip to content
| Marketplace
Sign in
Visual Studio Code>Debuggers>disassembly-viewNew to Visual Studio Code? Get it now.
disassembly-view

disassembly-view

Preview

nextarg

|
8,805 installs
| (0) | Free
Installation
Launch VS Code Quick Open (Ctrl+P), paste the following command, and press enter.
Copied to clipboard
More Info

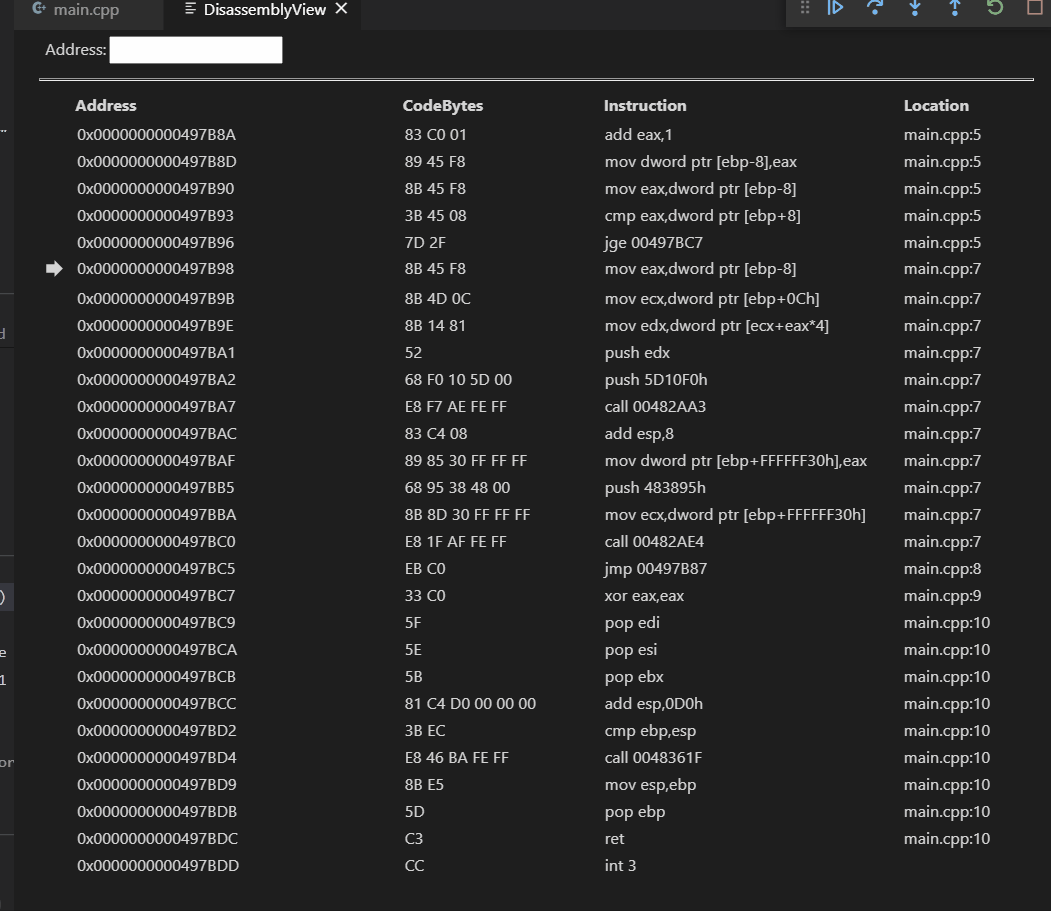
VSCode Disassembly view using DAP

Limitations

  • You need to display the Watch expression.
  • There must be at least one Watch expression.
    The Watch expression to be added can be a non-existent value. (Ex: aaaaaa)

Tested environments

  • Windows10 + vscode-cpptools + cppvsdbg
  • Windows10 + vscode-cpptools + mingw + gdb + the latest MIEngine on github

Execution Requirements

  • Debug adapter with disassembly and memoryReference support.

If you are using mingw+gdb with vscode-cpptools, you probably need to update MIEngine.

Usage
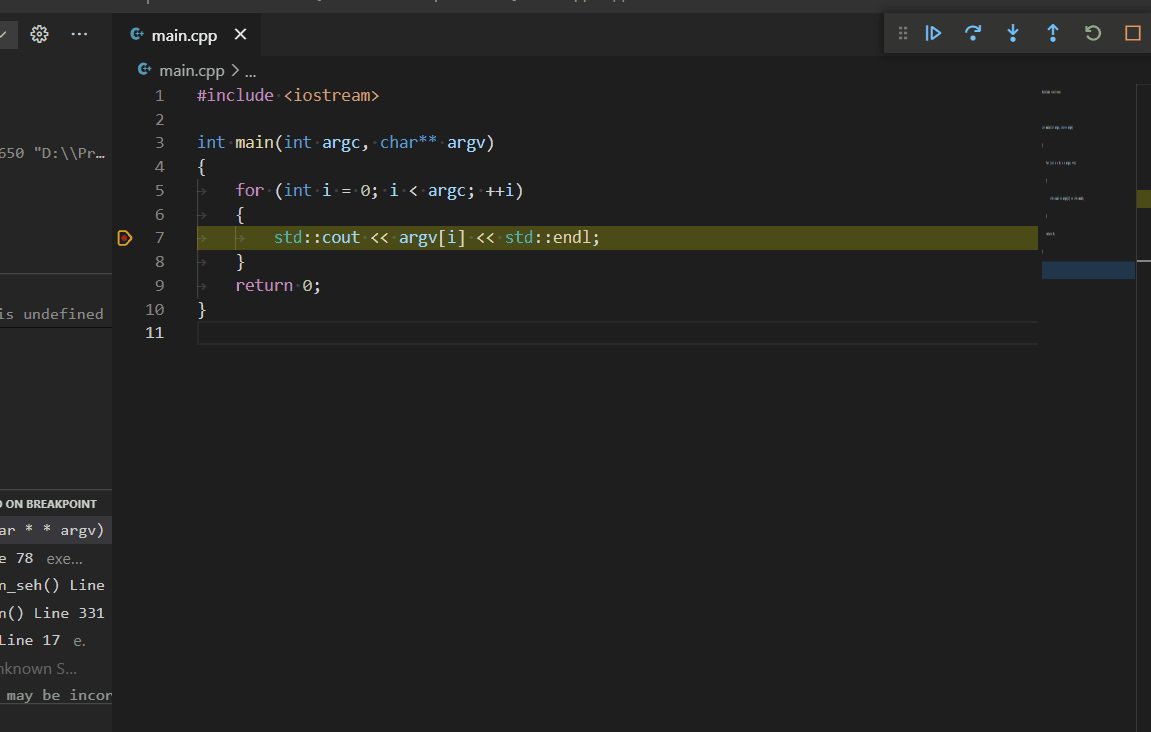
  1. Start debugging and break.
  2. If the Watch expression does not exist, add it.
  3. Execute Disassembly command from the the command palette.
  4. Enter an address or symbol in Address: and press ENTER.
  5. You can use the mouse wheel, up key, and down key to scroll.

Features

Go To Disassembly

:warning: The debug adapter requires support for gotoTargets requests and support for instructionPointerReference.

Select Go To Disassembly from the editor's context menu.
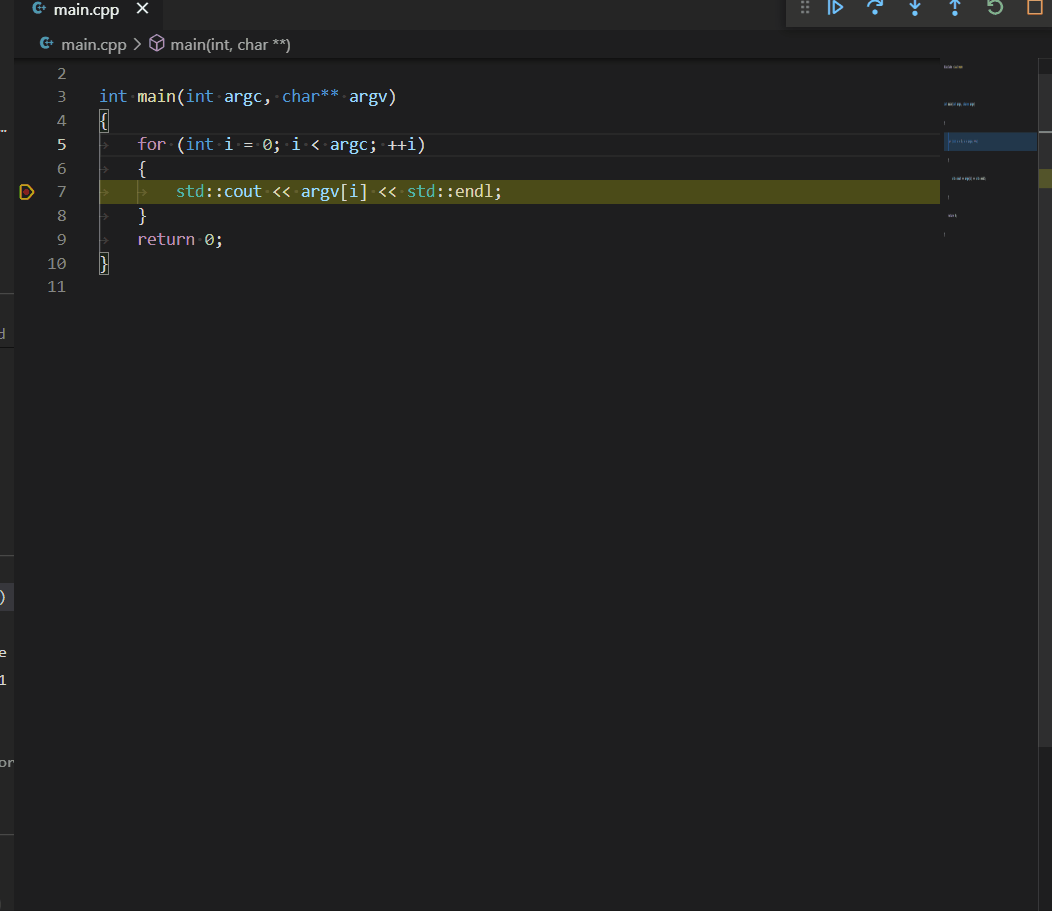
Go To Source

:warning: The source information must be included in the disassembly information.

Select Go To Source from the disassembly view context menu.

Settings

disassembly.resolveLocations

This option takes time, however resolves the source location when using vscode-cpptools + gdb.

  • Contact us
  • Jobs
  • Privacy
  • Manage cookies
  • Terms of use
  • Trademarks
© 2025 Microsoft