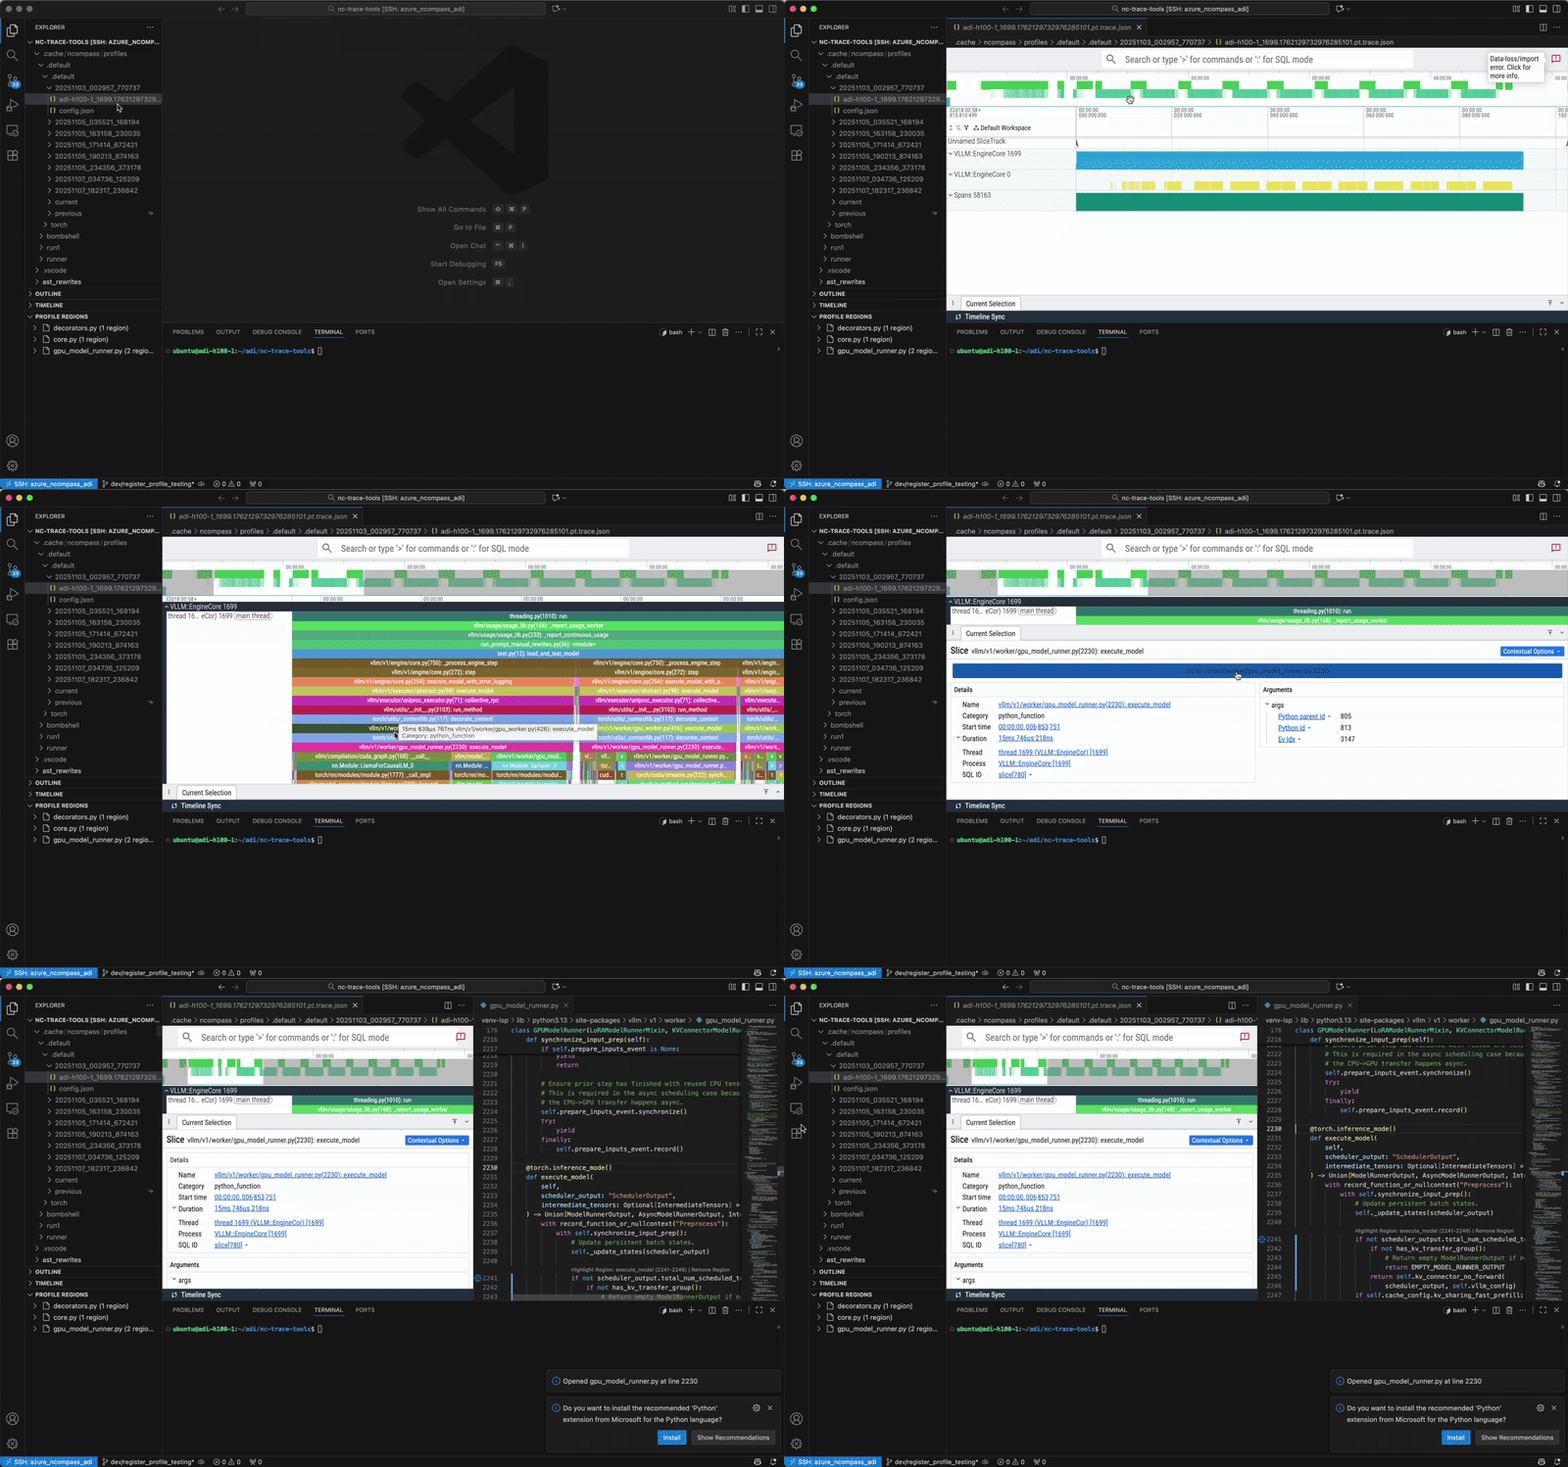
ncprof is a VS Code extension that simplifies profiling CPU-GPU systems. It integrates into a single unified workflow:
- Tracepoint registration
- Code base instrumentation
- Trace visualization
- Performance optimization suggestions (COMING SOON)
Quick Start
How It Works
ncprof consists of two main components that work together:
- VS Code Extension: Provides the user interface for code registration, trace viewing, and backend management
- nCompass SDK: Python library that instruments your code based on ncprof's configuration and captures performance traces
The workflow is simple:
Select code in VS Code and register tracepoints for profiling
Run your code with the ncompass SDK, which automatically injects profiling markers
Getting Started with the SDK: To use our SDK, simply run pip install ncompass and check out examples in our GitHub repository.
View the generated traces in the integrated Perfetto trace viewer
Link events in the trace with regions in your code simply by clicking on them
Build performance optimizations guided by our AI optimization agent (COMING SOON)
Repeat
📍 Register Tracepoints for Profiling
Select any code in your editor and mark it for profiling with a single click. ncprof automatically generates profiling configurations that can be picked up by our SDK. We support adding tracepoints for popular profilers like TorchProfiler and NVTX (coming soon).

How to register a tracepoint:
- Select code in your editor
- Click the lightbulb (💡) that appears and choose "▶ Add Region to Profile"
- Or right-click → "Add Region to Profile"
- Or press
Ctrl+Alt+R (Windows/Linux) or Cmd+Alt+R (Mac)
- Or use Command Palette (
Ctrl+Shift+P) → "NCProf: Add Region to Profile"
View all registered regions in the Profile Regions view in the Explorer sidebar.
🔬 Profile Your Code
Run your favorite profiler with the added tracepoints from the ncompass SDK and get the tracepoints to show up in the new trace. Your codebase isn't edited—the nCompass VS Code extension and SDK manage and inject profiling tracepoints only at runtime.
Backend Setup:
The profiling features require a Docker Compose-based backend. The extension provides commands to launch and manage this infrastructure:
- Start Backend: Command Palette → "NCProf: Start Profiler Backend (Docker)"
- Stop Backend: Command Palette → "NCProf: Stop Profiler Backend"
- Check Status: Command Palette → "NCProf: Check NCProf Backend Status"
Prerequisites:
- Docker (20.10 or higher)
- docker-compose (v2.0 or higher)
📊 View Interactive Traces
Open and explore trace files with a trace viewer built into VS Code. Navigate from trace events directly to your source code.

How to view traces:
- Right-click on a
.json or .gz trace file and select "Open With..." → "GPU Trace Viewer"
- Or use Command Palette (
Ctrl+Shift+P) → "NCProf: Open GPU Trace"
Trace viewer features:
- Industry-standard Perfetto UI controls
- Zoom with WASD keys or mouse wheel
- Pan by dragging
- Select events to see details in bottom panel
- Search events with
Ctrl+F
- Navigate to source code by clicking on events
Supported formats:
.json - Plain JSON trace files (Chrome Trace format)
.gz - Gzip-compressed trace files (automatically extracted)
The extension supports Chrome Trace format, which is the standard output from:
- PyTorch Profiler (
torch.profiler)
- Chrome DevTools
- TensorFlow Profiler
- Other tools supporting the trace event format
Get hints on bottlenecks and solutions for improving the performance of your system after our AI agent analyzes your trace data and code base.
Key Features
- One-Click Tracepoint Registration: Select code and register it for profiling via context menu, lightbulb actions, or keyboard shortcuts
- Profile Regions View: Visual tree view of all registered tracepoints organized by file
- Automatic Configuration: Use our SDK to run profile with added trace markers without editing the codebase
- Built-in Trace Viewer: Professional-grade trace visualization powered by Perfetto
- Code Navigation: Jump from trace events directly to the relevant source code
Configuration
The extension provides several configuration options accessible via VS Code Settings (Ctrl+, or Cmd+,):
Trace Viewer Settings
ncprof.viewer.groupBy: Group events by thread ID (standard Chrome trace behavior)
Profiler Integration Settings
ncprof.profiler.profileName: Profile name for registering code regions (default: .default)
ncprof.profiler.profileType: Profile type for registering code regions (default: .default)
Backend Infrastructure Settings
ncprof.backend.autoStart: Automatically launch the Docker backend infrastructure on extension activation (default: false)
Navigation Settings
ncprof.navigation.packageSearchPaths: Additional paths to search for Python packages (supports ${workspaceFolder} variable)
ncprof.navigation.showStdlibWarning: Show informational message when attempting to navigate to Python standard library files (default: true)
Trace Directory Settings
ncprof.traceDirectory: Directory path where traces are located. Use the "NCProf: Change Trace Directory" command to change it.
Documentation
For detailed documentation, tutorials, and advanced usage, visit our official documentation.
Commands
Access commands via the Command Palette (Ctrl+Shift+P or Cmd+Shift+P):
- NCProf: Open GPU Trace - Open a trace file in the viewer
- NCProf: Add Region to Profile - Register selected code for profiling
- NCProf: Clear All Profiler Registrations - Remove all registered regions
- NCProf: Start Profiler Backend (Docker) - Launch the profiling backend
- NCProf: Stop Profiler Backend - Stop the profiling backend
- NCProf: Restart Profiler Backend - Restart the profiling backend
- NCProf: Check NCProf Backend Status - Check backend health and configuration
- NCProf: Change Trace Directory - Set the directory where traces are located
- NCProf: Update User Email - Update your user email for profiling
- NCProf: Refresh Profile Regions - Refresh the Profile Regions view
About nCompass
ncprof is built by nCompass Technologies, focusing on tools that help developers optimize GPU workloads efficiently.
Support
For issues, questions, or contributions, please visit our Community page or check the documentation.