Codescape
Navigate your way through any codebase.
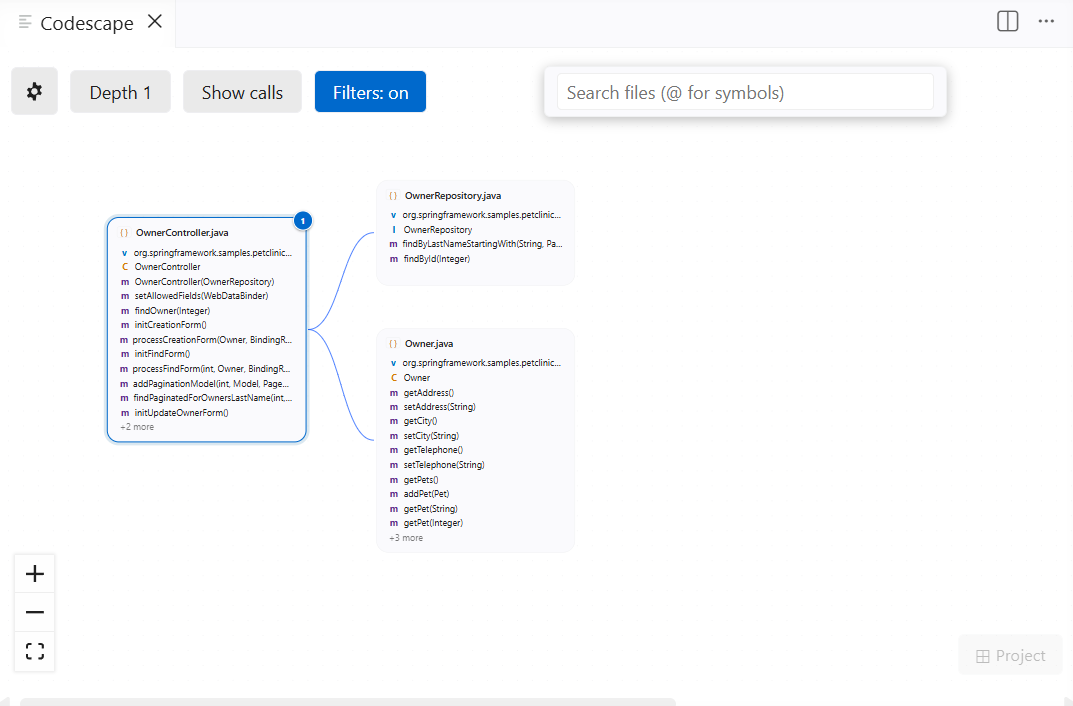
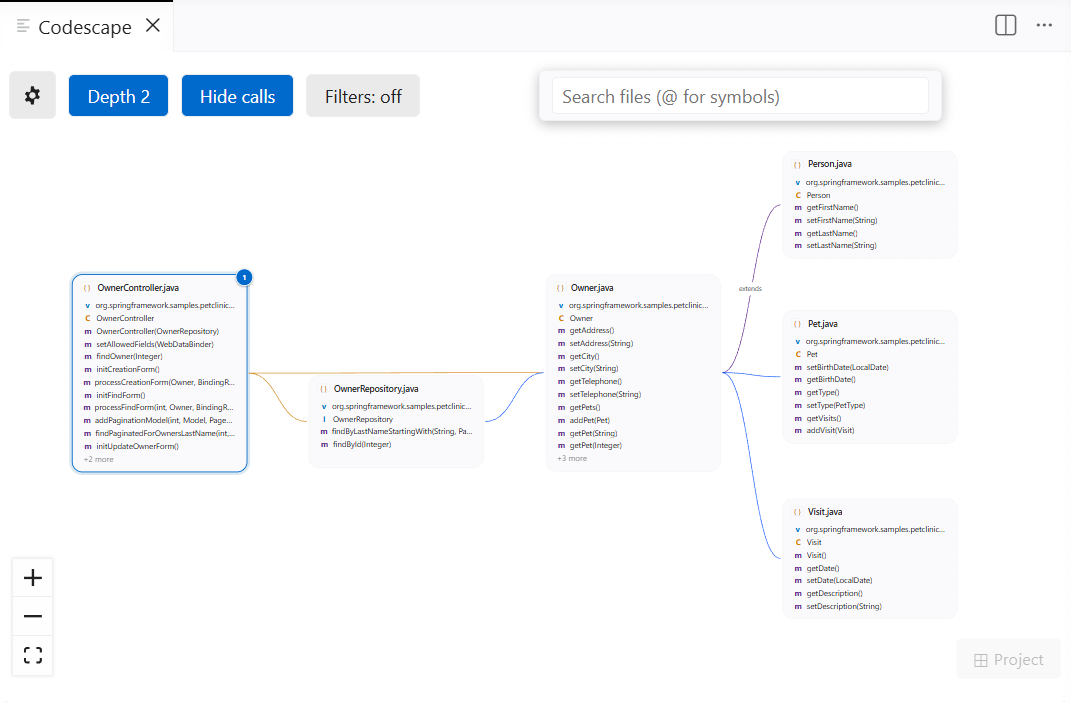
Codescape renders an interactive canvas around the file you're editing. Its classes, functions, and methods appear inside a node; the files it imports fan out as neighbours connected by edges. Click any neighbour to explore further. The graph grows as you go.
No account. No config file. Runs locally. No data collected.
Supports TypeScript · JavaScript · Python · Java
Features
Interactive file graph
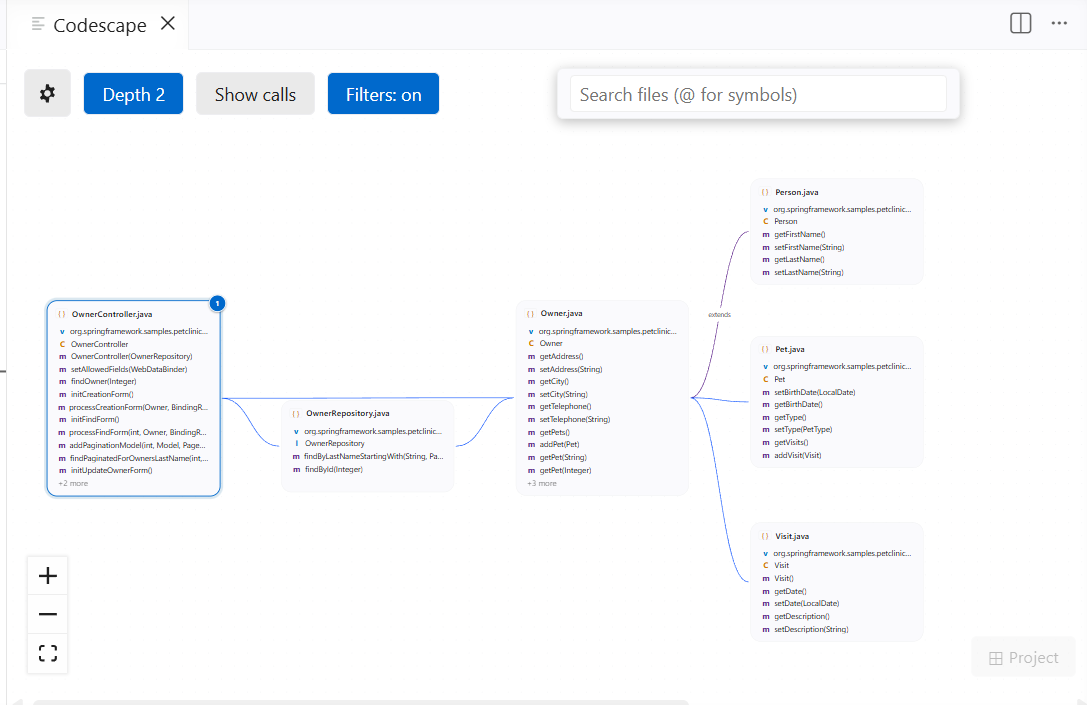
Open any file and the graph builds instantly. No config, no index, no waiting. The active file sits at the centre; everything it imports fans out around it. Edges show import direction; purple edges mark inheritance (extends), teal dashed edges mark interface implementation (implements).
Navigation
- Click a node to recenter the graph on that file
- Double-click any symbol to jump to that exact line in the editor
Ctrl+Alt+G / Cmd+Alt+G to open the graph at any time
Depth control
Switch between depth 1 (direct imports only), depth 2 (their imports too), or depth 3 with the pill button at the top of the canvas.
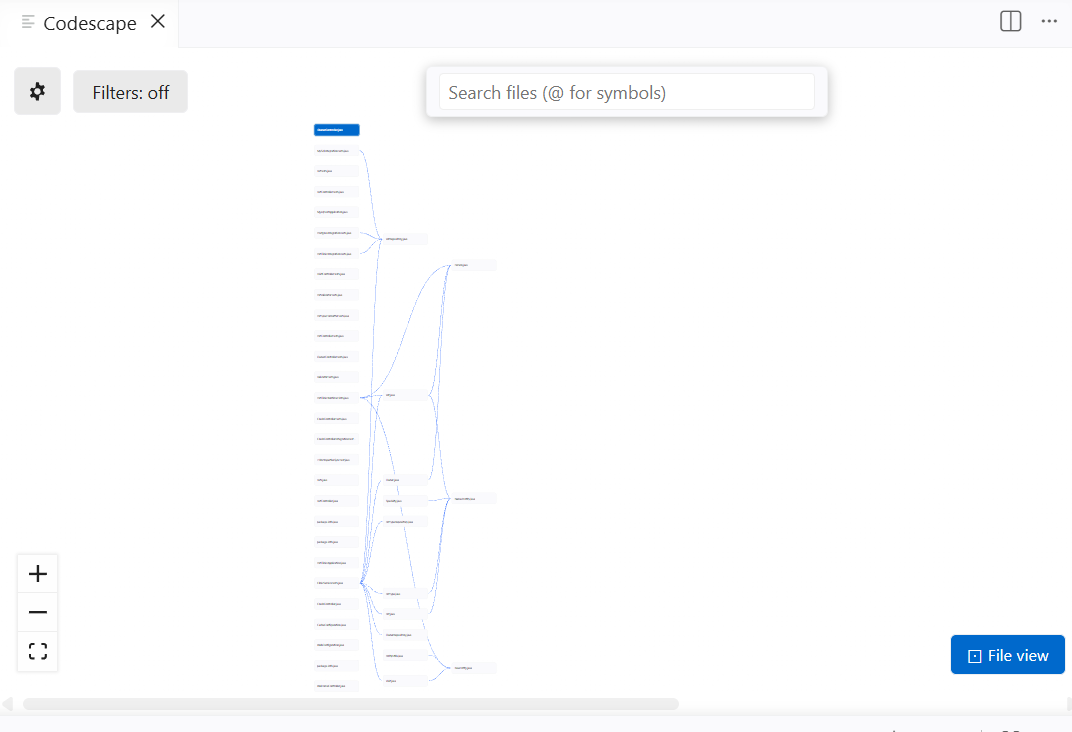
Full-project graph
Press the ⊞ Project button to see every file in your workspace at once. Up to 200 files (configurable), compact pill nodes, active file highlighted in blue. Click any node to open that file and return to file view.
Call graph
Toggle Show calls to overlay function-level call edges (orange) on top of the import graph. See not just which files depend on each other but which functions actually call which.
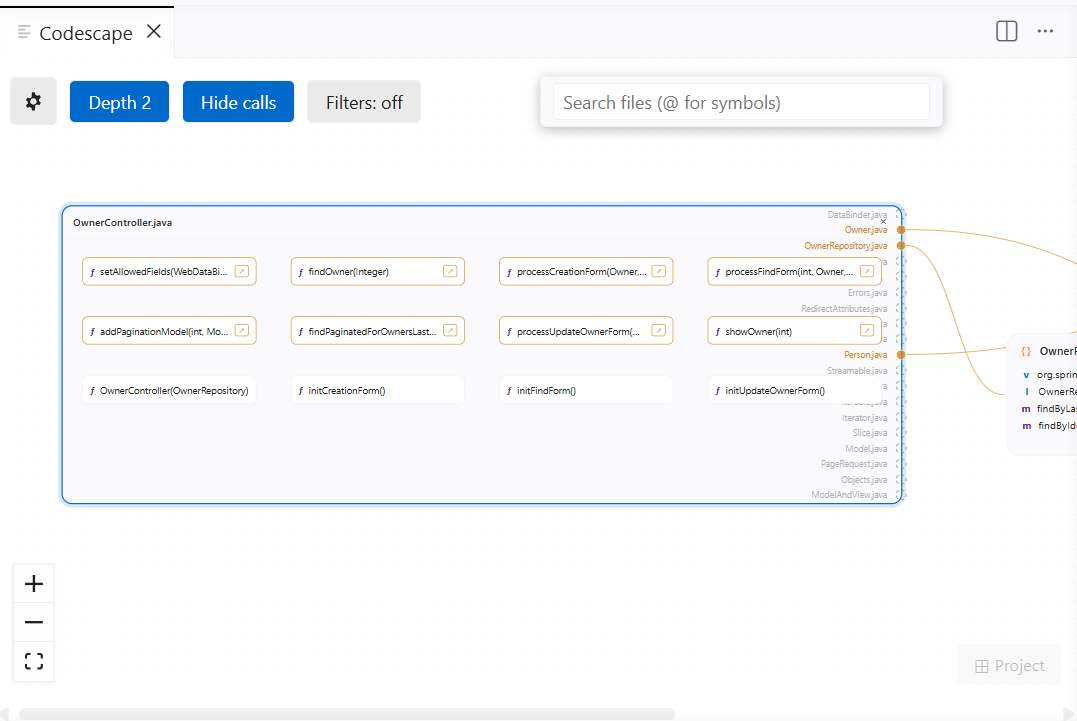
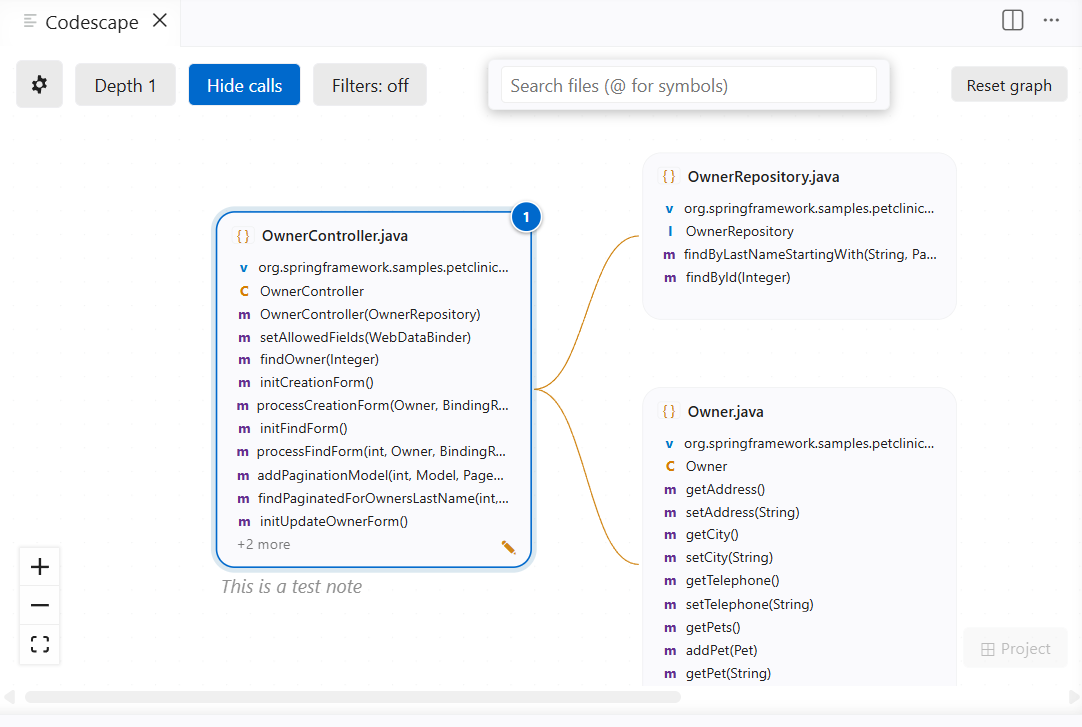
Inside-file expand
Click { } on any node to explode it into a detailed view: one pill per function, intra-file call edges drawn inside, cross-file call targets shown as named handles on the group border.
Live debugger highlight
Start a debug session and Codescape highlights the call stack on the graph in real time. No extra setup needed. The paused file glows amber; every file in the current call stack gets a faint amber tint; function pills on the stack are highlighted inside expanded nodes.
Works with any language VS Code can debug: TypeScript, JavaScript, Python, Java.
Graph snapshots
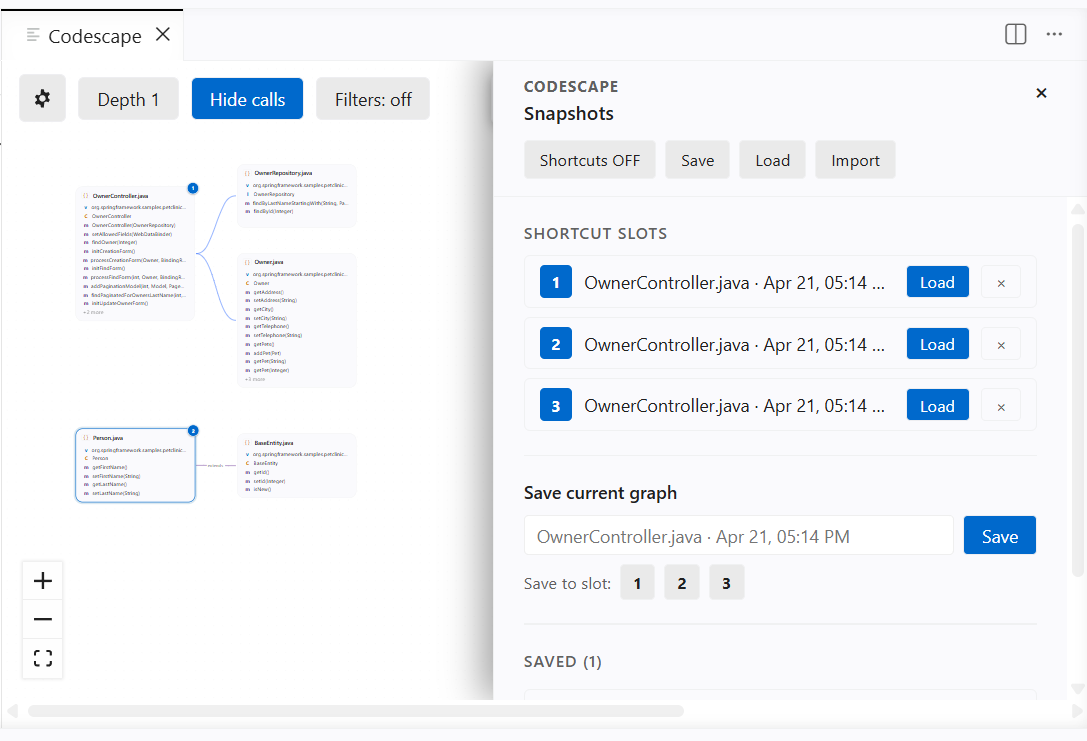
Save the current graph (node positions, layout, annotations) as a named snapshot. Load it back later with one click, or use one of three keyboard shortcut slots for instant recall.
Export snapshots as .codescape files to share with your team or archive alongside a git branch.
Node annotations
Hover any node and click the pencil icon to attach a personal note. Pin it so it always shows, or leave it hover-only. Annotations persist across sessions.
Export to SVG
Gear → Export SVG captures the full graph (not just the visible viewport) and opens a save dialog. The exported file includes a Codescape brand label and works in any browser or vector editor.
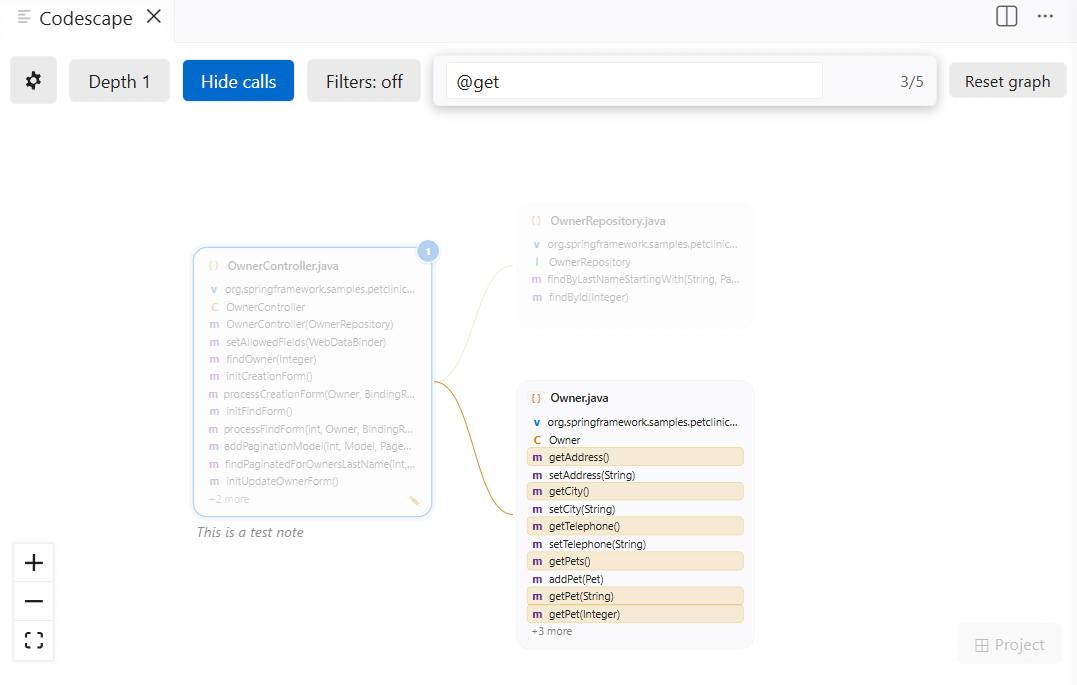
Search
Press Ctrl+F inside the graph panel to filter nodes live. Match by file name or prefix with @ to match symbol names (VS Code quick-open convention). Non-matching nodes dim to 30%; matching nodes get a yellow accent border.
Exclude patterns
Noise like node_modules, test files, and build output is hidden by default. Edit the patterns under Gear → Filters, stored in VS Code's User or Workspace settings so they sync with your profile and apply per-project. Toggle the master Filters: on/off button on the canvas to temporarily show everything without editing the list.
Getting started
- Open any TypeScript, JavaScript, Python, or Java file.
- Press
Ctrl+Alt+G (macOS: Cmd+Alt+G) or run Codescape: Show Graph from the command palette.
- Click any node to navigate. Double-click a symbol to jump to that line.
No account. No config file. Works on first run.
Keyboard shortcuts
| Action |
Shortcut |
| Open graph |
Ctrl+Alt+G / Cmd+Alt+G |
| Focus search box |
Ctrl+F (inside the panel) |
| Clear search |
Esc |
Settings
All settings live under the codescape.* prefix in VS Code settings and can be set at User or Workspace level.
| Setting |
Default |
Range |
Description |
codescape.nodeCap |
42 |
5–99 |
Max nodes shown at depth 2/3 |
codescape.accumulationCap |
60 |
10–200 |
Max nodes kept on canvas as you navigate |
codescape.projectNodeCap |
200 |
50–500 |
Max files shown in project graph |
codescape.functionCap |
20 |
5–100 |
Max functions shown in inside-file expand |
codescape.symbolsPerNode |
12 |
3–30 |
Max symbol rows per node |
codescape.maxSnapshots |
20 |
5–100 |
Max snapshots kept in the panel |
codescape.excludePatterns |
(defaults) |
— |
Glob patterns for files hidden from the graph |
Supported languages
Codescape delegates all parsing to VS Code's language server APIs. No bundled parser, no language-specific config.
Known limitations
- Depth-2 and depth-3 expansions are capped (configurable via
codescape.nodeCap). Very large graphs may not show every file.
- Cross-project snapshot imports render correctly but file-open will fail for paths that don't exist in the current workspace.
- Git diff / architecture-change comparison between commits is planned but not yet available.
Feedback
Found a bug or have a feature request? Open an issue on GitHub.
