PostgreSQL Tools is a VS Code extension that simplifies PostgreSQL database management with an intuitive and powerful interface — connect, explore, query, and visualize your data right inside VS Code.
Screenshots
✨ Features
🗂️ Database Explorer — Browse databases and tables in a tree view within the VS Code sidebar.
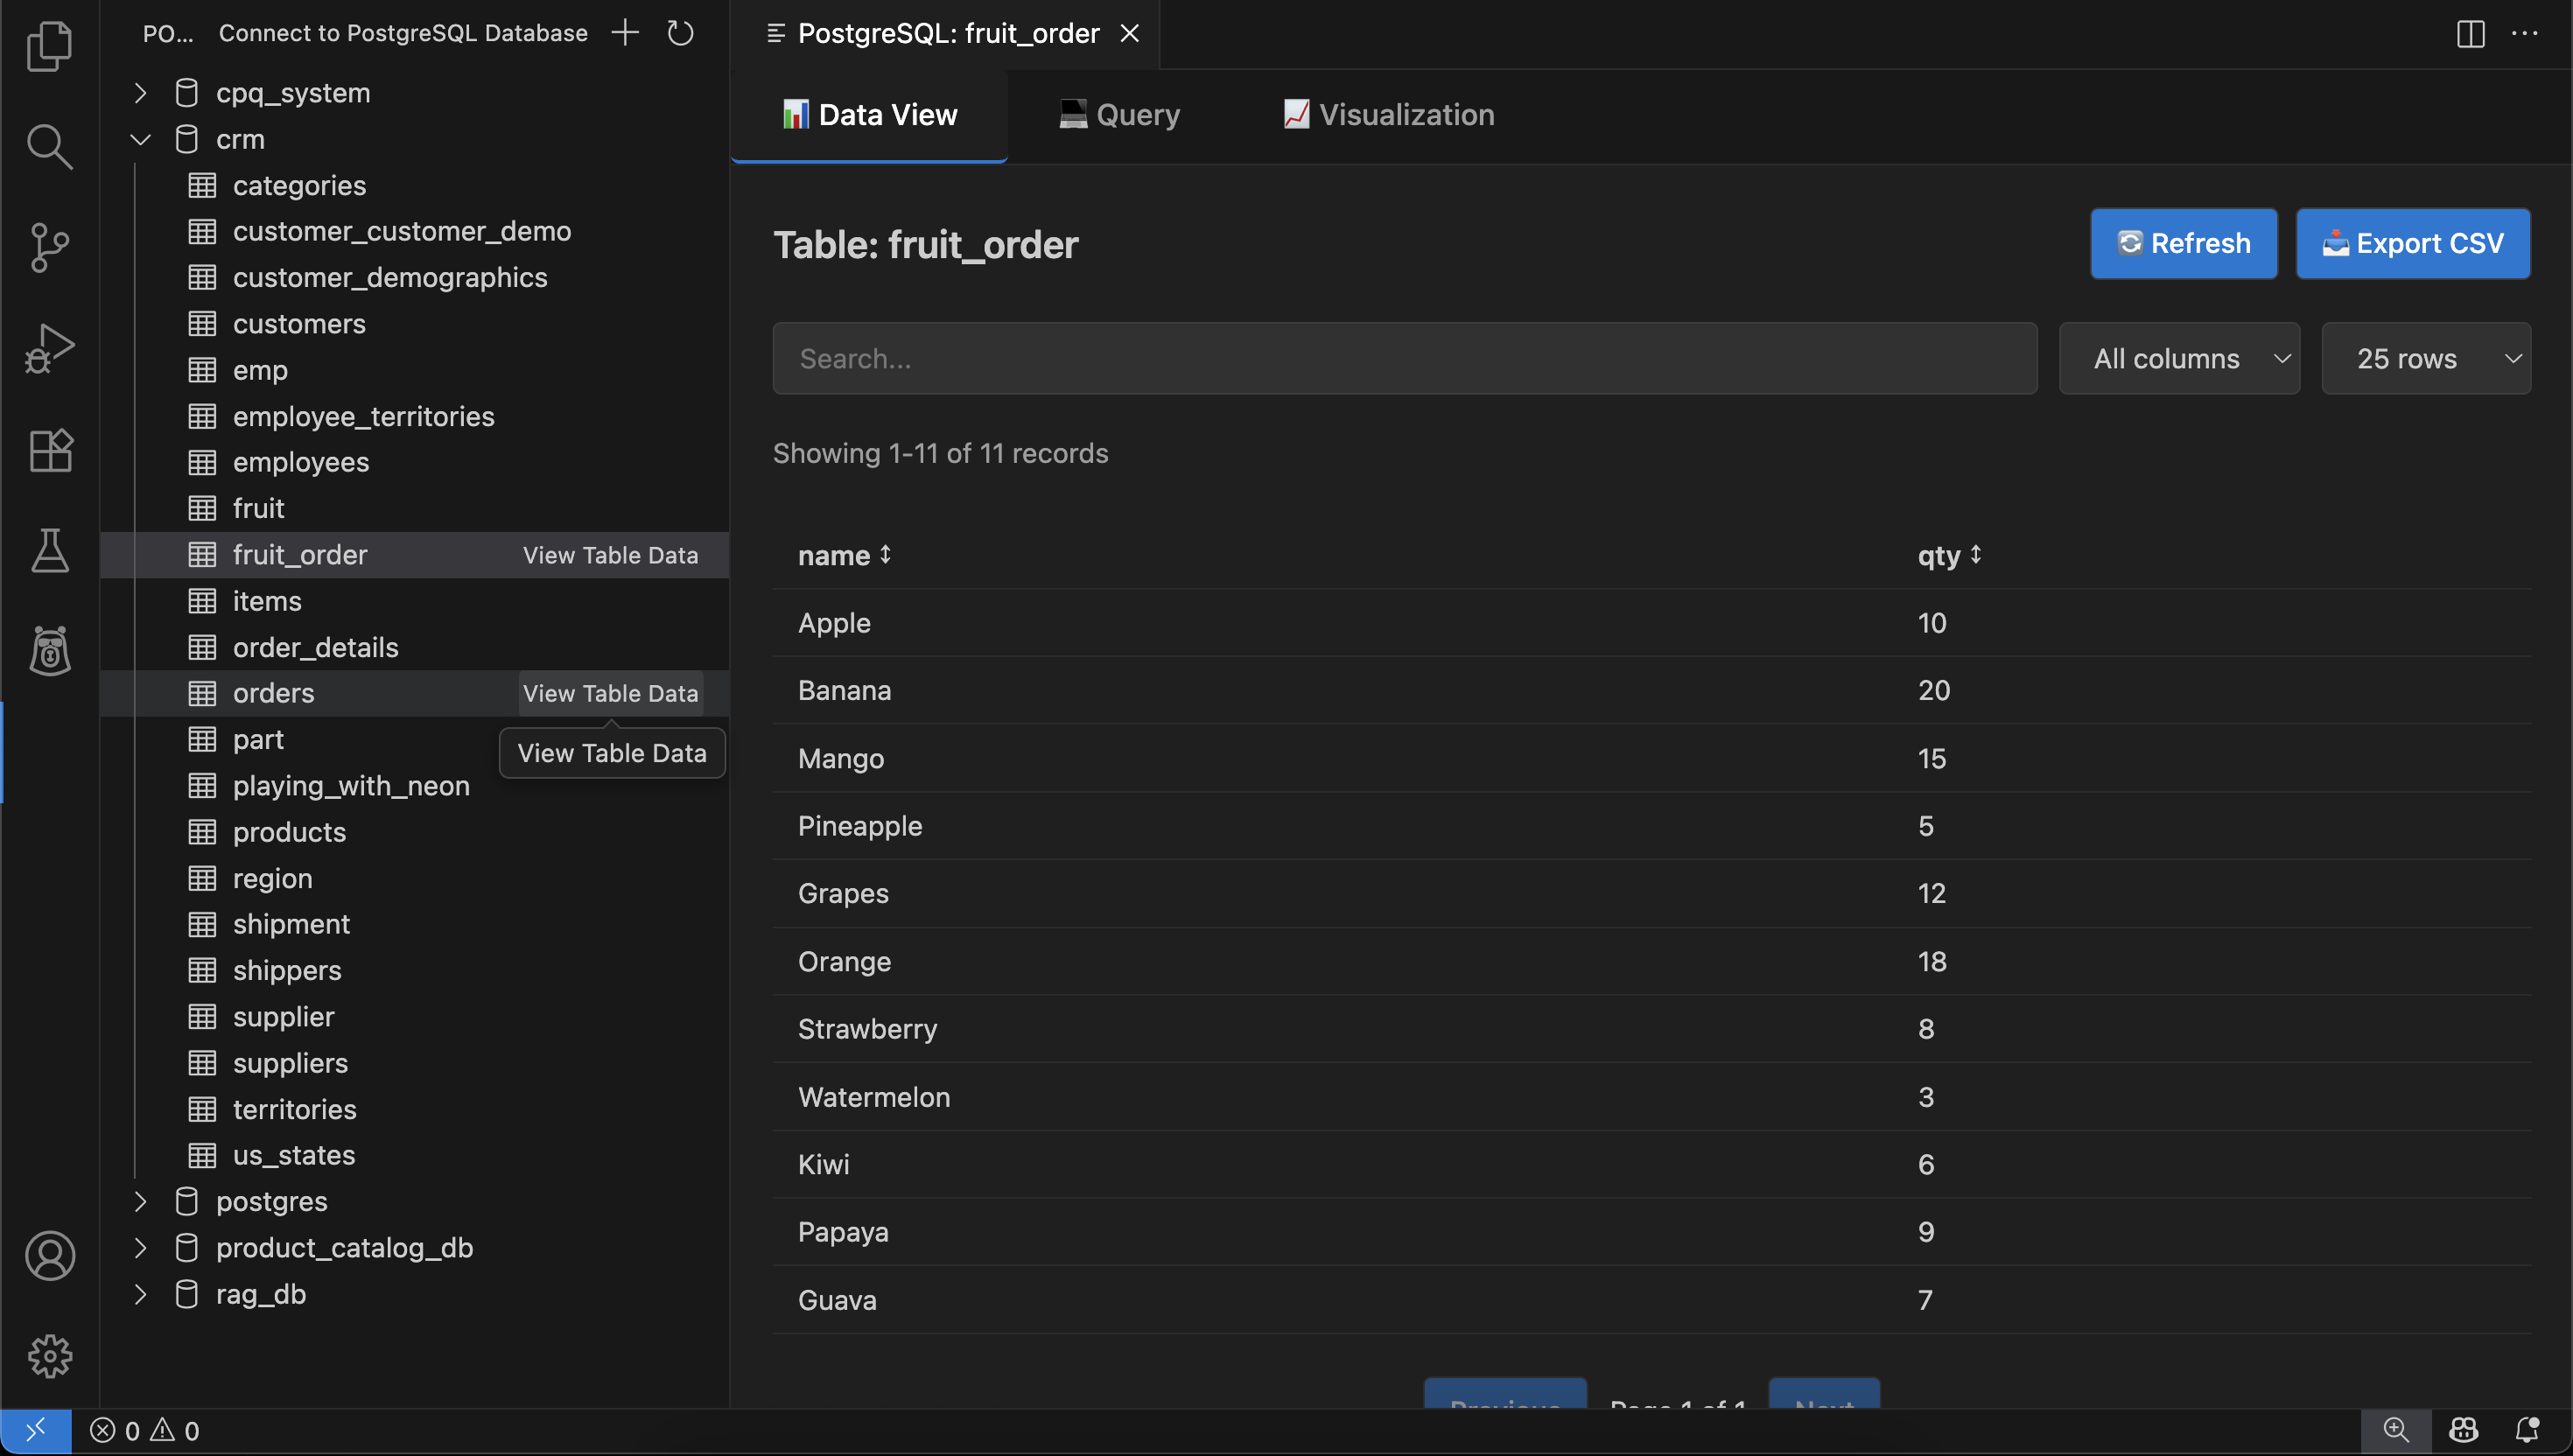
🔍 Table Data View — Display table data with search, sorting, and pagination.
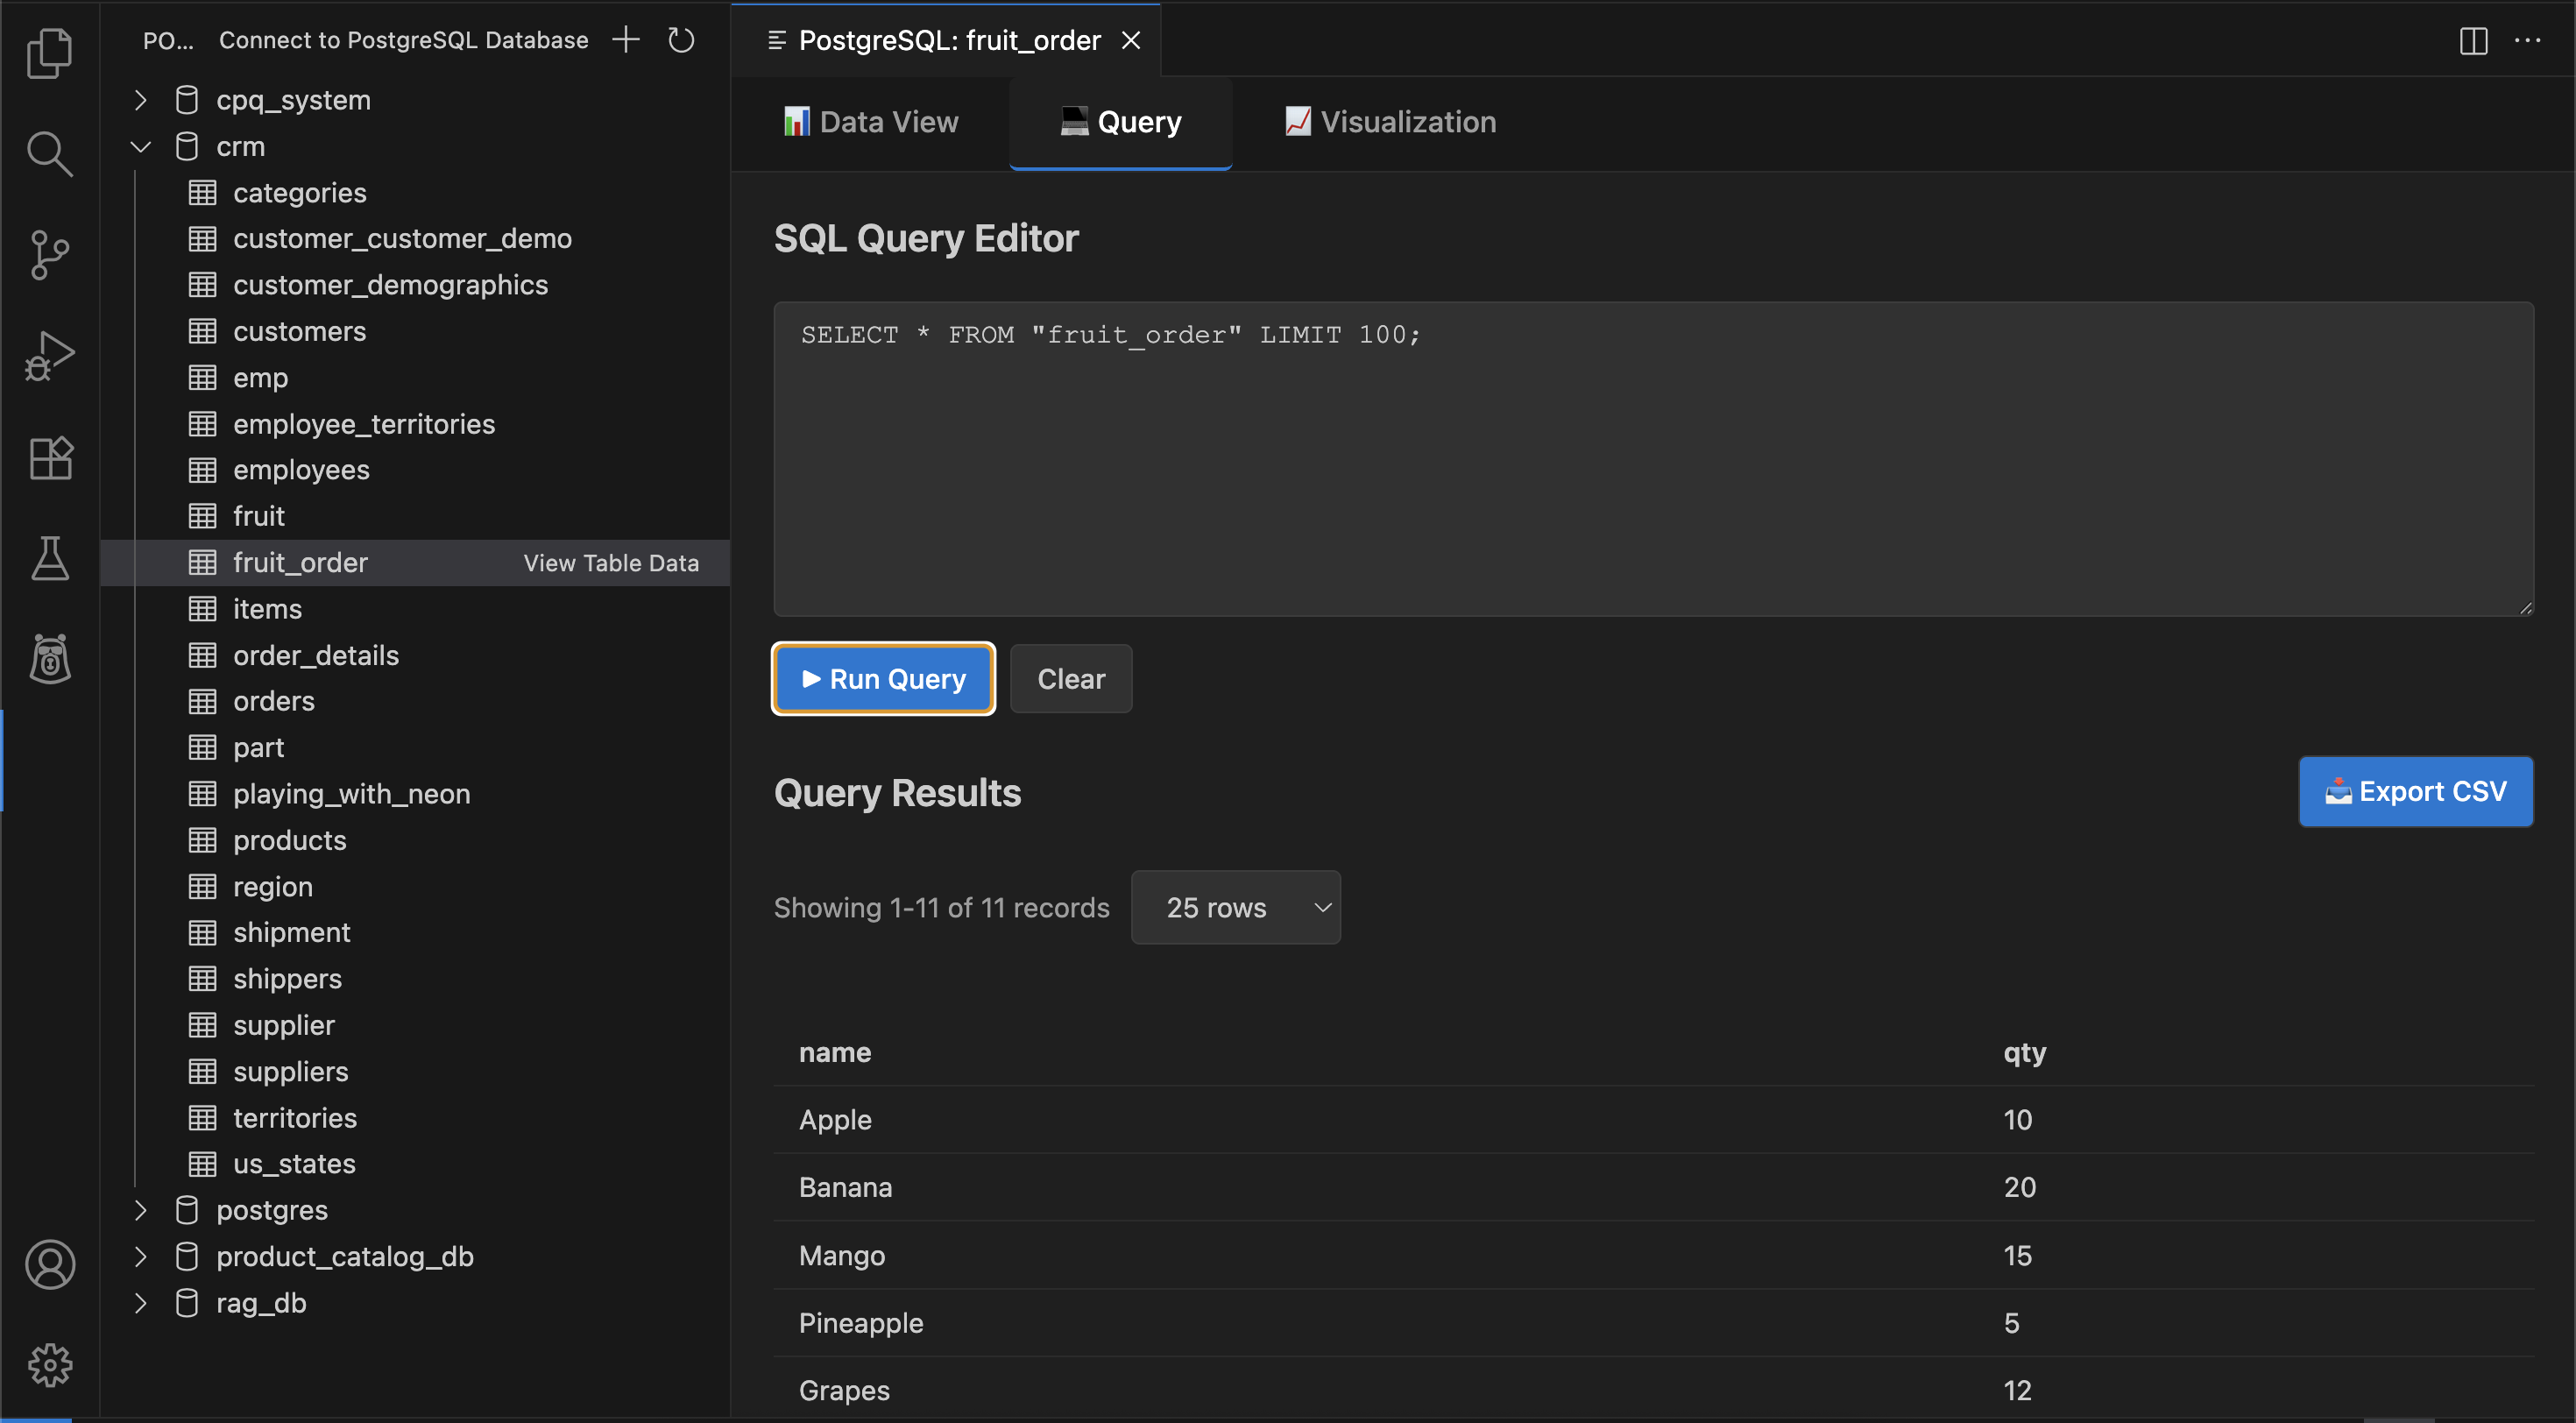
💻 SQL Query Editor — Run custom SQL queries and view results in a tabulated format.
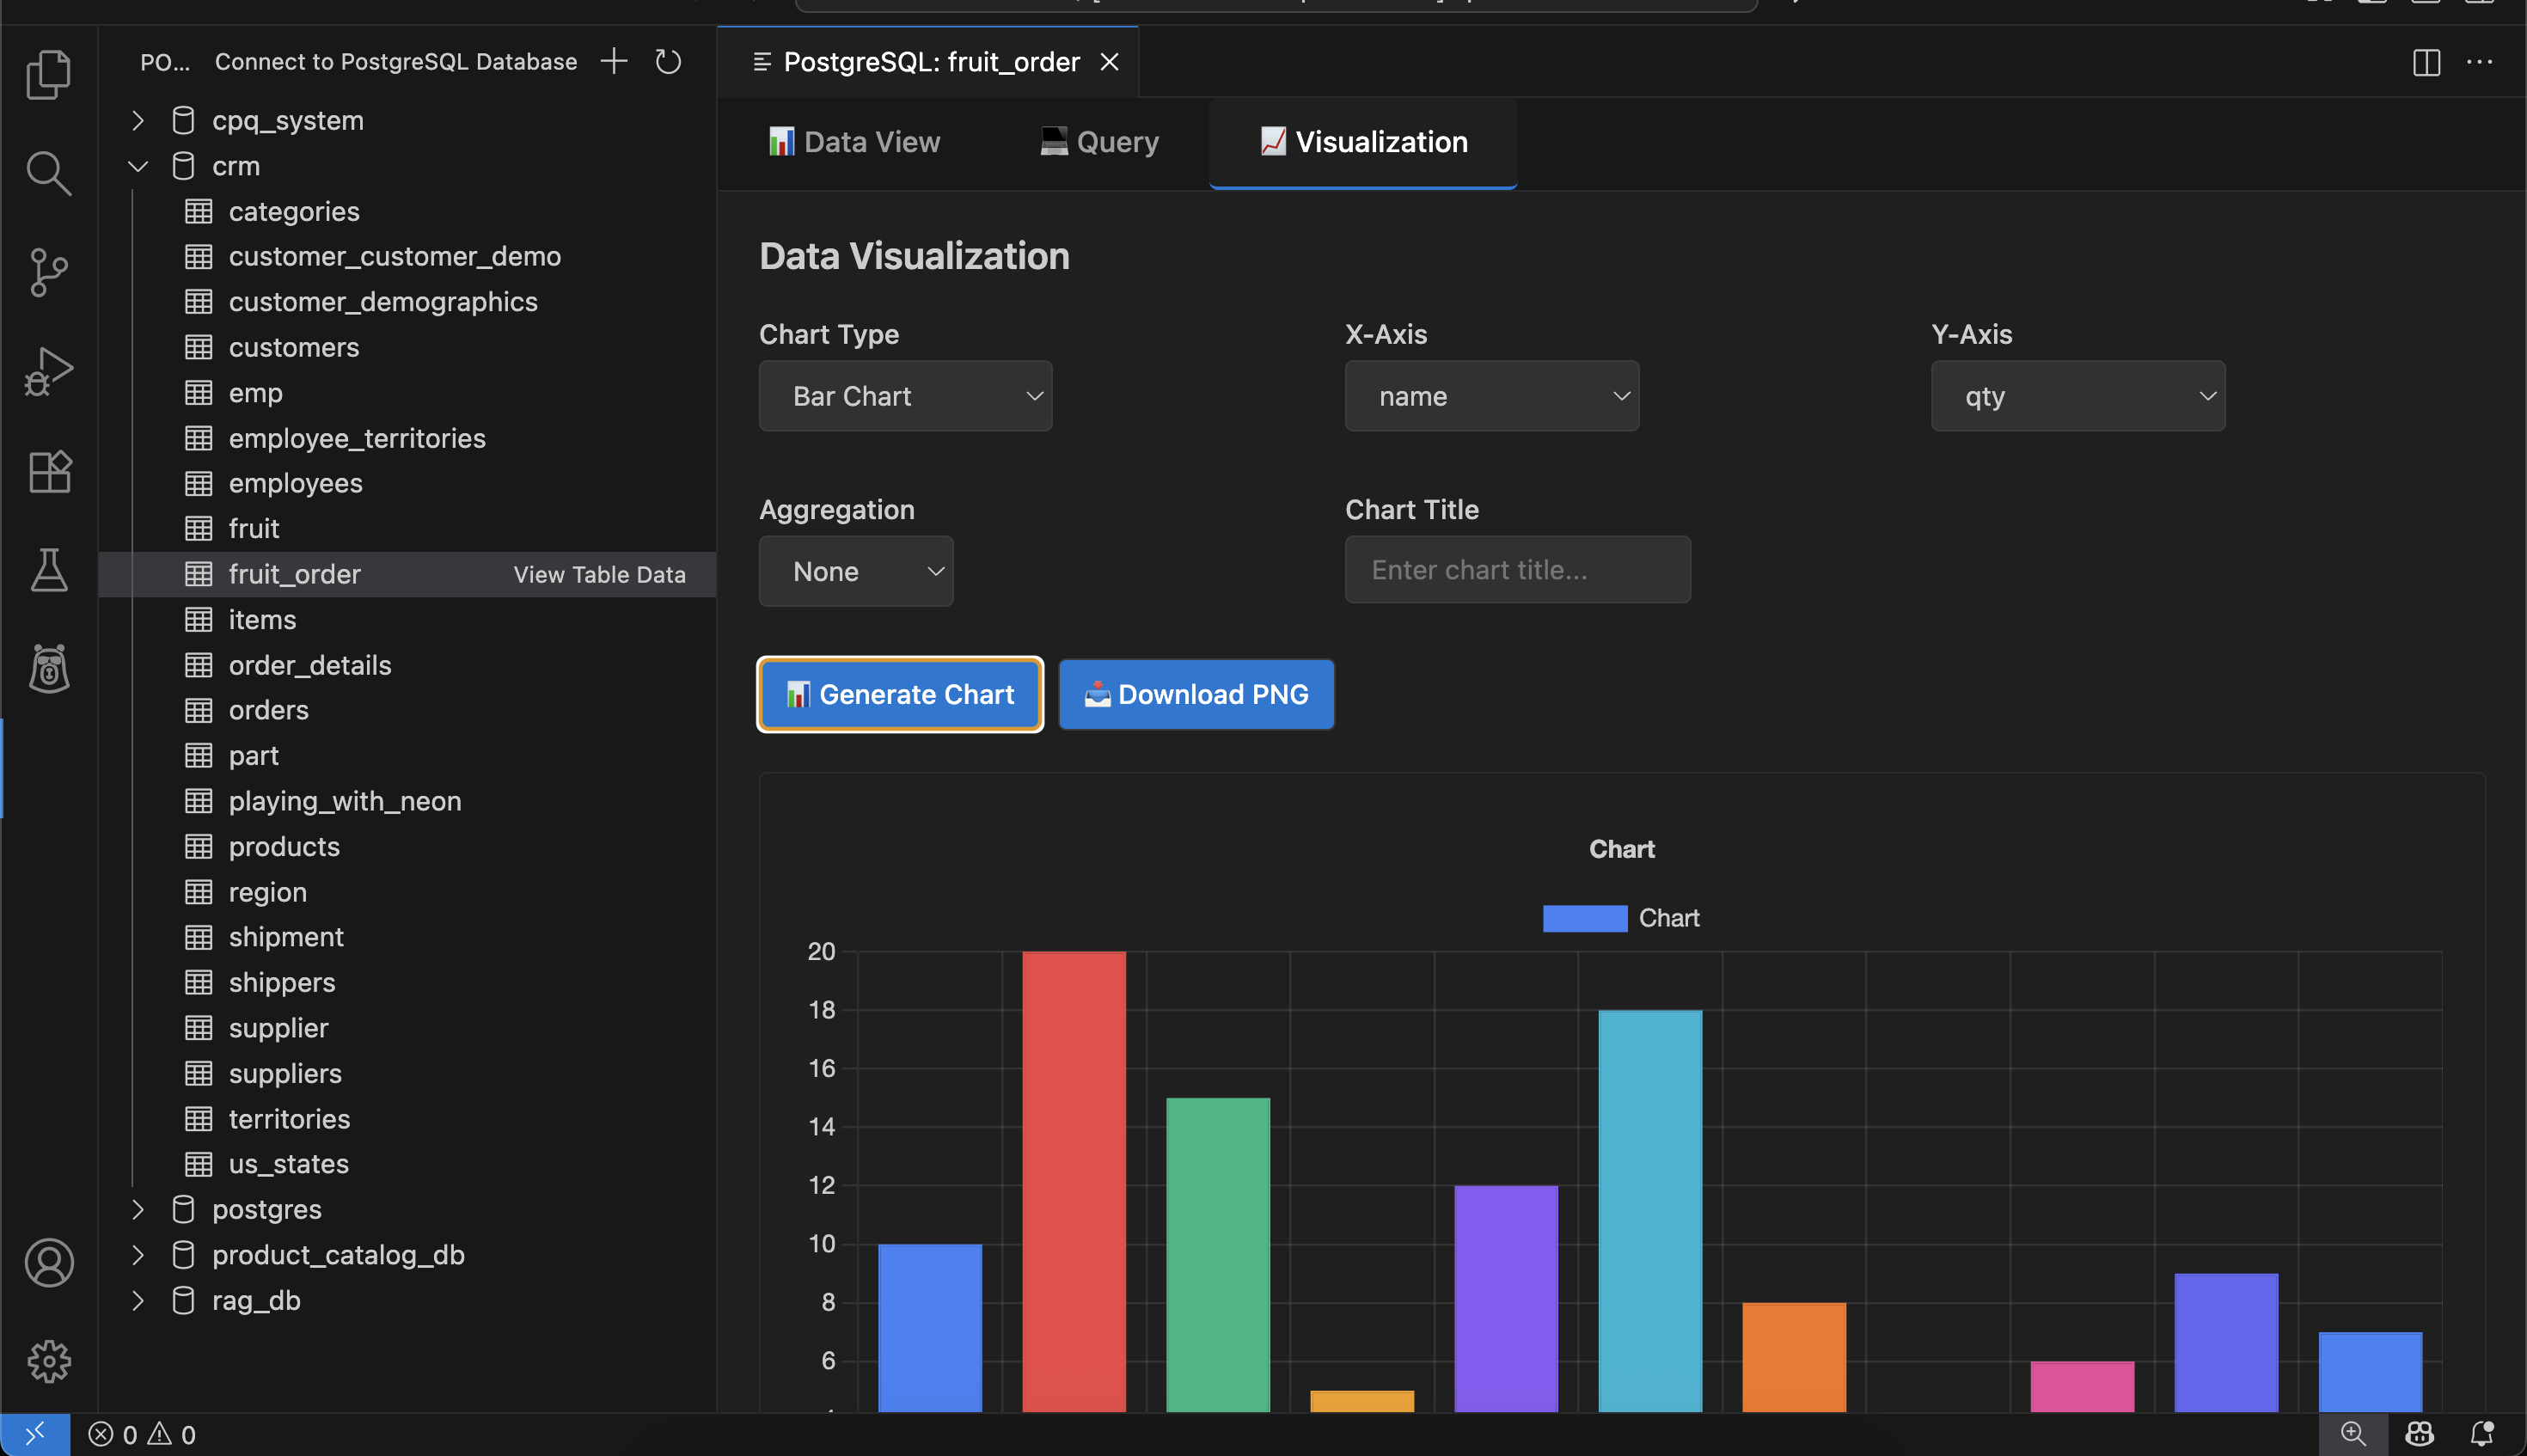
📊 Data Visualization — Create bar, line, pie, doughnut, and scatter charts with flexible axes and aggregations.
📁 Export Options — Export table data or query results to CSV, and download charts as PNG.
🔐 Connection Management — Easily connect to PostgreSQL databases with configurable host, port, username, password, and database name.
⚙️ Installation
1️⃣ Install the Extension
Open Visual Studio Code
Go to the Extensions View → Ctrl+Shift+X (or Cmd+Shift+X on macOS)
Search for “PostgreSQL Tools”
Click Install
2️⃣ Prerequisites
🧱 A running PostgreSQL server
🟩 Node.js (included in VS Code runtime)
📦 The extension bundles the pg library (v8.11.0 or higher)
🚀 Usage Guide
🔗 1. Connecting to a Database
Open the PostgreSQL Tools view in the sidebar (look for the 🐘 icon)
Click “Connect to PostgreSQL Database”
Enter connection details:
Host: e.g. localhost
Port: default 5432
Username: e.g. postgres
Password: your database password
Database Name: optional
✅ On successful connection, the explorer will display your available databases.
🗂️ 2. Exploring Databases and Tables
Expand a database to see its tables.
Click on a table to open its Data View in a new panel.
Interactively search, sort, and paginate through your data.
🔍 3. Viewing Table Data
Inside the Data View tab:
Search: Filter rows by keyword or column
Sort: Click on column headers
Paginate: Choose page size (25, 50, 100)
Export: Click “Export CSV” to save results
💻 4. Running SQL Queries
In the Query Editor tab:
Enter your SQL query (e.g. SELECT * FROM employees LIMIT 100)
Click Run Query ▶️
View results in a grid
Export CSV or Clear the editor anytime
📊 5. Visualizing Data
In the Visualization tab:
Choose Chart Type: Bar, Line, Pie, Doughnut, or Scatter
Select X-Axis and Y-Axis fields
Pick an Aggregation (Sum, Count, Avg, Min, Max)
Add an optional Chart Title
Click Generate Chart to render
🖼️ Download PNG for your chart
🔌 6. Disconnecting
Click “Disconnect from Database” to safely close your session.
🧭 Commands
Access these via the Command Palette (Ctrl+Shift+P / Cmd+Shift+P):
Command
Description
PostgreSQL: Connect to Database
Connect to a PostgreSQL server
PostgreSQL: Disconnect from Database
End the active session
PostgreSQL: Refresh Explorer
Refresh database and table list
PostgreSQL: View Table Data
Open data view for a selected table
PostgreSQL: Open Query Editor
Open the SQL editor
PostgreSQL: Visualize Data
Switch to chart visualization tab
🧾 Requirements
🧩 VS Code v1.60.0 or higher
🐘 PostgreSQL server accessible over the network
No extra extensions required
⚠️ Known Issues
� Saved connection configurations (pg-tools.connections) not persistent yet
�🐢 Large datasets (>1000 rows) may impact performance
📜 License
This extension is licensed under the MIT License.
See the LICENSE file for details.
🧠 Tip
Combine PostgreSQL Tools with VS Code’s built-in terminal for the ultimate SQL + code workflow 🚀