gnu-debuggerJLink GNU debugger for Visual Studio Code. Installation Launch VS Code Quick Open ( Ctrl+P), paste the following command, and press enter.Copied to clipboard |
GNU source level debugger for Visual Studio CodeThis extension for Visual Studo Code enables debugging of bare metal C/C++ programs for microcontrollers. The extension implements the Visual Studio Code debug adaptor for Arm embedded processors. This extension is suited for macOS, Linux and Window. 

The adaptor uses the GNU source level debugger (GDB) that enables examination of your running program. You can find background documentation about the GNU source level debugger here. Dependencies
If you have a development board with an onboard ST-Link debug probe you can upgrade the firmware to J-Link. More information for upgrading to J-Link may be found here. Features
Output formatVisual Studio Code has no standard way to set the format of variables. In this extension you can change the output format with a number prefix. 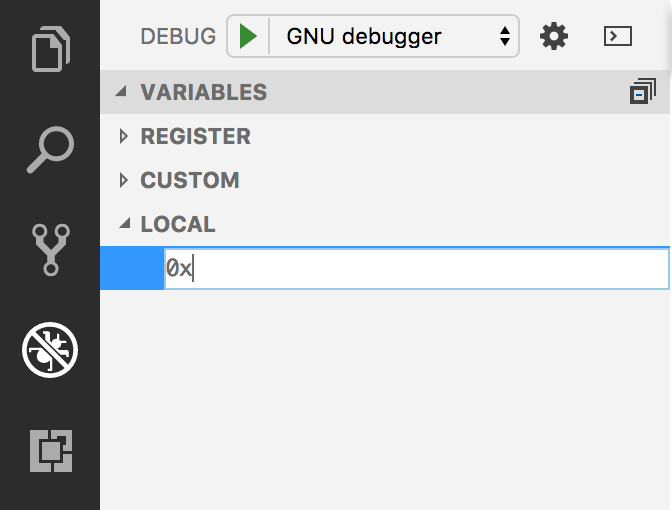
Use the following number prefixes:
Custom variablesTo view/change global variables on every debug session add a customVariables list to the launch.json. 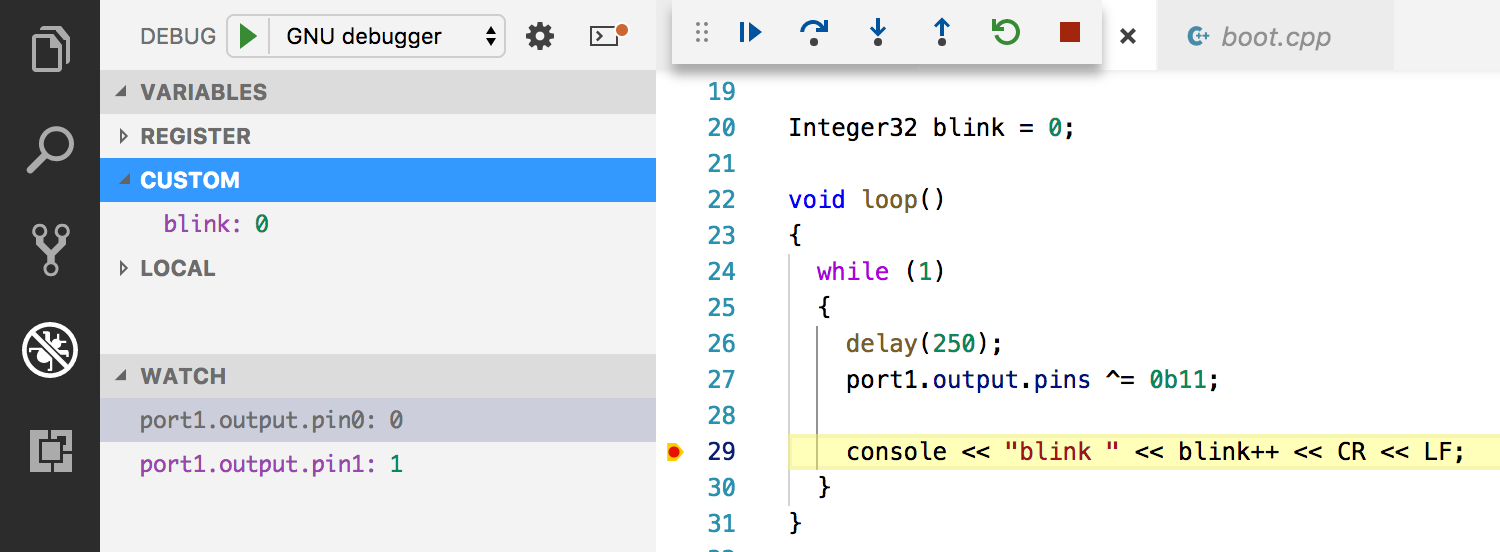
Here is an example launch.json for the Infineon XMC 2Go a low cost board with an Arm Cortex-M0 processor. 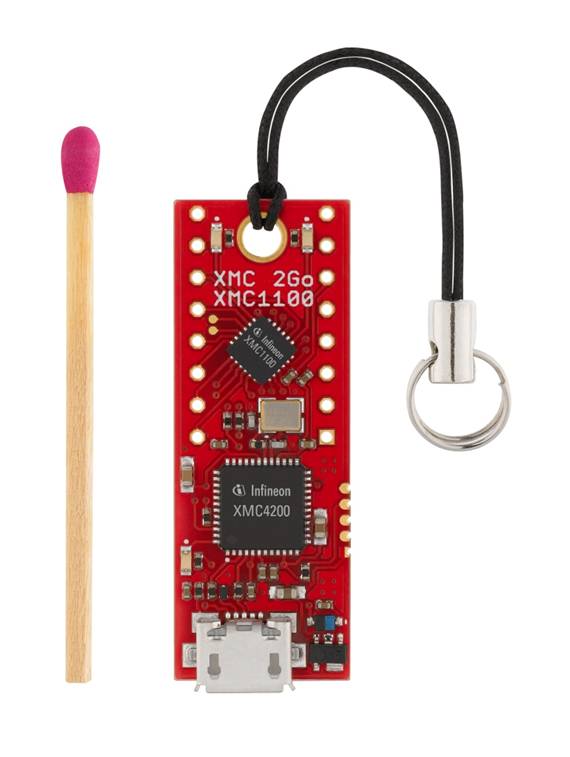
Principle of operationThe extension uses the machine oriented text interface of the GNU source level debugger (GDB/MI). The adaptor translates workbench.action.debug commands to GDB/MI commands and translate GDB/MI outputs to graphical representation inside Visual Studio Code. For Arm embedded platforms the GNU source level debugger consists of two parts:
Both programs must be installed on your development system. GDB clientThe GDB client is supplied by Arm free of charge as part of the Arm embedded toolchain. For convience I have packaged the latest toolchain for different operating systems as Visual Studio Code extension as mentioned in the dependencies section. You can find GDB client for Arm embedded processors under the bin directory of the toolchain. The name of the GDB client program is:
The GDB client communicates with a GDB server through a network connection (TCP/IP socket). GDB serverThe GDB server is supplied by the manufacterer of the debug probe. The most widely used lines of debug probes are the J-Link and ST-Link debug probes. The name of the SEGGER J-Link GDB server program is:
If you have a development board with an onboard ST-Link debug probe you can upgrade the firmware to J-Link. More information for upgrading to J-Link may be found here. OpenOCDThe Open On-Chip Debugger supports a large amount of debug probes. Starting from Version 0.0.5 you can use OpenOCD as GDB server. Release NotesVersion 1.0.4Strip namespace from enumerates. Version 1.0.2Updated several dependencies to the latest version. Version 1.0.1Removed depences on vscode and changed it to @types/vscode. Version 1.0.0Updated several dependencies. Version 0.0.7Added gdbCommands to support PSoC 6. Version 0.0.5OpenOCD support. Version 0.0.4Some of the dependencies required an update because they contained vulnerabilities. Changed several devDependencies. Version 0.0.3Changes in visual studio code 1.28.1 caused a problem. Updated all vscode dependencies to the latest version. Version 0.0.2Fixed a bug causing a error message "resource is not available". This problems shows when you have a source file compiled without debug information. Visual Studio code now shows "Unknown Source" if the debug information is missing. Version 0.0.1First version tested on macOS, Linux and Windows. |