 | Blindspot: Know Your CodeLocal line visibility tracking and study guides for agent-assisted code. Installation Launch VS Code Quick Open ( Ctrl+P), paste the following command, and press enter.Copied to clipboard |

Blindspot: Know Your CodeKnow which parts of your codebase you have actually had on screen. AI coding agents can change a project faster than you can inspect it. Blindspot makes that visibility gap concrete. It tracks the source lines displayed in VS Code during opt-in recording, maps the parts you have and have not seen, and helps you work through the gaps with file details and structured study guides. Blindspot works alongside any coding agent. It observes editor activity rather than depending on a particular agent's conversation logs.
Screenshots use sample data. Colors represent display coverage, not authorship. Get started
Requires VS Code 1.95+ and Git on macOS or glibc-based Linux, with an ARM64 or x64 processor. Python is included. There is no account, API key, pip install, Node installation, terminal server command, or connection-file setup. For a downloaded release package, use Extensions → … → Install from VSIX and choose the package matching your operating system and processor. Marketplace selects the matching package automatically. The local server starts when you open Blindspot and uses an available loopback port. First launch unpacks the included runtime locally; it downloads nothing. Closing the VS Code window stops the server it started. Your project history persists, but recording does not automatically resume when you reopen the window. Pause, Resume and Stop are available in the sidebar and command palette. Stopping recording keeps the dashboard available. Explore the codebase
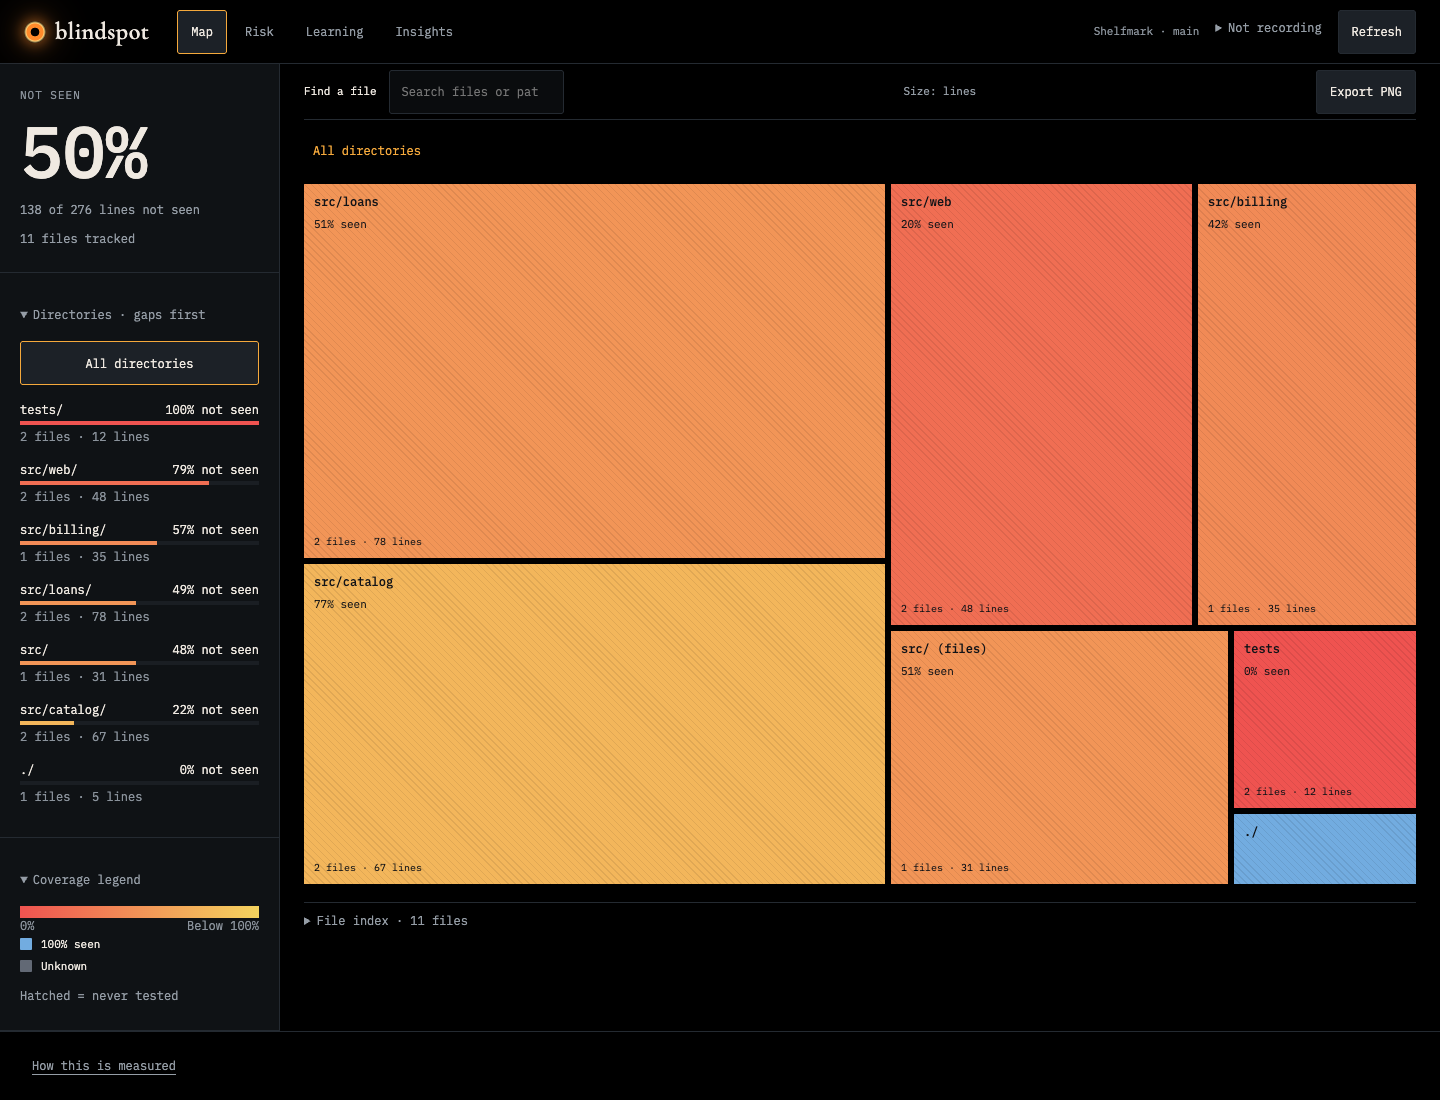
The headline reports the percentage of tracked lines not seen and shows its underlying line counts. Red indicates no display coverage; partial coverage moves through yellow; blue means all counted lines have display coverage. Unknown data is neutral. Hatching indicates untested code; a directory can contain both tested and untested files. Visibility and quiz results remain separate measures. How tracking worksWhile recording, the extension captures supported source snapshots and the line ranges VS Code reports as visible. Split editors contribute their visible ranges; an open background tab does not earn coverage just by being open. Recording pauses when requested and does not fill in activity from before it started. The bundled local companion keeps observations in SQLite and compares them with saved source and Git history. After a file changes, it reassesses coverage for the changed content rather than treating the entire file as permanently seen. Unchanged, unambiguous regions may retain credit; changed or ambiguous regions can require another look. File changes can be detected regardless of which agent or external tool made them, within the supported tracking scope. The React dashboard reads this local data and refreshes periodically. Its counts are about what appeared in this editor, not whether you read or understood it. Blindspot reports gaps; it never blocks commits, builds, or other work. Optional learning toolsStudy guides are available without an AI service. You can also copy a scoped quiz prompt into a chat model, import its JSON response, and answer questions with a confidence rating. Optional explanations can use a separately installed local Ollama model. Neither is required to use tracking or study guides. Quiz accuracy means agreement with a generated answer key, which can be wrong. Disputed keys can be reported and excluded from current credit. Results from older source versions remain readable as historical practice. A quiz pass does not mark source as seen or remove a whole file's review priority. Privacy and retained data
Limitations
Troubleshooting
Source and licenseBlindspot is MIT licensed. The bundled Python runtime is distributed by Astral's Python Standalone Builds and retains its upstream license notices. Bundled fonts retain their licenses. |