Project Web - VS Code Extension


Visualize your workspace file structure as an interactive spiderweb graph directly in VS Code.

Features
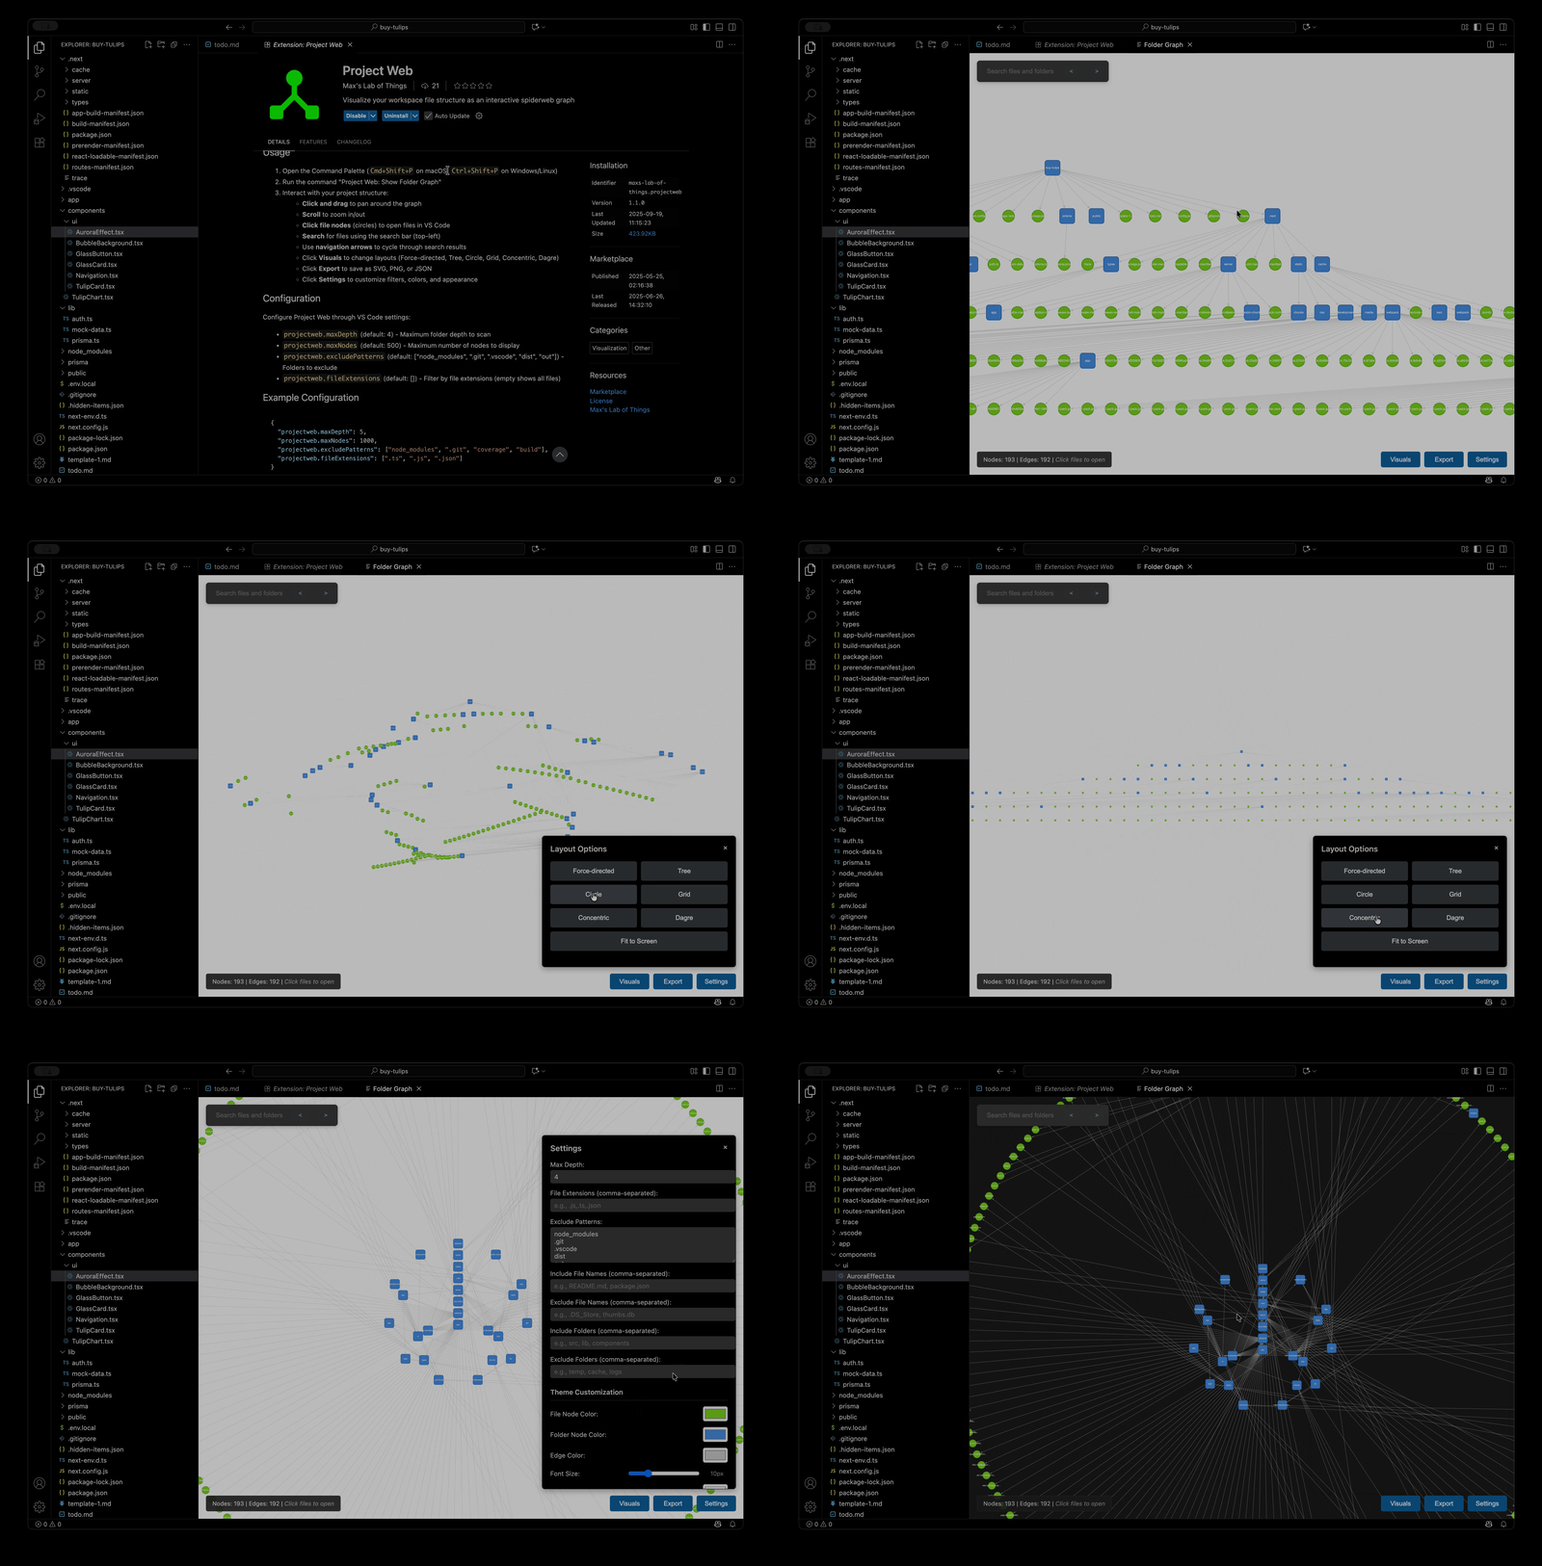
- Interactive Graph Visualization: View your project structure as a beautiful, interactive graph using Cytoscape.js
- Multiple Layout Options: Choose from 6 layouts - Force-directed, Tree, Circle, Grid, Concentric, and Dagre
- File Navigation: Click on any file node to instantly open it in the VS Code editor
- Advanced Search: Search for files with navigation arrows to cycle through results
- Theme Customization: Customize node colors, font colors, background color, and font size
- Flexible Filtering: Filter by file names, folder names, extensions, and patterns
- Export Options: Export your graph as SVG, PNG, or JSON
- Performance Optimized: Smart filtering and depth limits for handling large projects
- Fully Local: Runs entirely on your machine with no external dependencies or internet connection required
- VS Code Theme Integration: Respects your VS Code theme (light/dark mode)
Usage
- Open the Command Palette (
Cmd+Shift+P on macOS, Ctrl+Shift+P on Windows/Linux)
- Run the command "Project Web: Show Folder Graph"
- Interact with your project structure:
- Click and drag to pan around the graph
- Scroll to zoom in/out
- Click file nodes (circles) to open files in VS Code
- Search for files using the search bar (top-left)
- Use navigation arrows to cycle through search results
- Click Visuals to change layouts (Force-directed, Tree, Circle, Grid, Concentric, Dagre)
- Click Export to save as SVG, PNG, or JSON
- Click Settings to customize filters, colors, and appearance
Configuration
Configure Project Web through VS Code settings:
projectweb.maxDepth (default: 4) - Maximum folder depth to scanprojectweb.maxNodes (default: 500) - Maximum number of nodes to displayprojectweb.excludePatterns (default: ["node_modules", ".git", ".vscode", "dist", "out"]) - Folders to excludeprojectweb.fileExtensions (default: []) - Filter by file extensions (empty shows all files)
Example Configuration
{
  "projectweb.maxDepth": 5,
  "projectweb.maxNodes": 1000,
  "projectweb.excludePatterns": ["node_modules", ".git", "coverage", "build"],
  "projectweb.fileExtensions": [".ts", ".js", ".json"]
}
Visual Overview
The extension creates an interactive graph where:
- Blue rectangles represent folders
- Green circles represent files
- Lines show the parent-child relationships
- Hover over nodes to see full names
- Click files to open them instantly
For large projects:
- Reduce
maxDepth to limit scanning depth
- Add common build/dependency folders to
excludePatterns
- Use
fileExtensions to show only relevant files
- Lower
maxNodes if the graph becomes too dense
Requirements
- VS Code 1.74.0 or higher
- No external dependencies required
Resources
Publisher
Max's Lab of Things
Visit mlot.ai
License
MIT
| |


