Claude Code Usage Dashboard
Monitor your Claude Code rate limits, API-equivalent costs, and token usage directly in VS Code — with a full analytics dashboard.
Features
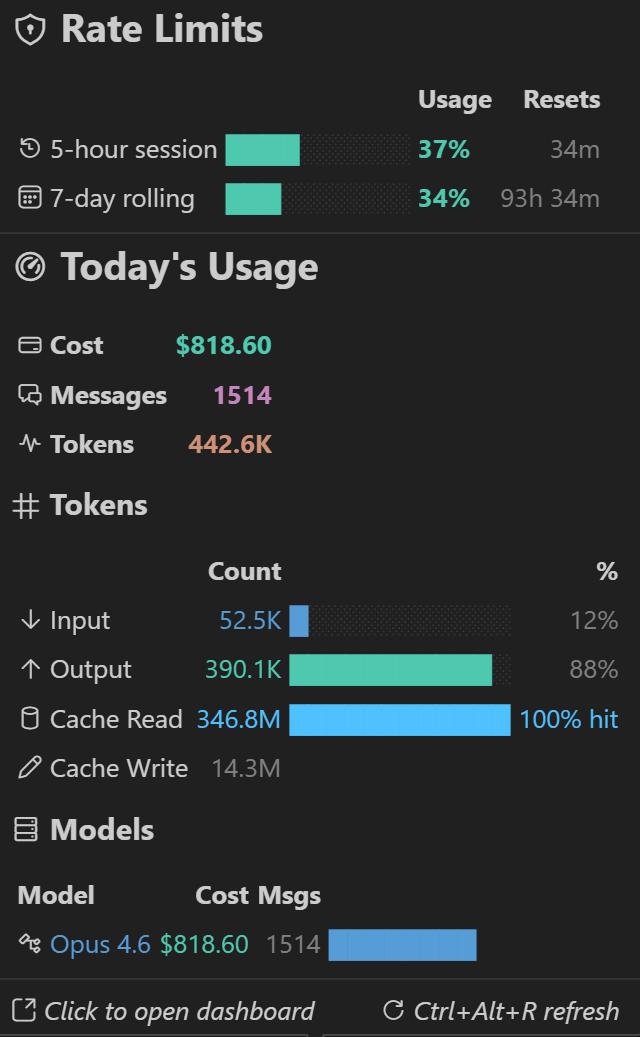
Status Bar & Hover Overlay
A single status bar item shows your current rate limit utilization at a glance. Hover for a detailed breakdown of rate limits, today's cost, tokens, cache performance, and model usage — all in one card.
Analytics Dashboard
Press Ctrl+Alt+C (or click the status bar) to open the full dashboard:
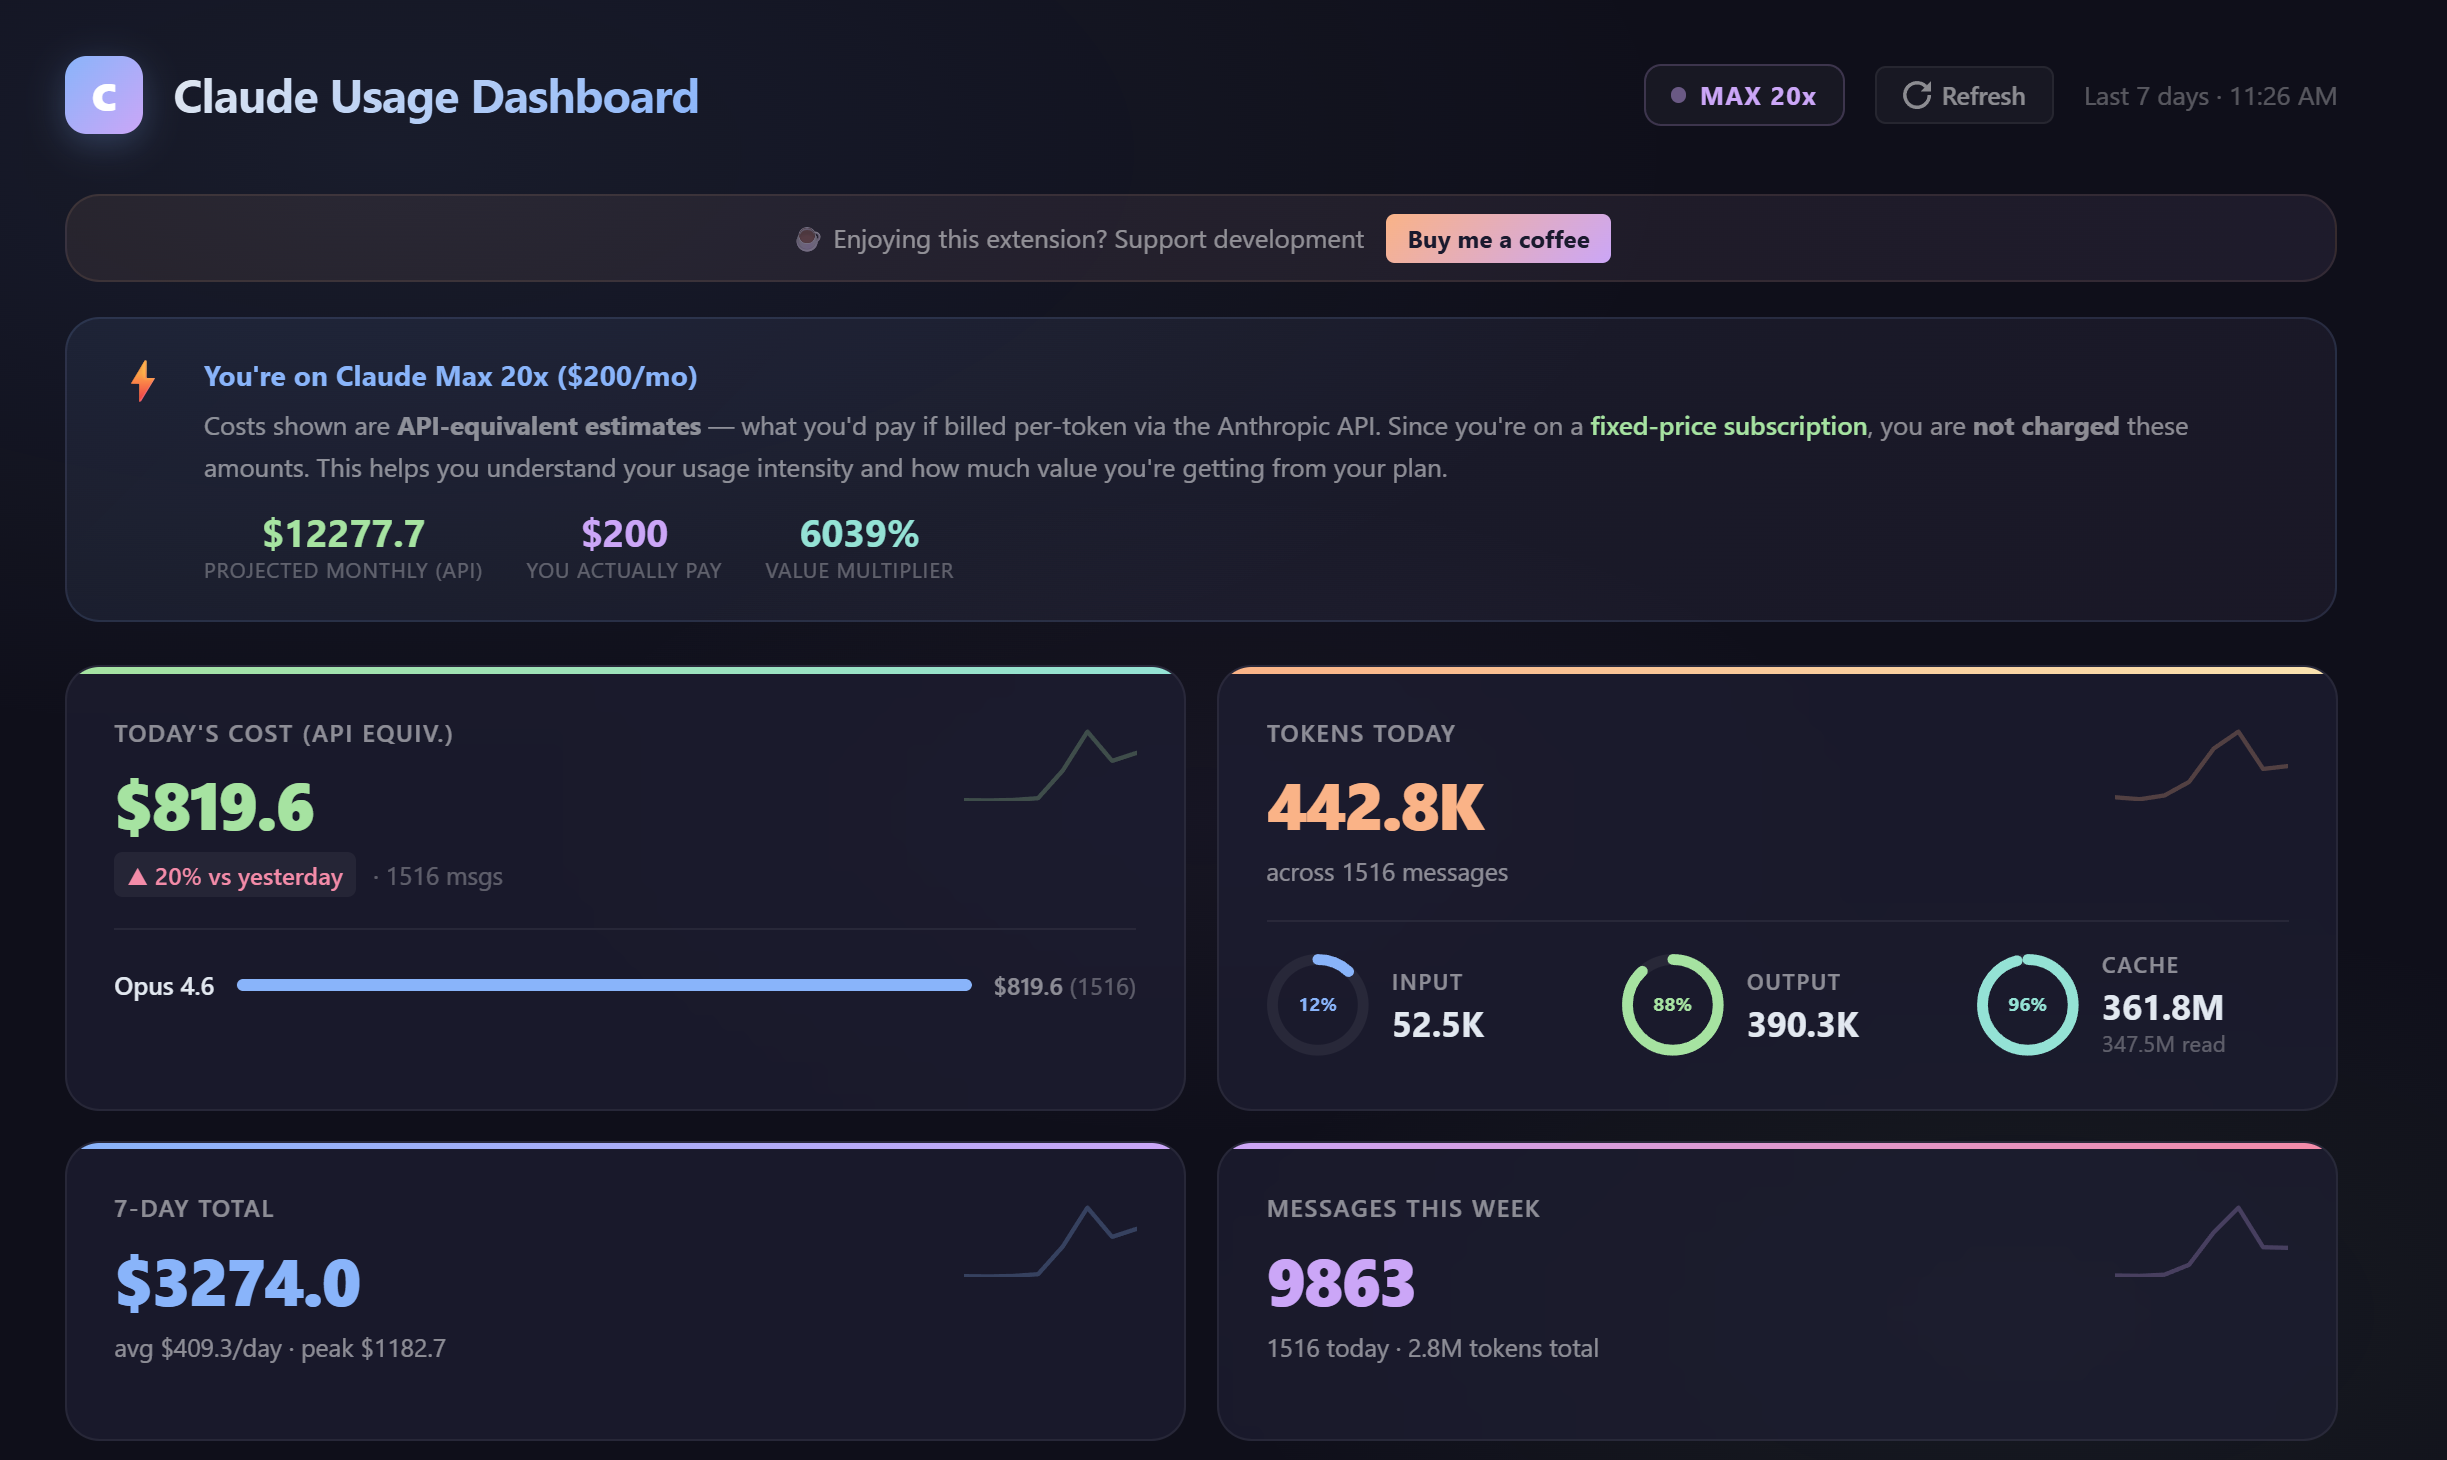
KPI Cards, Cost Trend & Model Distribution
- KPI Cards — Today's cost, 7-day total, tokens, and messages with sparklines and per-model breakdowns
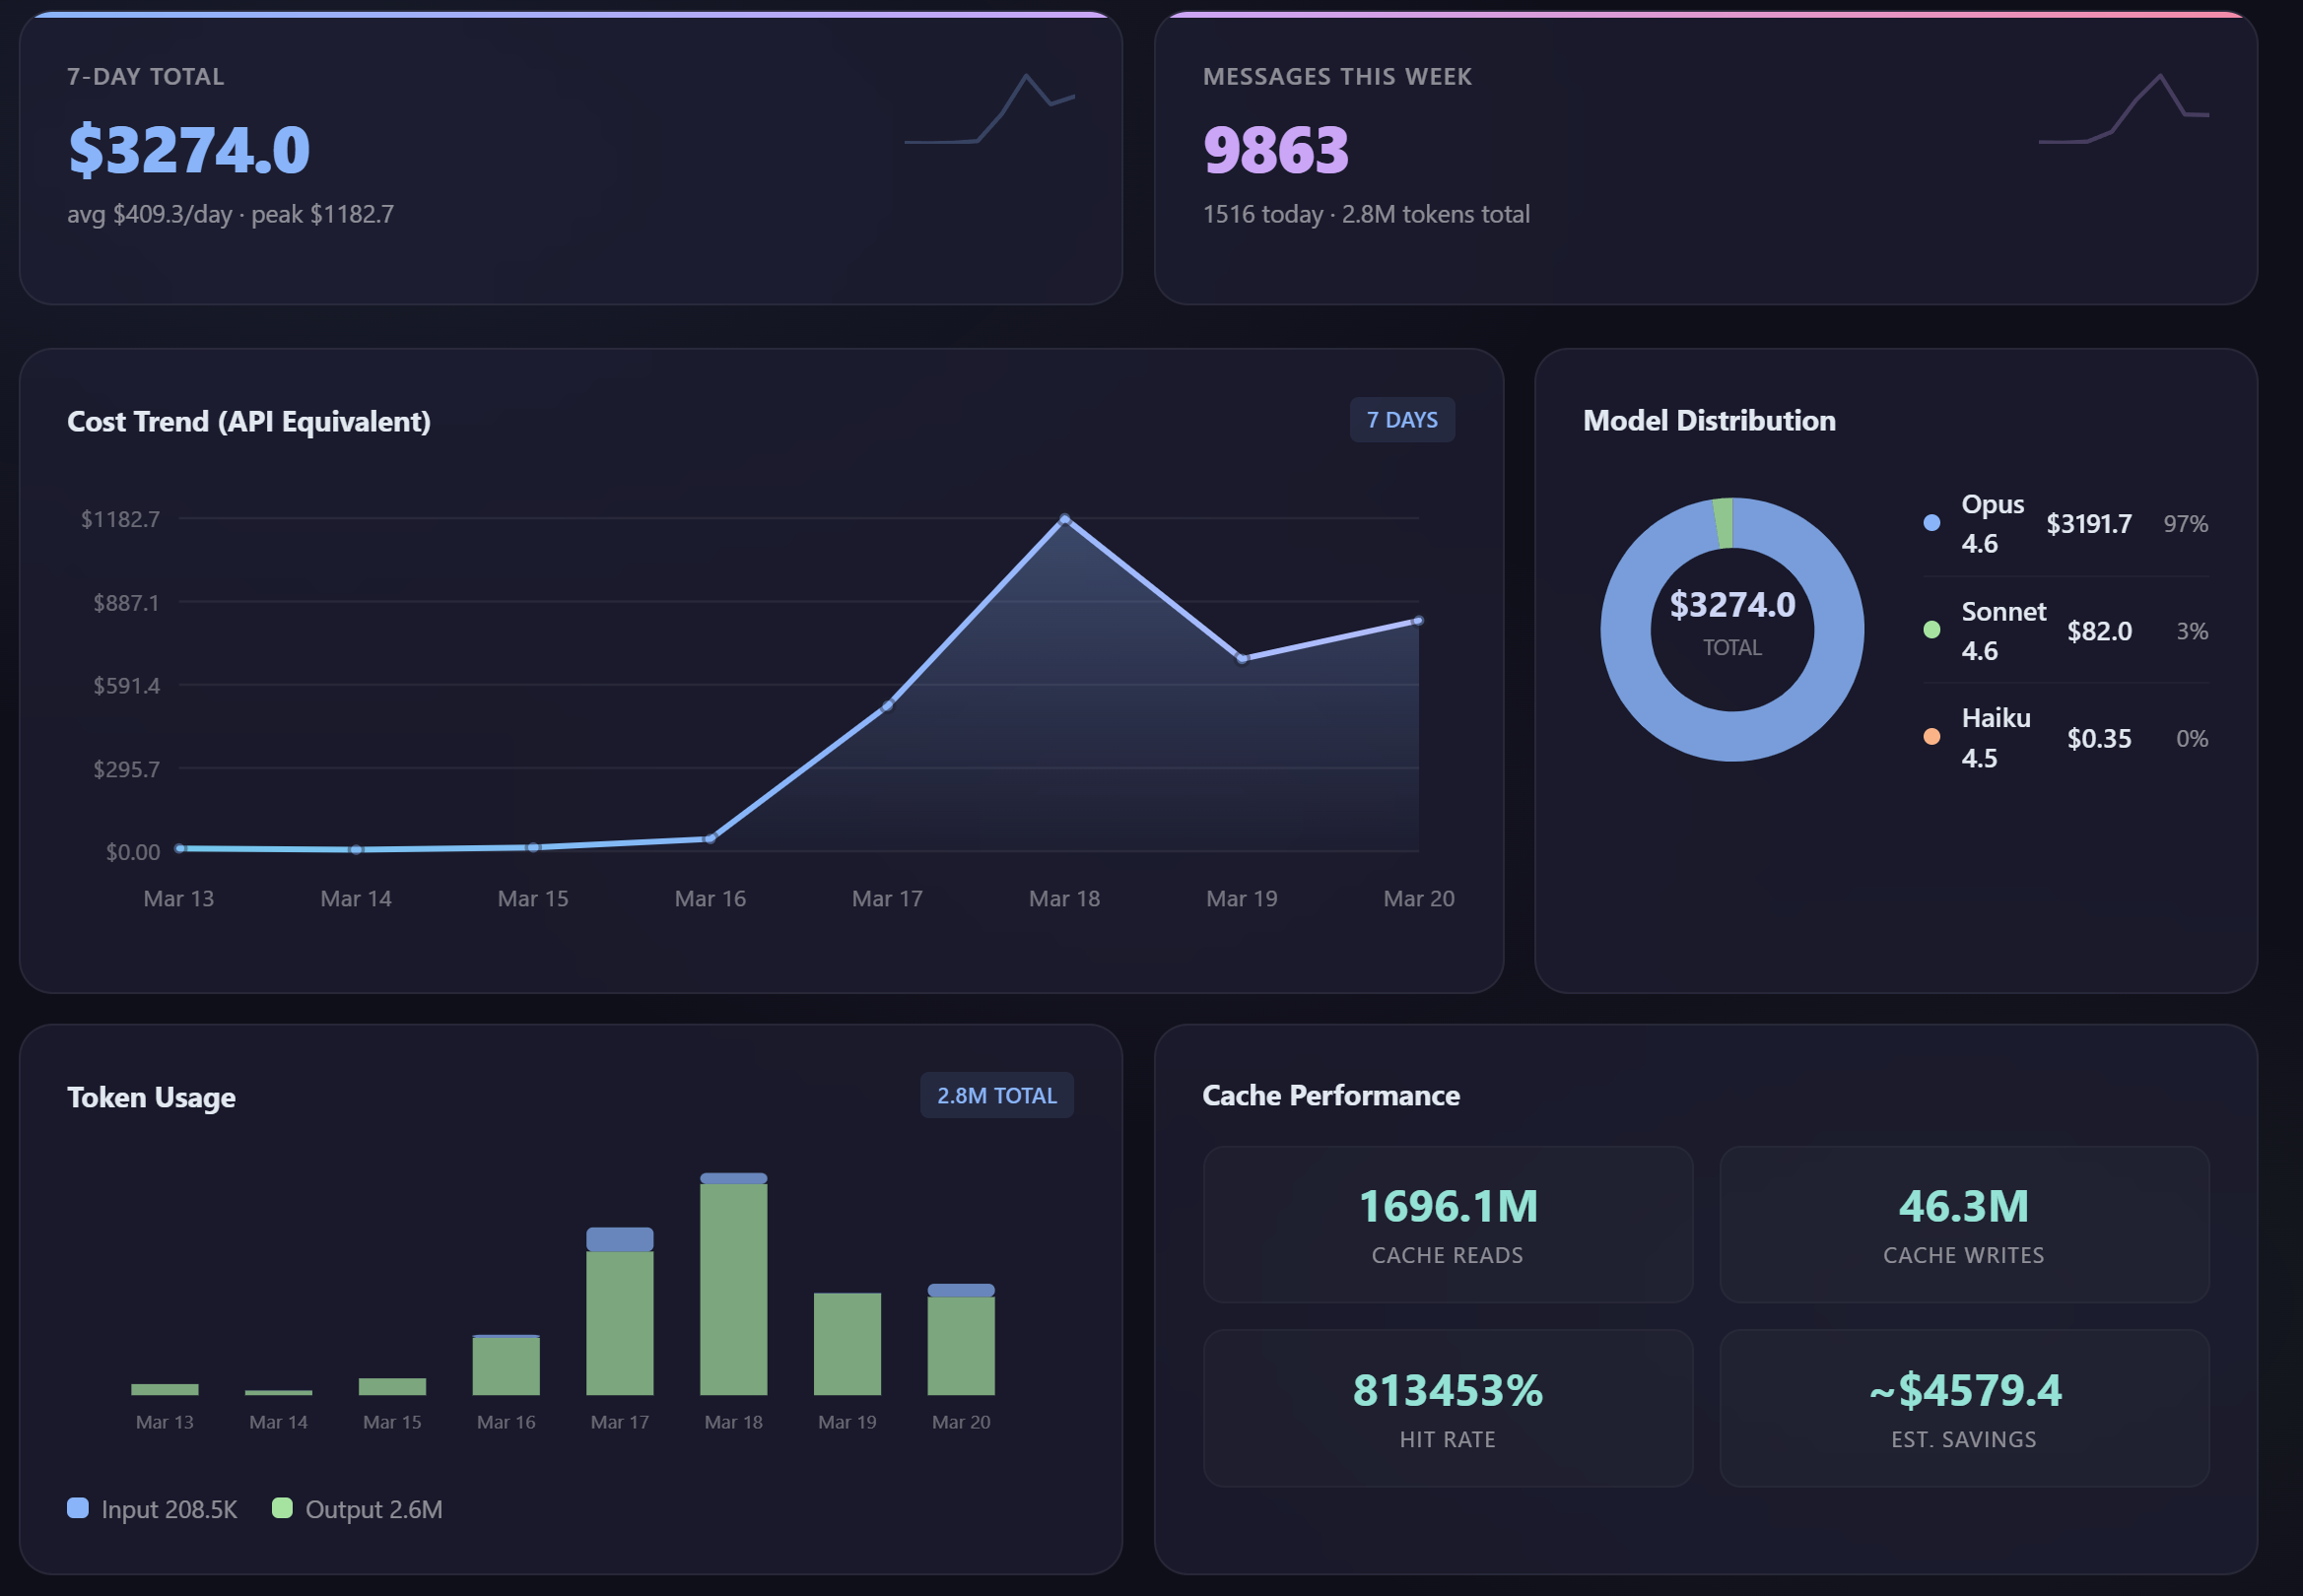
- Interactive Cost Trend — Area chart with proximity-based hover (move anywhere on the chart to see the nearest data point)
- Model Distribution — Donut chart showing cost split across Opus, Sonnet, and Haiku
- Token Usage — Stacked bar chart with input/output breakdown per day
- Cache Performance — Hit rate, read/write volumes, and estimated savings
Tool Usage & Activity Heatmap
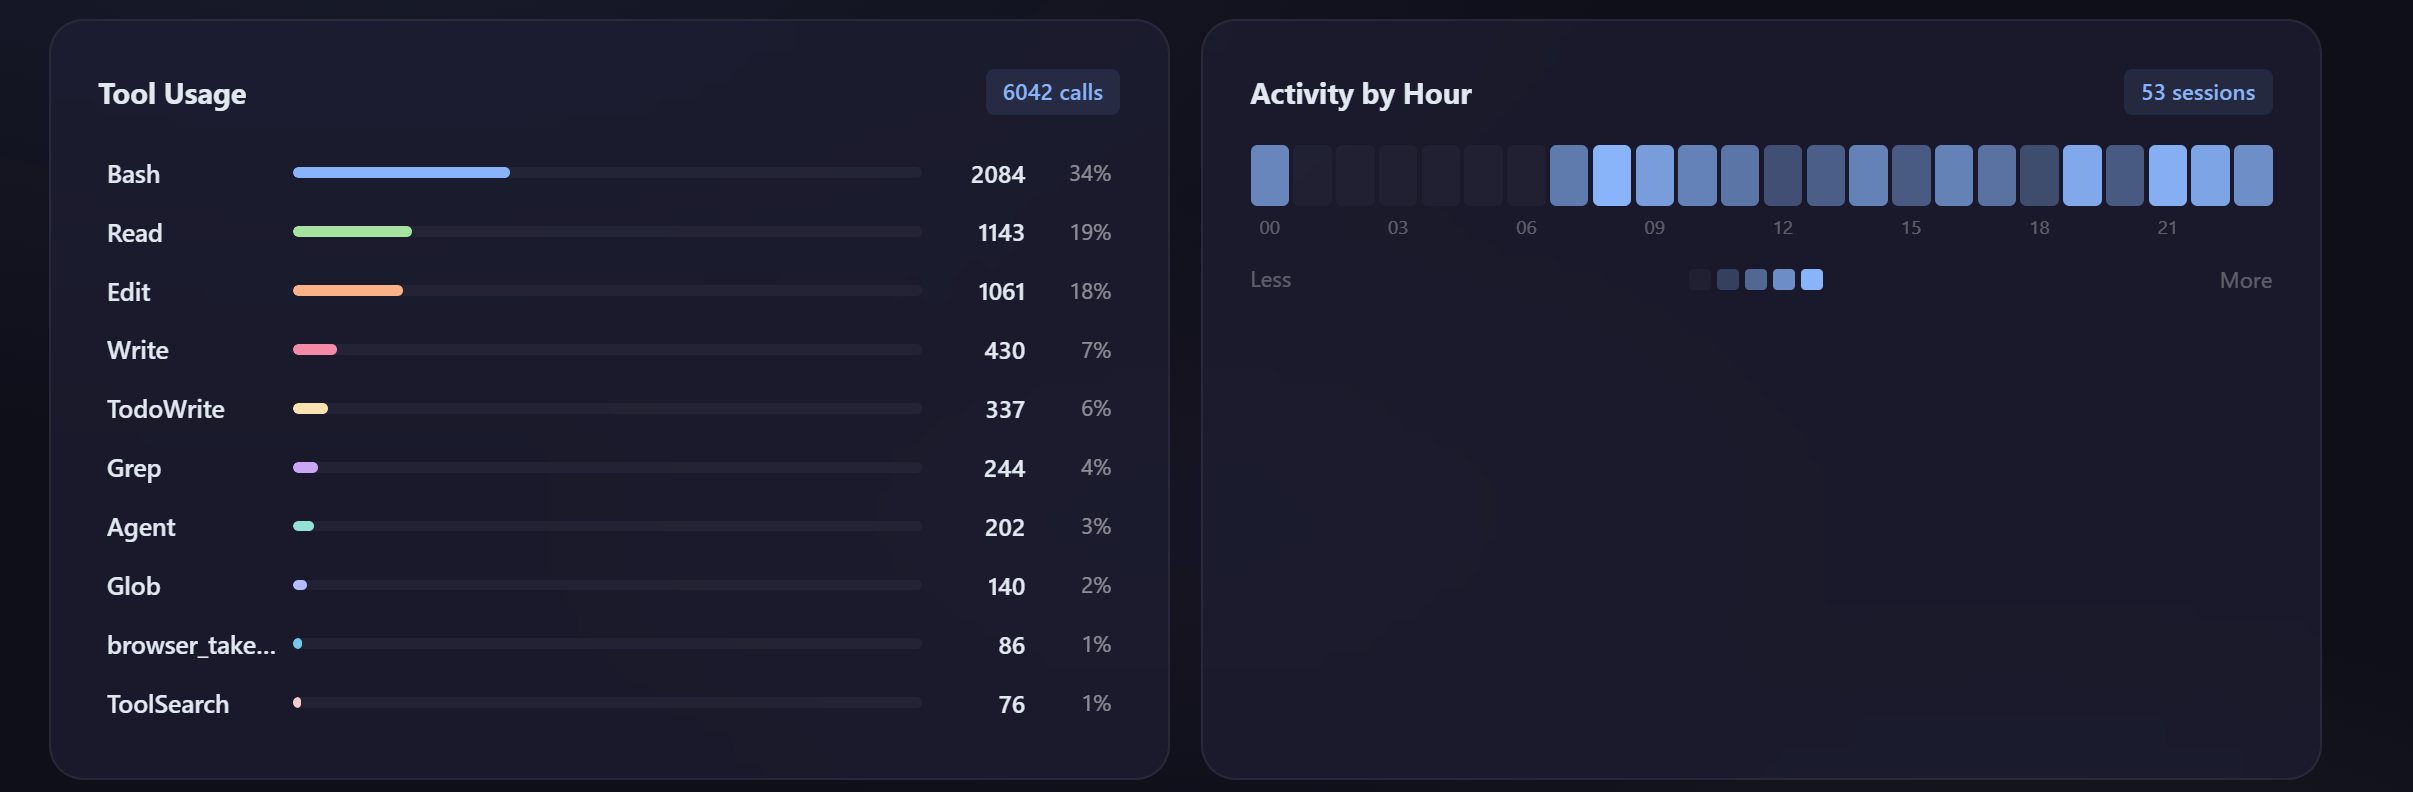
- Tool Usage — Ranked breakdown of which tools you use most (Bash, Edit, Read, etc.)
- Activity Heatmap — 24-hour activity pattern showing when you code with Claude
Daily Breakdown
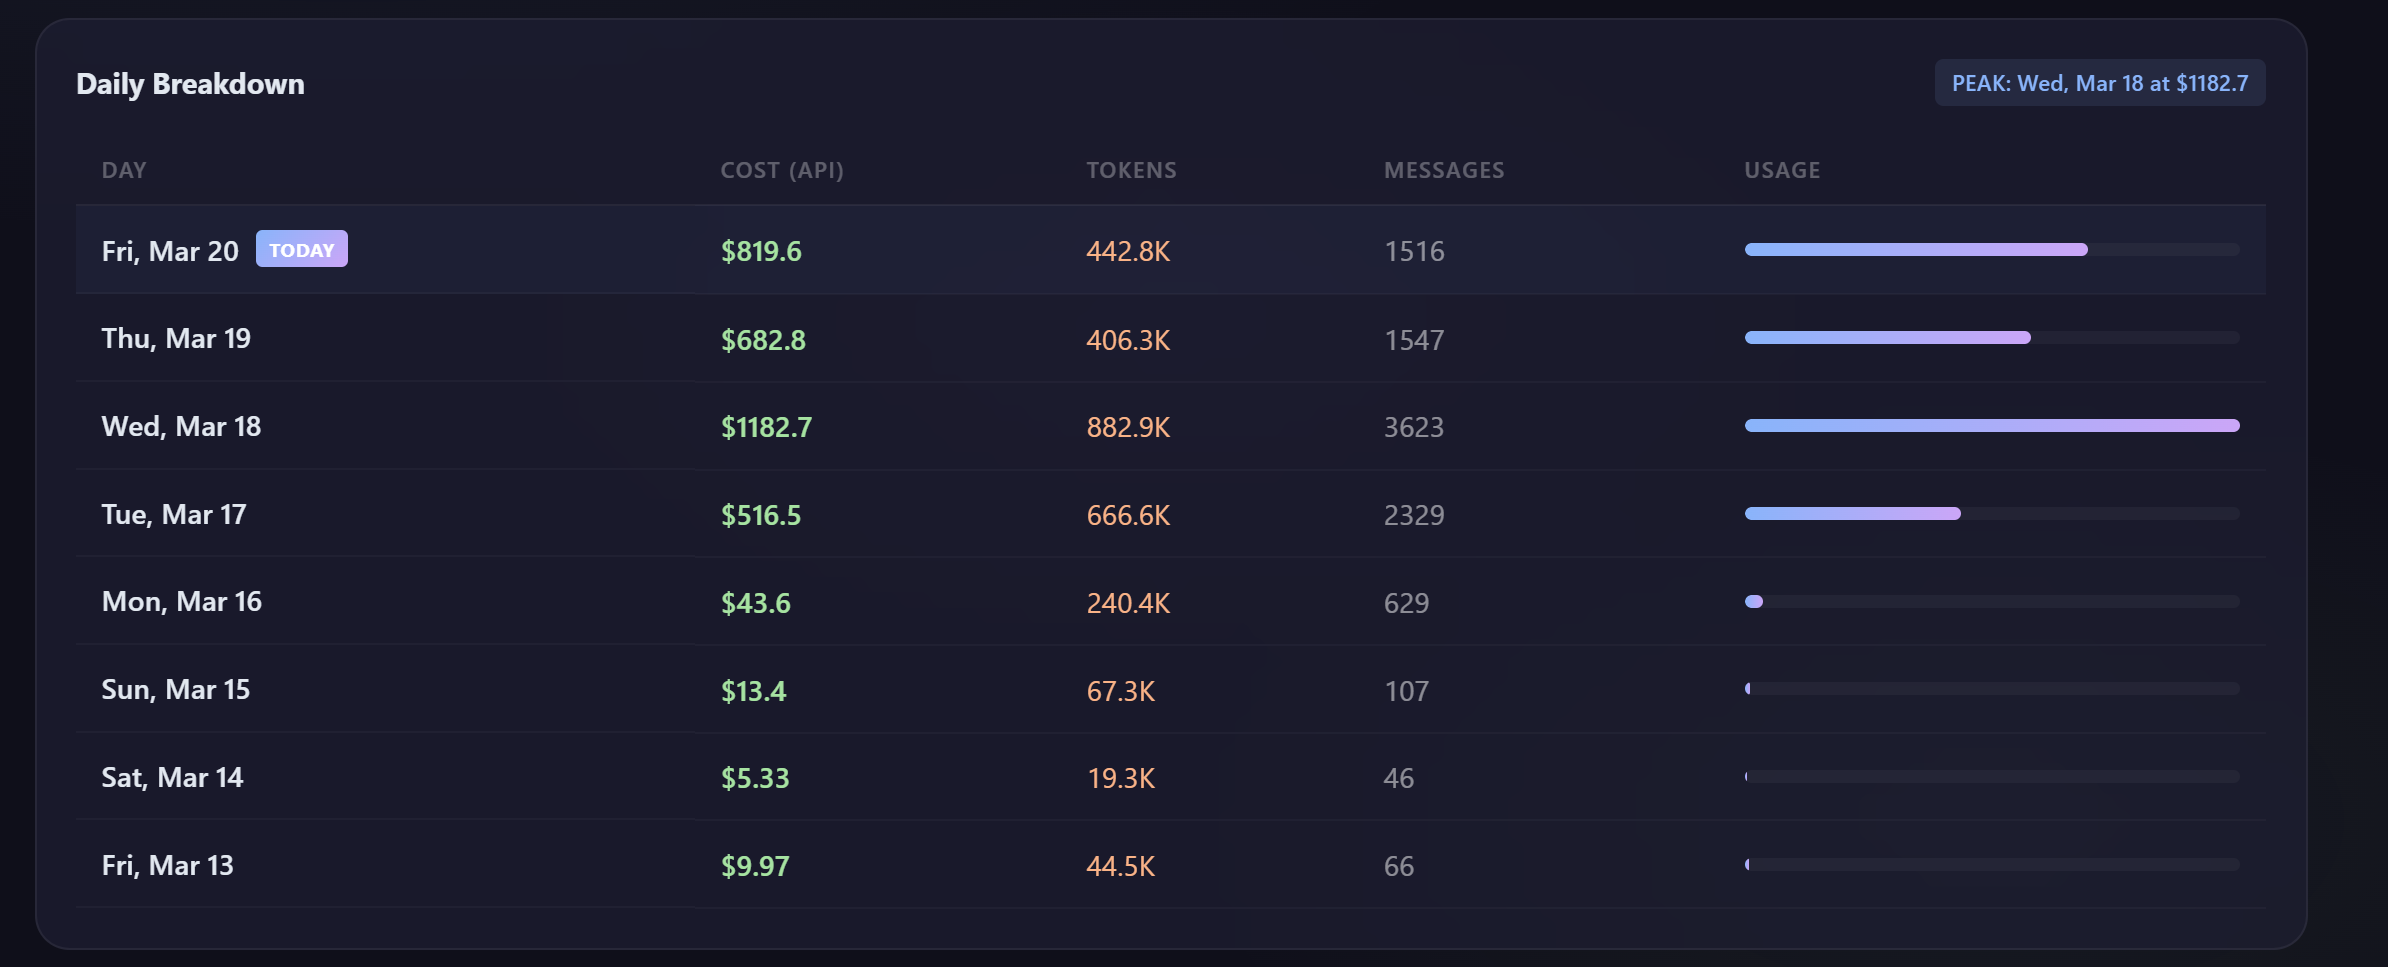
- Daily Breakdown — Table with mini progress bars, peak day badge, and per-day cost/token/message stats
Subscription Awareness
Automatically detects your Claude subscription tier (Max 20x, Max 5x, Pro, Free) and displays an info banner explaining that costs shown are API-equivalent estimates — you are not charged these amounts on a subscription plan. Shows a value multiplier comparing projected API cost vs. what you actually pay.
Offline & Private
All usage data is computed locally by scanning Claude Code's JSONL conversation files (~/.claude/projects/). Zero network calls for cost/token data — the only API call is the rate limit check to api.anthropic.com.
Installation
From VS Code Marketplace
Search for "Claude Code Usage Dashboard" in the Extensions panel, or:
ext install man-vu.claude-code-usage-dashboard
From VSIX
- Download the
.vsix file from Releases
Ctrl+Shift+P → "Install from VSIX"
Requirements
Commands
| Command |
Shortcut |
Description |
| Claude Usage: Show Dashboard |
Ctrl+Alt+C |
Open the full analytics dashboard |
| Claude Usage: Refresh All |
Ctrl+Alt+R |
Force refresh all data |
| Claude Usage: Toggle Status Bar |
|
Show/hide the status bar item |
| Claude Usage: Scan Today's Stats |
|
Re-scan JSONL files for today |
Settings
| Setting |
Default |
Description |
claudeUsageBar.refreshInterval |
300 |
Auto-refresh interval in seconds (minimum 60) |
claudeUsageBar.warningThreshold |
70 |
Usage % to show yellow warning |
claudeUsageBar.criticalThreshold |
90 |
Usage % to show red alert |
claudeUsageBar.dailyBudget |
0 |
Daily cost budget in USD (0 = disabled) |
How It Works
- Rate limits — Fetched from
api.anthropic.com/api/oauth/usage using your Claude Code OAuth token (cached aggressively with exponential backoff to avoid 429s)
- Cost & tokens — Computed locally by scanning
~/.claude/projects/*/*.jsonl conversation files. Each assistant message contains usage.input_tokens, usage.output_tokens, and the model name, which we multiply by API pricing
- Tool usage — Extracted from
message.content[].type === "tool_use" entries in the same JSONL files
- Hourly activity — Derived from message timestamps
- Project breakdown — Grouped by the project directory in the JSONL file path
Privacy
- All data stays on your machine
- No telemetry, no tracking, no analytics
- The only network request is the rate limit API call (using your existing Claude Code OAuth token)
- Source code is fully open
Support
If this extension helps you, consider supporting development:

License
MIT