c64jasm assembler VS Code extension
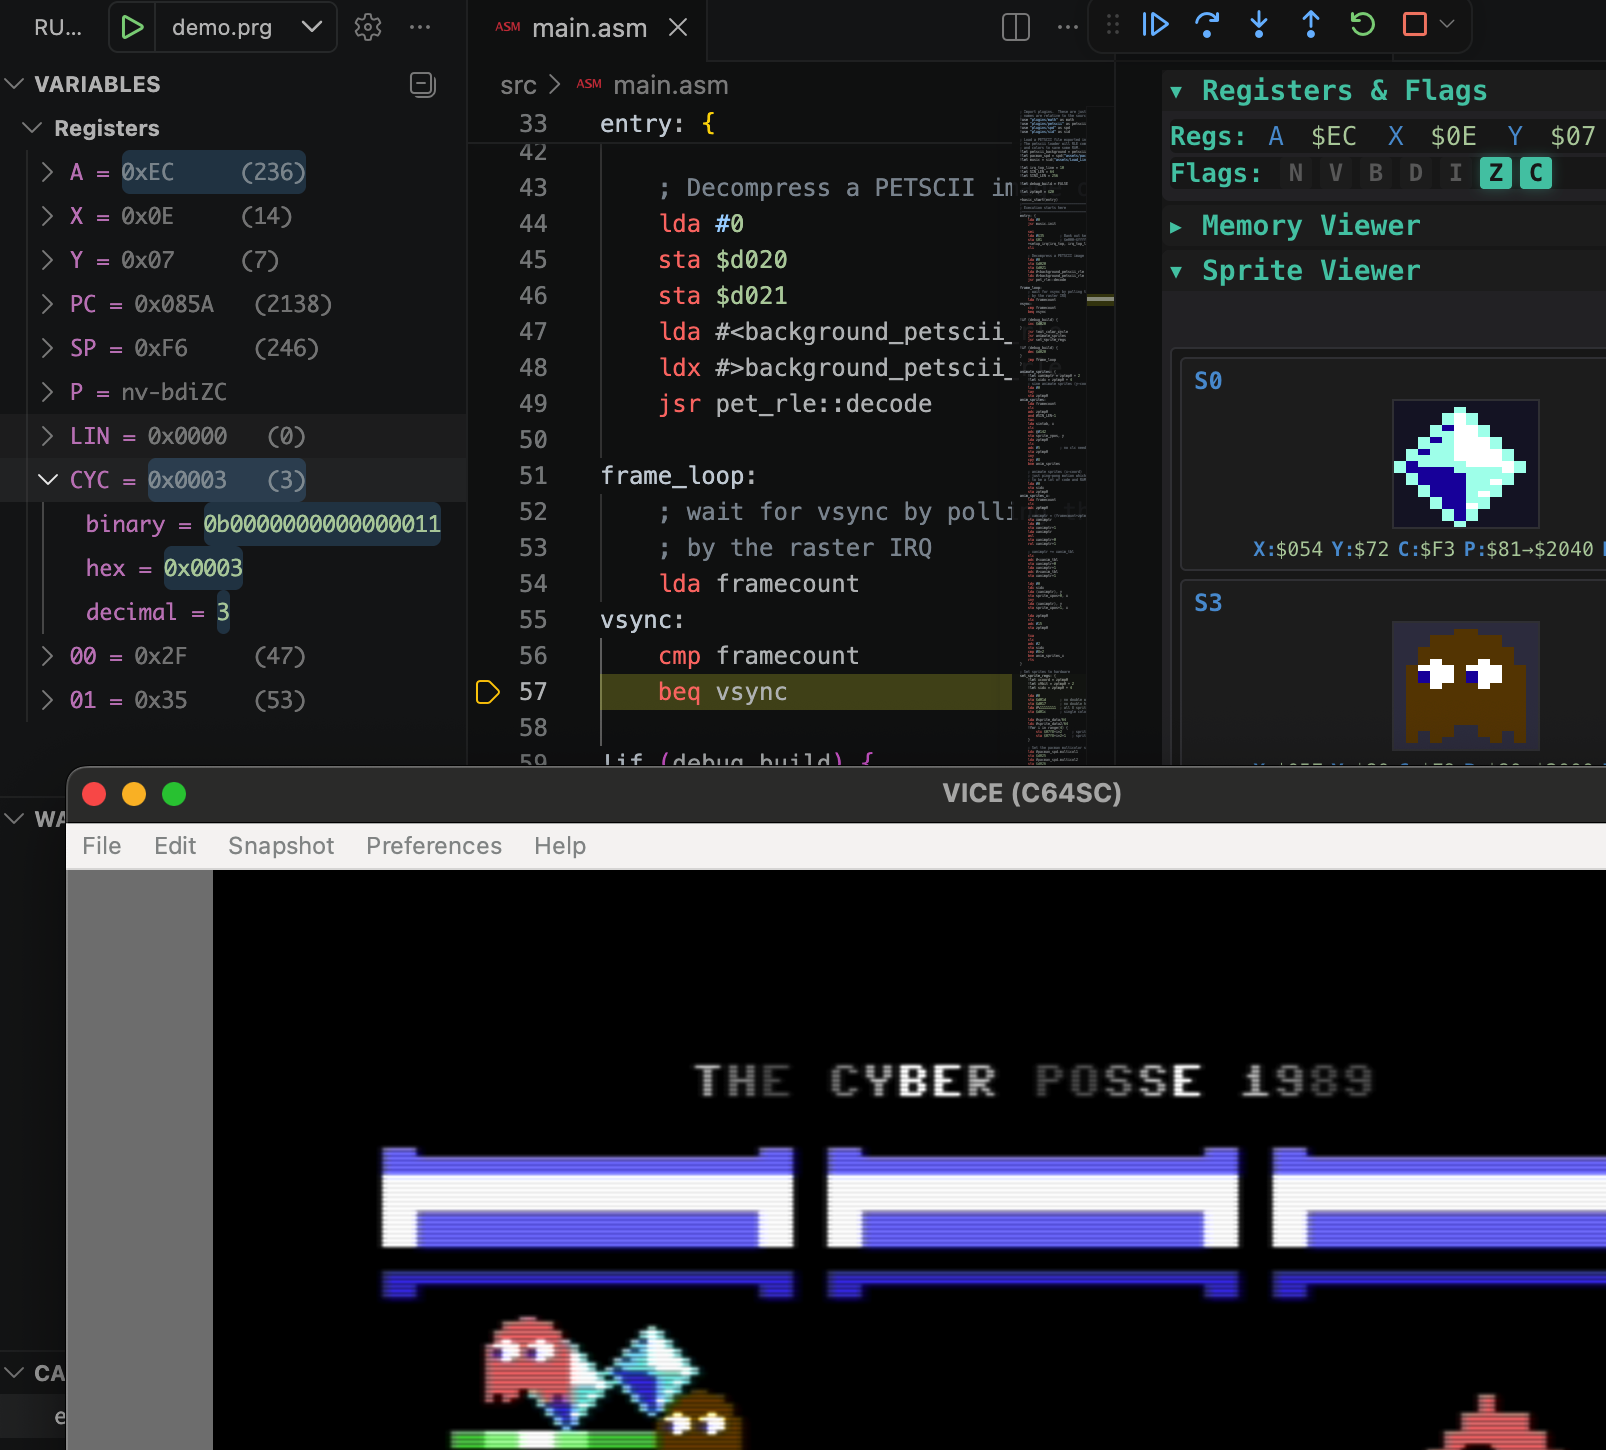
Originally created by Janne Hellsten, who conceived c64jasm as a JavaScript-extensible assembler and developed both the assembler and the VS Code extension.
In 2022, Luca began improving the extension by adding advanced debugging capabilities (such as the C64 runtime inspector) and rich code navigation features (like Find All References, Go to Definition, and hovers for well-known C64 memory addresses). Additionally, if you have a GitHub Copilot subscription, the debugger is fully integrated with the Copilot agent. The agent can read and write C64 memory, view the screen as an image, and actively assist you in developing new features or fixing bugs.
Now, in 2026, this work is being published as a new extension with id c64jasm-tools. This extension adds first-class c64jasm support to VS Code with:
- Syntax highlighting and auto-completion for c64jasm source files
- Real-time compile diagnostics while you edit
- Rich Code Navigation: Go to Definition, Find All References, and Workspace Symbol Search
- Contextual Hovers for symbols and well-known C64 memory map addresses
- Build and run/debug workflows for Commodore 64 projects with project scaffolding
- Integrated C64 runtime/debug tooling for VICE-based sessions (breakpoints, CPU/Memory/VIC/SID inspection)
Requirements
- VS Code 1.93.0 or newer
- VICE installed and available in PATH, or configured explicitly via
c64jasm-client.vicePath
By default, the extension uses the bundled c64jasm compiler. You can switch to a system-installed compiler with c64jasm-client.useEmbeddedCompiler.
Quick Start
- Open the Command Palette (
Ctrl+Shift+P or Cmd+Shift+P) and run c64jasm: Create New Project.
- Select the sample project and a destination folder. Choose to open it in VS Code right away.
- Press
F5 to launch the debugging session. This will automatically compile your code and launch VICE for debugging using the default c64jasm-debug configuration created in launch.json.
If no custom debug configuration exists yet, use the provided c64jasm launch configuration template.
Extension Settings
This extension contributes the following settings:
c64jasm-client.maxNumberOfProblems: Controls the maximum number of problems produced by the server. Defaults to 100.c64jasm-client.trace.server: Traces communication between VS Code and the language server. Possible values: off, messages, verbose. Defaults to off.c64jasm-client.useEmbeddedCompiler: Enable or disable using the bundled c64jasm compiler. Defaults to true. If set to false, the extension will try to run the c64jasm executable from your system PATH.c64jasm-client.vicePath: Specifies the path to the VICE executable used when starting a debug session. Defaults to x64sc.
It is highly recommended to leverage the c64-step-debugging skill together with your problem statement: simply describe what's wrong and the agent will use the tools appropriately to step through the code and find the issue. For example, pause a debug session and ask the agent in the Content-pipe sample (you can create it using the c64jasm: Create New Project command):
"/c64-step-debugging, why are the ghosts blue? I expected them to be white or grey. The debug session is paused, check this out by stepping through the code."
The following tools are at the agent's disposal; you don't need to invoke them directly, although you could:
c64jasm-manageDebugger: Start, stop, pause, continue, step into, step over, or check status of a C64 debug session.
"Start the C64 debug session" — or — "Step over the next instruction"
c64jasm-manageBreakpoint: Set or remove source breakpoints in .asm files, with optional VICE breakpoint conditions.
"Set a breakpoint at line 42 of main.asm" — or — "Remove all breakpoints in player.asm"
c64jasm-getRuntimeC64Memory: Read runtime C64 state from VICE (CPU, VIC, SID, CIA, memory ranges, symbols) and optionally capture a screenshot.
"Show me the current VIC registers" — or — "Read 16 bytes at $C000 and take a screenshot"
Availability
Copilot tools require Copilot Chat access and a VS Code version with tool support.
Learn more: https://code.visualstudio.com/docs/copilot/chat/chat-agent-mode