Flutter Net InspectorNetwork inspector dashboard for Flutter apps — view, mock, and modify HTTP responses in real-time Installation Launch VS Code Quick Open ( Ctrl+P), paste the following command, and press enter.Copied to clipboard |
Flutter Net InspectorA VSCode extension that gives you a real-time network inspector dashboard for your Flutter app — inspect live HTTP traffic, mock any endpoint, set breakpoints on responses, and replay requests, all without leaving VSCode. Think of it as Flipper/Stetho for Flutter, built into your editor. Requirements
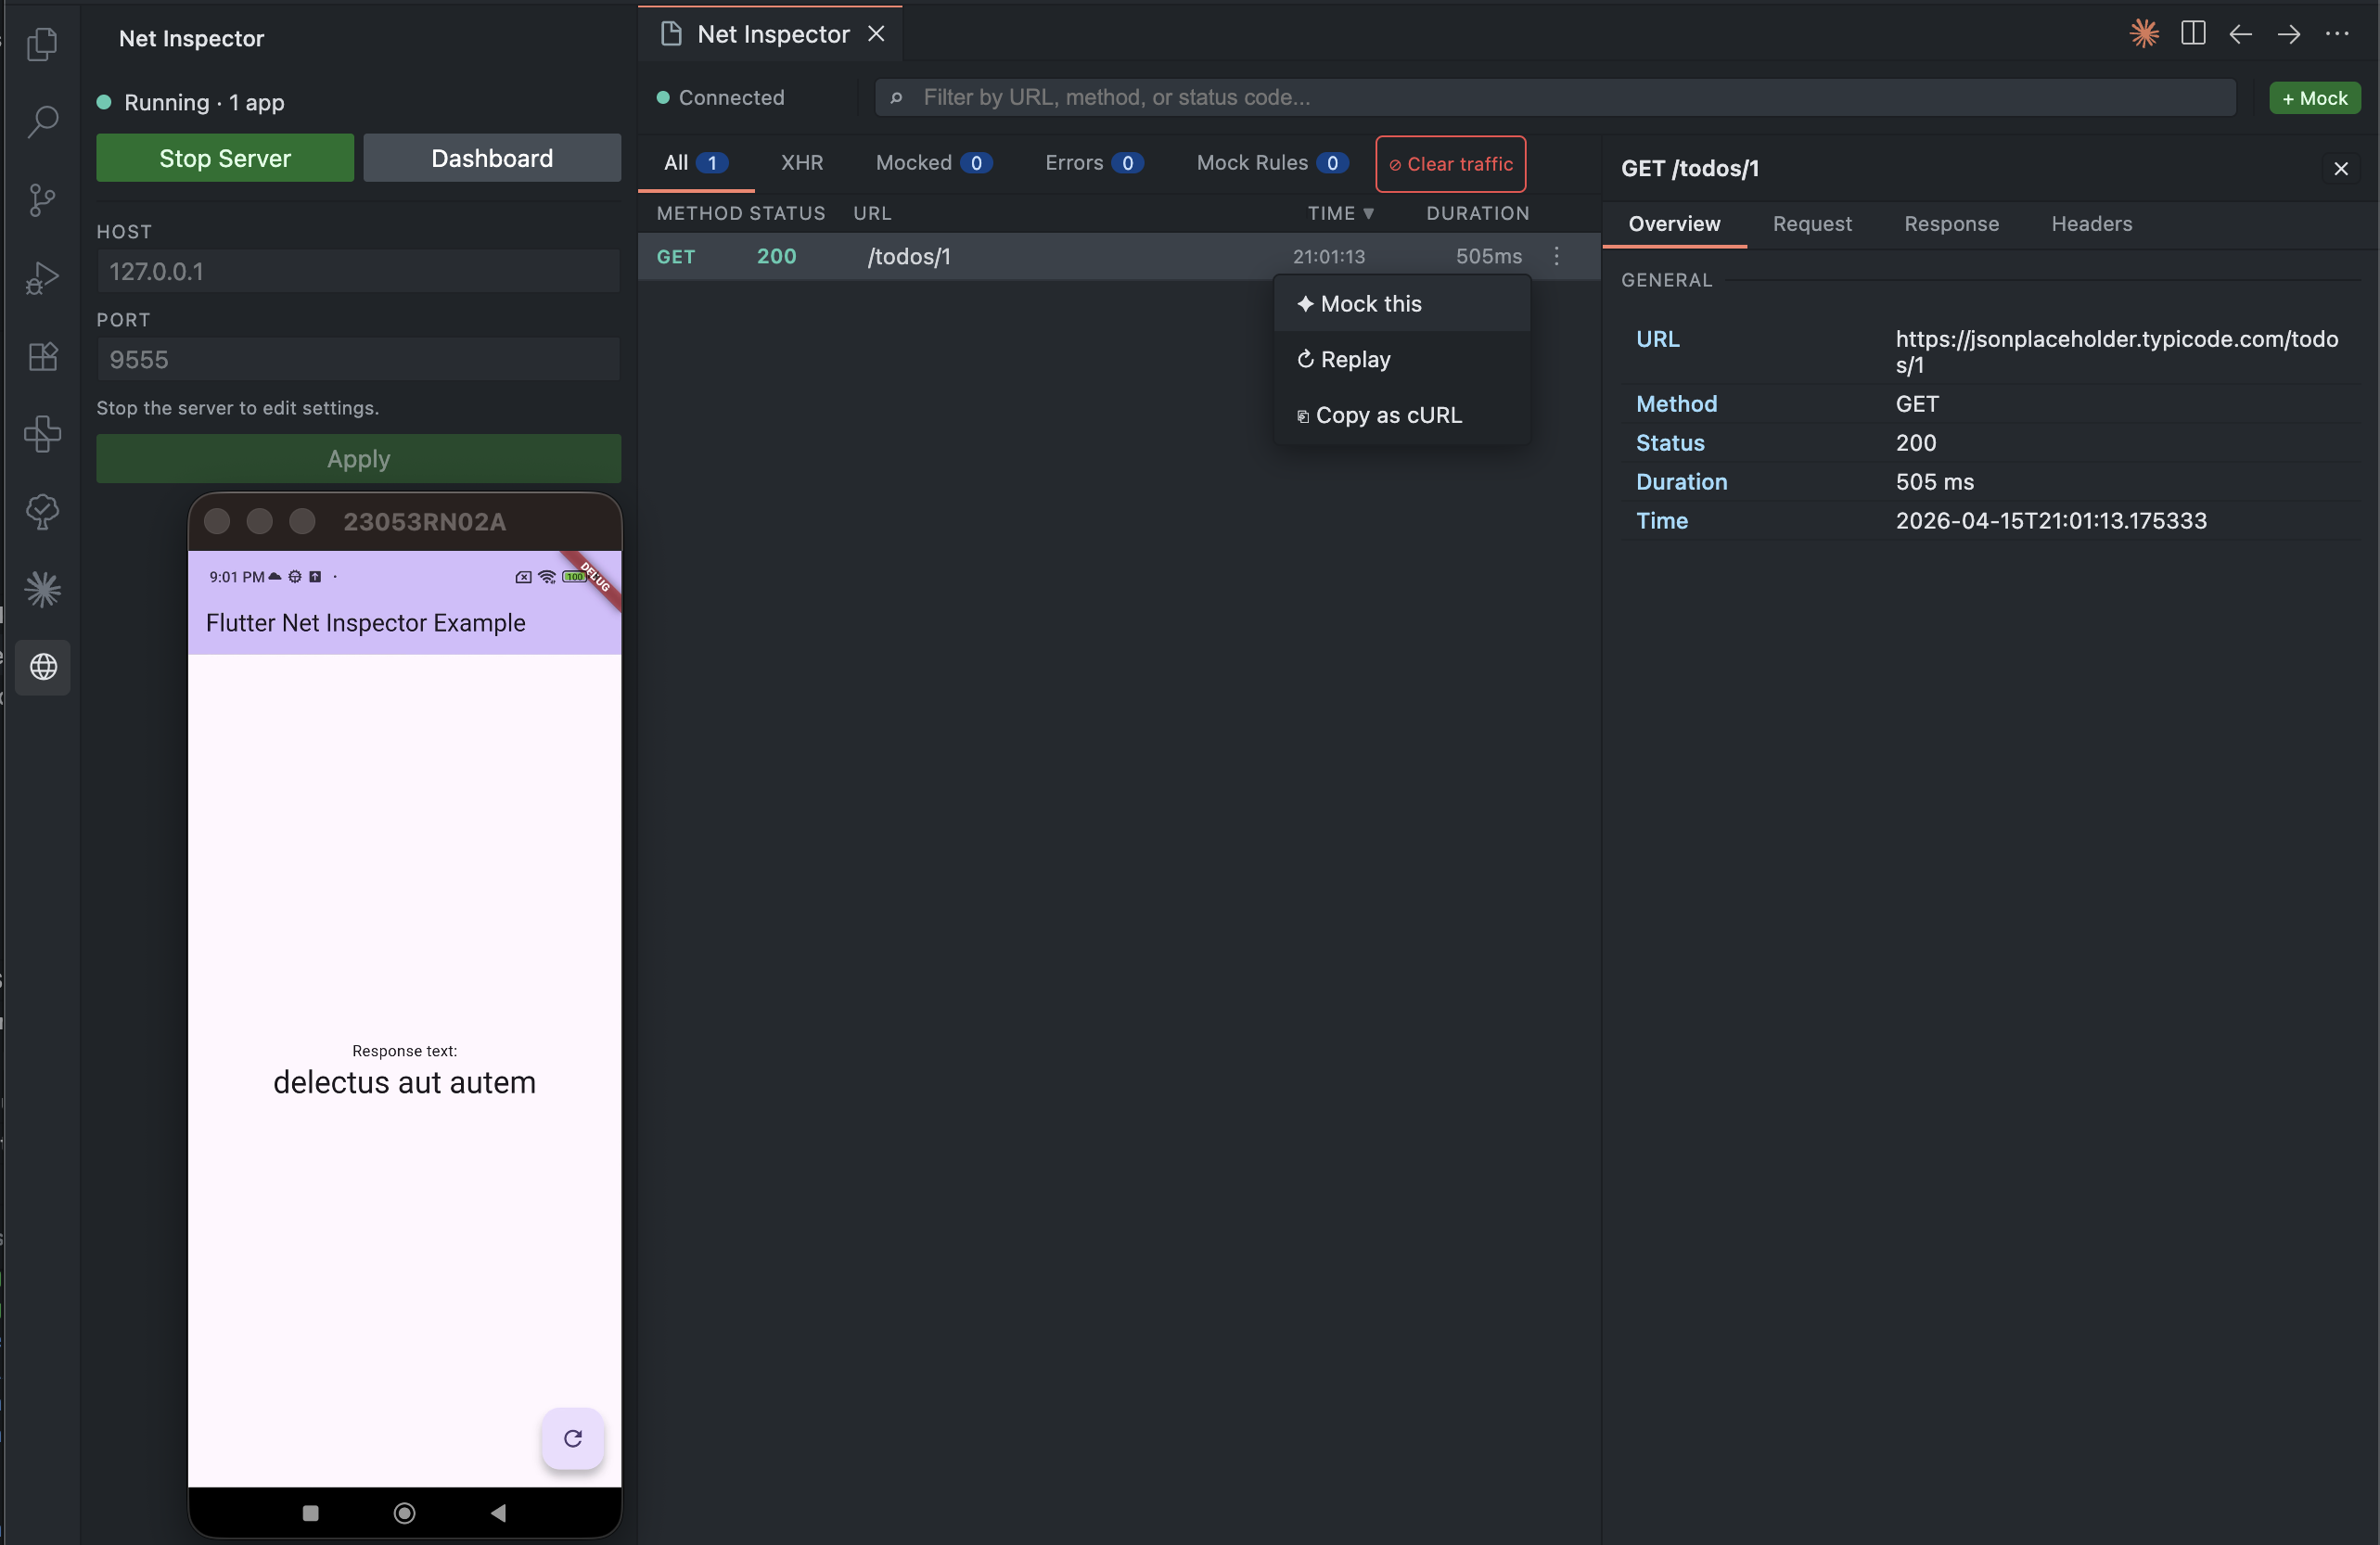
Getting started1. Install the Dart packageWire up the interceptor and call 2. Open the dashboardClick the Net Inspector icon in the Activity Bar (left sidebar), or open the Command Palette ( The dashboard opens in a panel. If the WebSocket server is not yet running, start it with the Start Server button in the dashboard or via the FeaturesLive traffic captureEvery HTTP request and response is captured as it happens — method, status code, URL, headers, body, and timing. Filter by URL, method, or status code. Sort by time. Click any row to inspect full details. Mock responsesIntercept any endpoint and return a custom response — status code, headers, body, and optional simulated latency — without touching your server or app code. Mocked entries are highlighted in the list so you always know what's real. Open the ⋮ menu on any captured request row and choose Mock this to open the mock editor pre-filled with that request's data. BreakpointsPause a response mid-flight, inspect and edit its body or status code in the VSCode panel, then resume it. Useful for testing how your app handles edge-case server responses without needing a real server that returns them. Request replayRe-fire any previously captured request from the dashboard with one click. Mock rule persistenceMock rules are saved to UI walkthroughInspect live traffic — Click three-dots for actionsEvery request appears as it happens. Open the context menu to mock the endpoint, replay the request, or copy it as a cURL command. Click the row to open the detail panel with full headers, body, and timing.
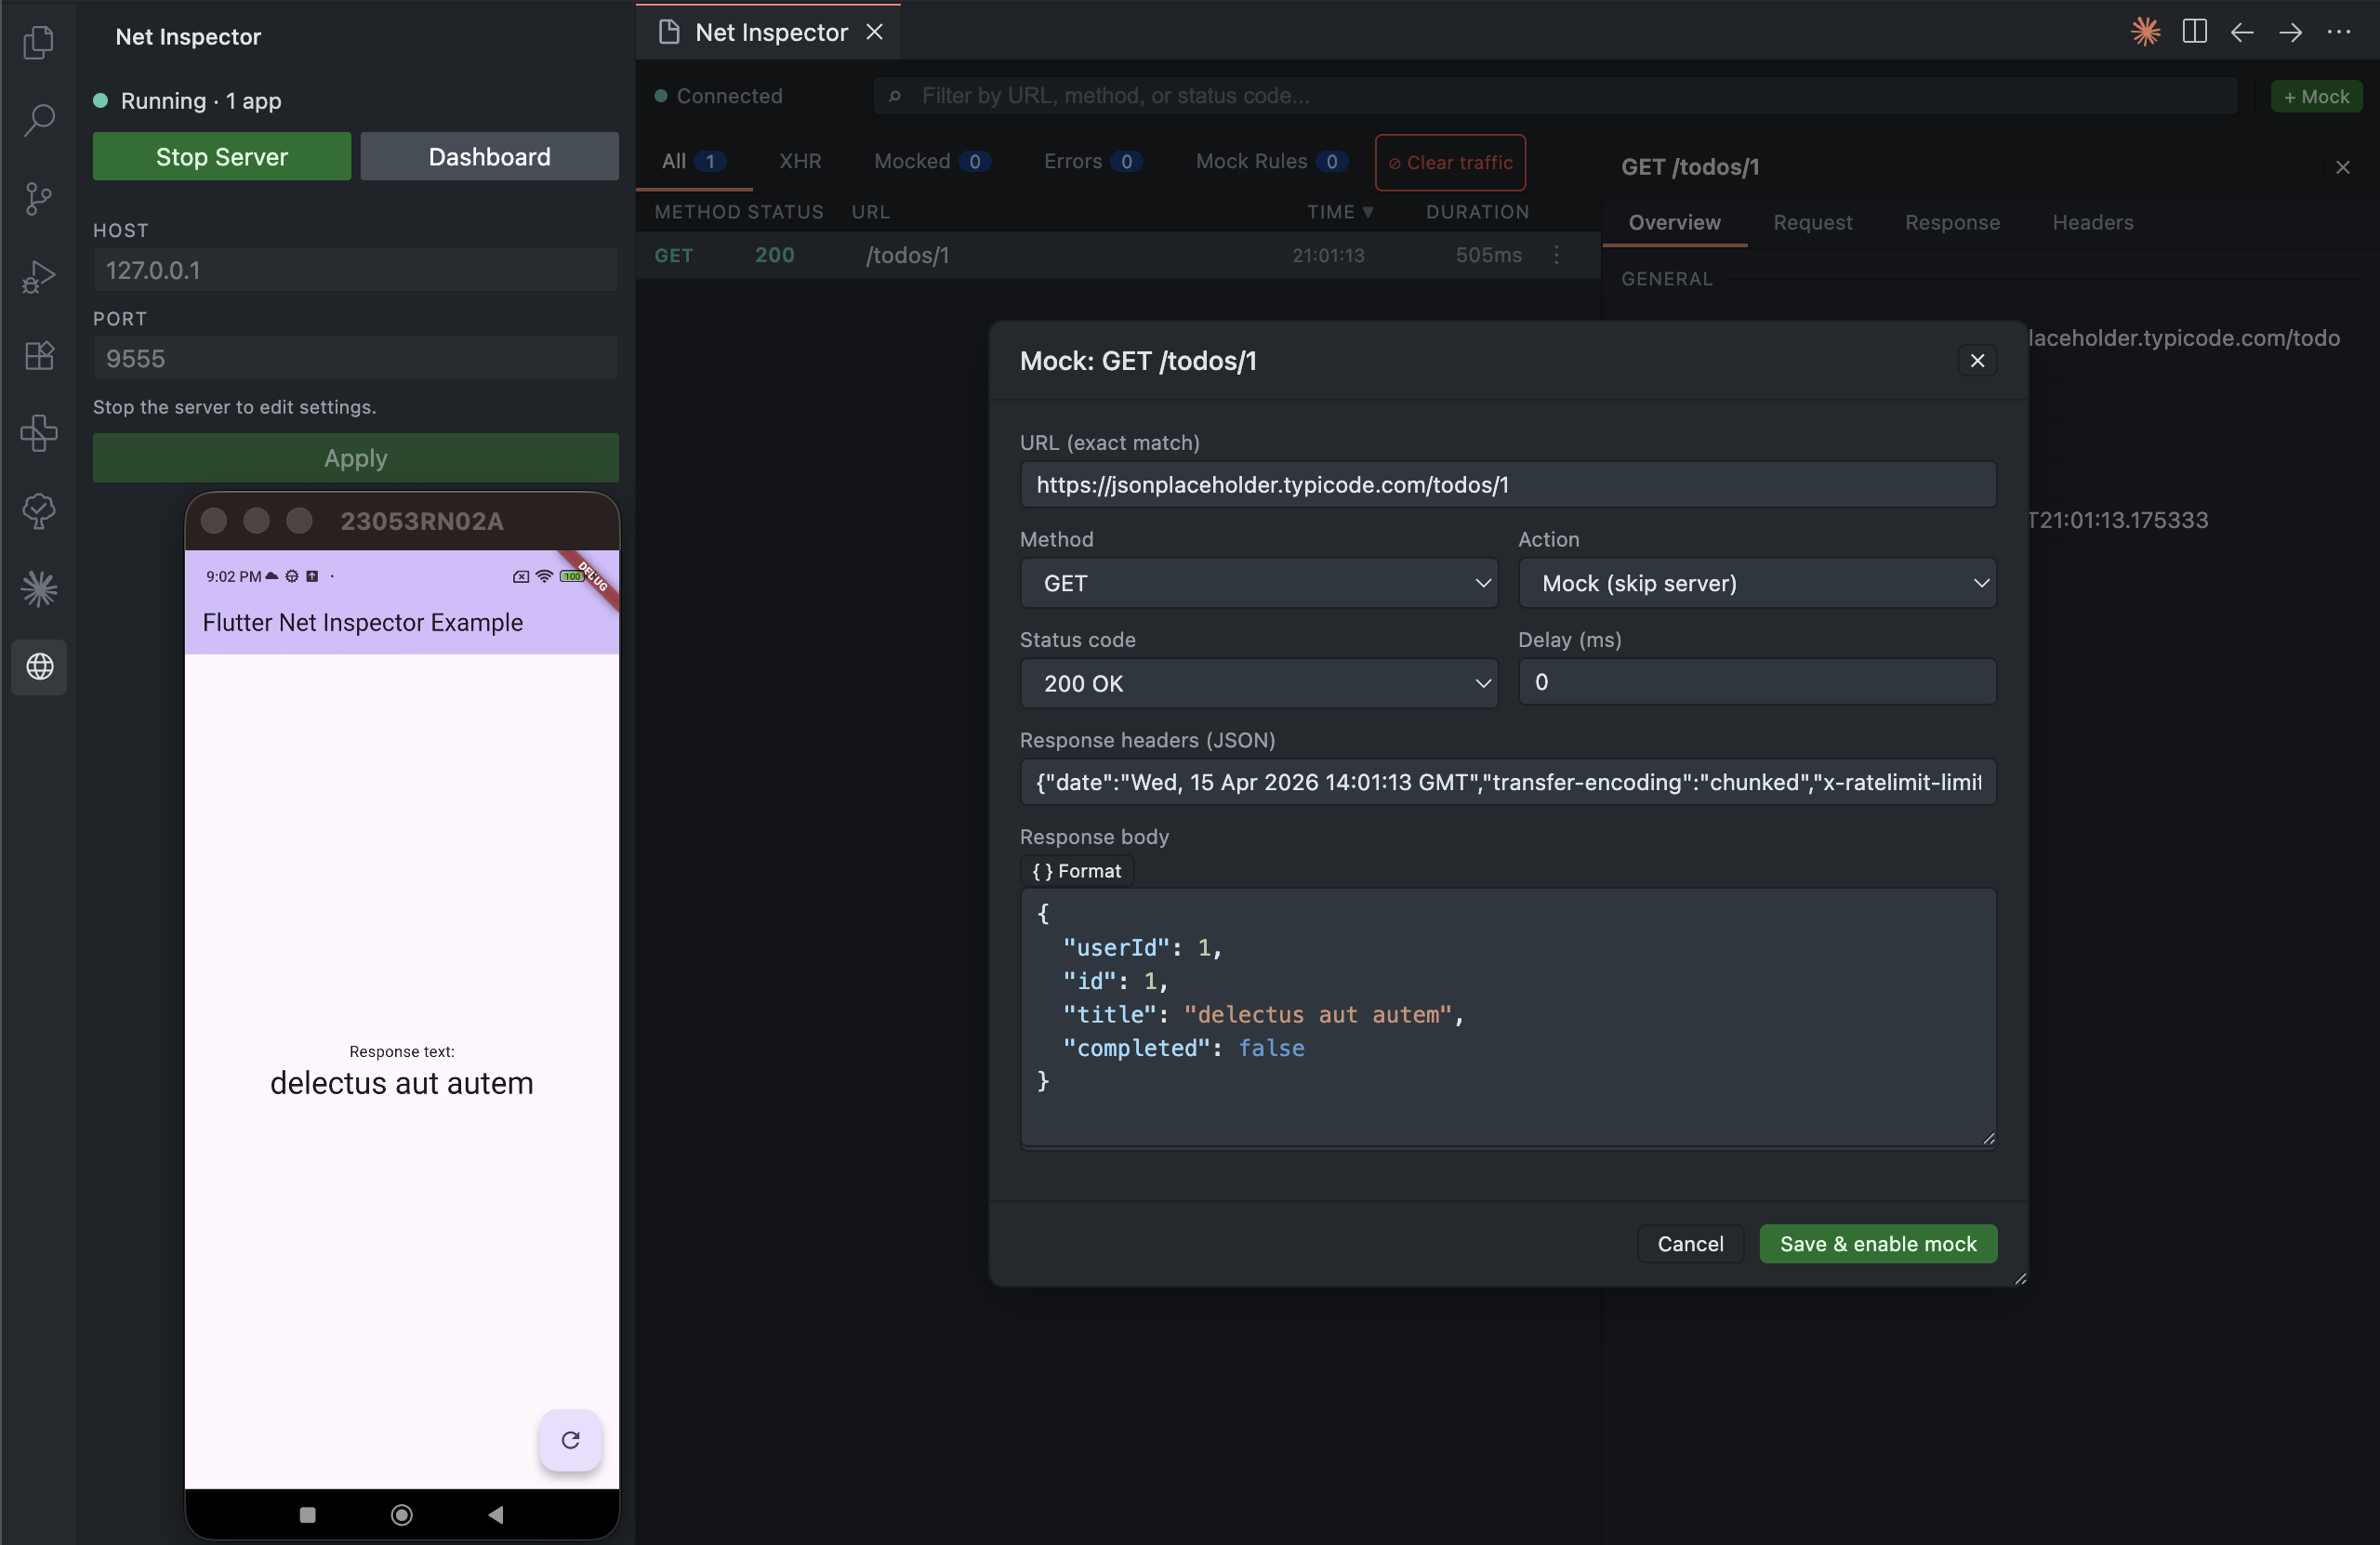
Configure a mock responseThe mock editor opens pre-filled from the selected request. Adjust the status code, headers, response body, or add a simulated delay — then save. The rule takes effect on the next matching request immediately.
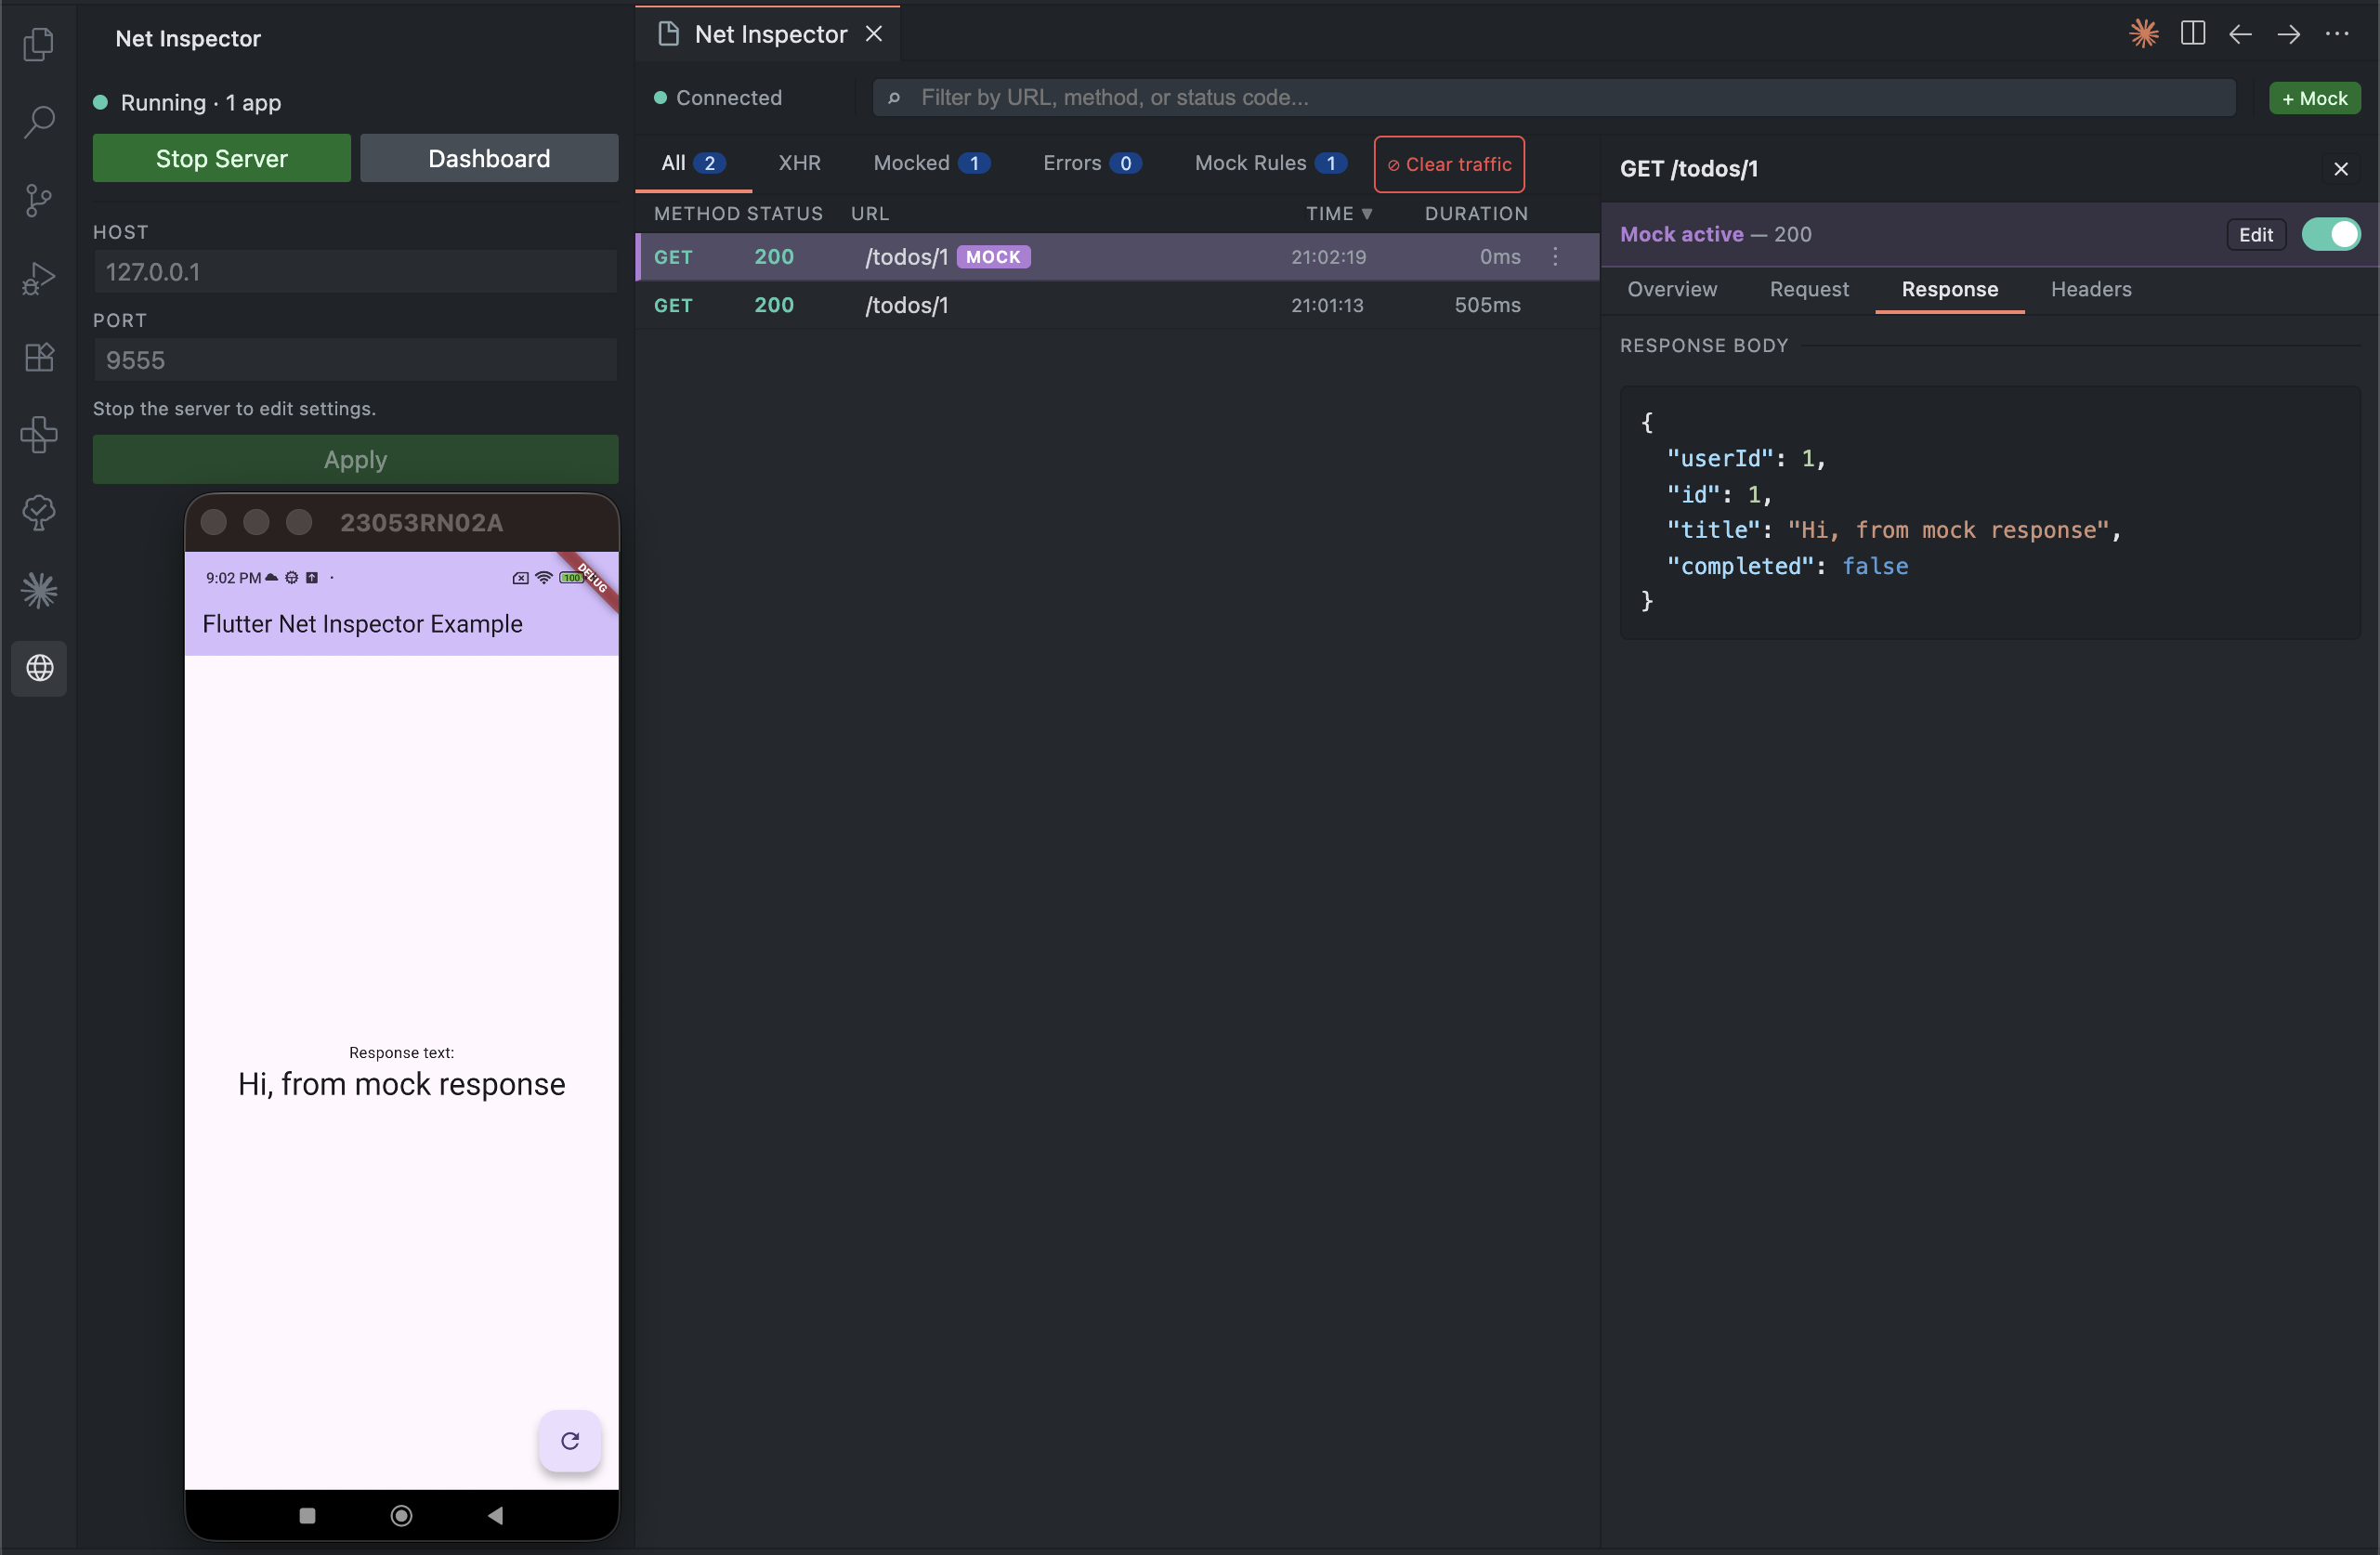
See the mock in actionThe intercepted row is highlighted with a purple indicator. The detail panel shows the mocked response body, and your Flutter app receives exactly the data you configured.
Dashboard overview
Extension settings
Commands
Real device setupBy default the Dart package connects to See the Dart package README for full host configuration options. |