ThermoWorks for VS Code
Display real-time temperatures from your ThermoWorks connected devices (Smoke, Signals, Node, etc.) directly in the VS Code status bar and side panel.
Features
- 🔥 Status Bar Temperature — See live readings at a glance
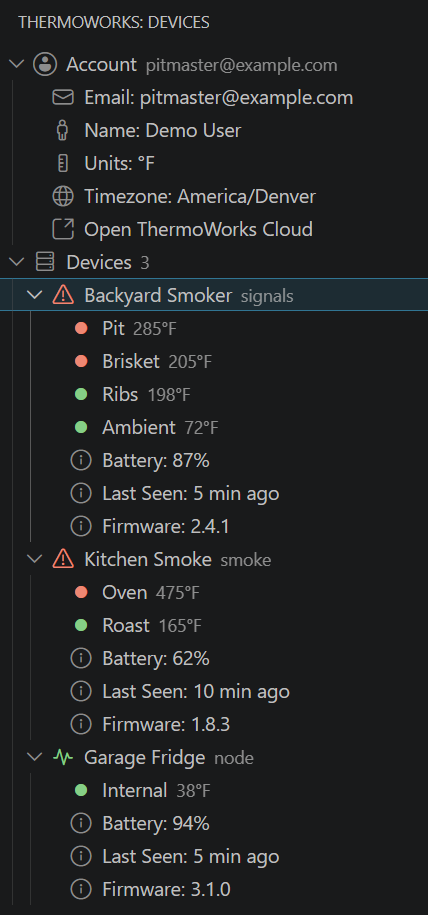
- 📋 Device Panel — Full tree view with all devices, channels, battery, and firmware info
- 📈 Live Temperature Chart — Full-session history with a live tail and alarm threshold lines
- 🚨 Alarm Indicators — Red/blue color-coded alerts with blinking status bar; inline set/clear on each channel
- 🔔 Desktop Notifications — Optional OS notifications when alarms fire
- 🔄 Live Updates — Configurable refresh interval (default 60s, minimum 15s) with optional WebSocket streaming
- 🎛️ Device Control — Set fan target/enable, rename devices, reset min/max
- 📊 Events Panel — Dedicated view with per-device filtering and severity icons
- 🗂️ Sessions — Start, end, and clear monitoring sessions; active timer on device node
- 🌡️ Temperature Guide — Browsable reference for safe cooking temperatures
- 📐 Calibration — View calibration records under each device
- 📉 Data Usage — Total and per-device usage in the Account node
- 🔗 Shared Credentials — Works with the same login as the
thermoworks CLI
- 🤖 AI / Copilot — ThermoWorks data is available to Copilot and AI agents via the MCP server (
thermoworks mcp start); run thermoworks copilot setup to configure
Getting Started
A built-in walkthrough guides you through setup. Open it from the Command Palette:
Get Started: ThermoWorks
Or follow the manual steps below.
1. Login
You can authenticate in two ways:
Option A: VS Code Command
- Open the Command Palette (
Ctrl+Shift+P / Cmd+Shift+P)
- Run ThermoWorks: Login
- Enter your ThermoWorks Cloud email and password
Option B: CLI (shared credentials)
npm install -g thermoworks
thermoworks auth login
2. (Optional) Choose which devices to show
After signing in, the status bar shows one device by default (its average temperature), and the Devices panel lists everything automatically. Change thermoworks.statusBarMode (single, cycle, or all) to control what the status bar shows.
To curate which devices/channels appear in the status bar (e.g. specific probes instead of averages), run the CLI setup:
thermoworks copilot setup
This saves your selection to ~/.thermoworks/config.json, which the extension reads. Without it, the status bar falls back to showing every device.
Commands
| Command |
Description |
ThermoWorks: Login |
Enter your ThermoWorks Cloud credentials |
ThermoWorks: Logout |
Clear stored credentials |
ThermoWorks: Sign In |
Sign in from the tree panel welcome view |
ThermoWorks: Sign Out |
Sign out (right-click account node) |
ThermoWorks: Refresh Temperatures |
Force an immediate temperature refresh |
ThermoWorks: Refresh Panel |
Refresh the device tree panel |
ThermoWorks: Toggle Grouped/List View |
Switch the device panel between grouped and flat list view |
ThermoWorks: Cycle to Next Device |
Advance to the next device in cycle mode |
ThermoWorks: Open Cloud Dashboard |
Open cloud.thermoworks.com |
ThermoWorks: Show Temperature Chart |
Open a live temperature chart for a device |
ThermoWorks: Show Session Chart |
Chart a specific past session from Archives |
ThermoWorks: Show Archive Details |
Open a detailed view of an archived session |
ThermoWorks: Refresh Archives |
Reload the archives list for a device |
ThermoWorks: Configure Alarm |
Set high/low alarm thresholds on a channel |
Set Alarm... |
Inline: set alarm on a channel node |
Clear Alarm |
Inline: clear alarm on a channel node |
ThermoWorks: Show Event Details |
Show full details for a device event |
ThermoWorks: Refresh Events |
Reload the Events panel |
ThermoWorks: Filter Events by Device |
Filter events to a single device |
ThermoWorks: Show All Events |
Clear the events device filter |
Set Target Temp… |
Set the fan controller target temperature |
Fan On/Off… |
Toggle the fan controller |
Rename Device… |
Rename a device |
Reset Min/Max |
Reset the min/max readings on a channel |
Add to Group… |
Add a device to a group |
Remove from Group |
Remove a device from its group |
ThermoWorks: Start Session |
Start a monitoring session |
ThermoWorks: End Session |
End an active monitoring session |
ThermoWorks: Clear Session |
Clear session data (with confirmation) |
ThermoWorks: Temperature Guide |
Browse safe cooking temperature references |
ThermoWorks: Demo (Simulate Alarm) |
Show fake data with selectable alarm state |
Settings
| Setting |
Default |
Description |
thermoworks.refreshInterval |
60 |
Temperature refresh interval in seconds (minimum 15) |
thermoworks.statusBarMode |
single |
Status bar display mode: single shows one device, cycle rotates, all shows all compactly |
thermoworks.cycleInterval |
5 |
Seconds between device rotations in cycle mode (minimum 1) |
thermoworks.defaultDevice |
"" |
Preferred device for status bar in single mode (match by serial or label, case-insensitive) |
thermoworks.streaming |
true |
Enable live streaming for real-time updates. When false, only interval-based polling is used |
thermoworks.units |
auto |
Temperature display units: auto uses native units, F converts to Fahrenheit, C converts to Celsius |
thermoworks.eventsLimit |
20 |
Maximum number of events to display in the Events panel (1-500) |
thermoworks.archivesLimit |
20 |
Maximum number of past sessions (archives) to list per device (1-500) |
thermoworks.notifications |
true |
Show desktop notifications when a temperature alarm triggers |
Device Panel
The extension adds a ThermoWorks: Devices panel to the VS Code sidebar showing:
- Account info — email, display name, preferred units, timezone, account type, data usage
- All devices — with type, online/offline status, session timer, and alarm badges
- Channel readings — color-coded (green = normal, red = high alarm, blue = low alarm)
- Device metadata — battery %, last seen, firmware version, average temperature
- Fan controller — target temperature and state (Signals devices)
- Calibration records — date, result, and adjustment points
- Firmware alerts — orange warning when a device has outdated firmware
- Past sessions — expand a device's Archives to browse completed sessions; each shows per-channel min/max, and the graph icon charts that session's full history
- Badge count — activity bar icon shows number of devices with active alarms
The panel updates live on the configured refresh interval via a shared per-device subscription. The device list is cached for 5 minutes (devices rarely change), while channel readings stream in at the configured interval.
Firmware Update Detection
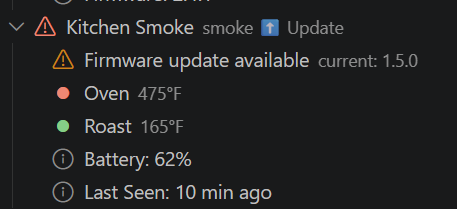
The extension compares each device's current firmware version against the latest available version from ThermoWorks Cloud. If a device is outdated, an orange "Firmware update available" warning is visible at every level of the tree:
- Devices folder — shows "1 update available" in the description with an orange alert icon
- Device node — shows "⬆️ Update" next to the device type, with an orange alert icon
- Device children — shows "Firmware update available" with the current version
Firmware info is cached for 1 hour (releases are infrequent).
Events Panel
A dedicated Events view shows device events (alarms, connections, config changes) with:
- Severity-coded icons (critical, warning, info)
- Time-ago descriptions
- Per-device filtering via the toolbar
- Configurable event limit
Status Bar
The extension shows temperatures in the format:
🔥 Smoker:225°F · Meat:145°F
Hover for a detailed tooltip with all device and channel information.
Alarm Indicators
When a device channel's alarm triggers, the status bar changes appearance:
- High alarm — Red background (error styling) + blinking text
- Low alarm — Blue text + blinking text
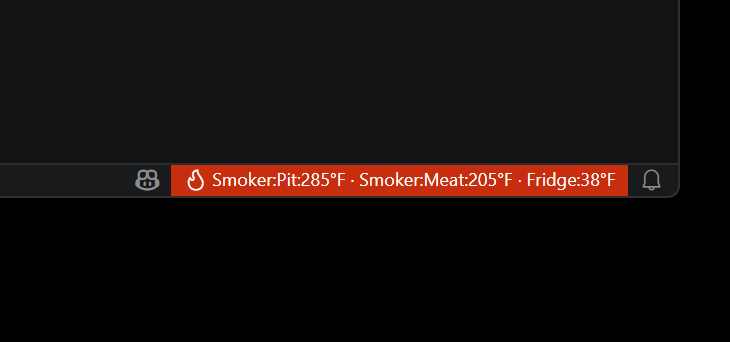
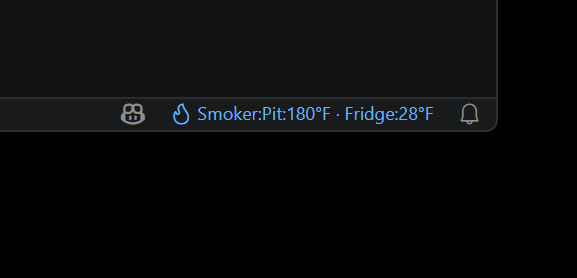
Alarms are detected automatically from the alarmHigh.alarming and alarmLow.alarming fields on each channel. The highest severity alarm across all displayed channels determines the style (high takes priority over low).
Requirements
- A ThermoWorks Cloud account
- At least one connected ThermoWorks device (Smoke, Signals, Node, etc.)
Publishing to VS Code Marketplace
This extension is published under publisher jongio. To publish a new version:
cd packages/vscode
pnpm build
pnpm package   # creates .vsix file
pnpm publish   # publishes to marketplace (requires PAT)
First-Time Setup
- Register as a publisher at https://marketplace.visualstudio.com/manage
- Create an Azure DevOps Personal Access Token (PAT) with Marketplace (Publish) scope
- Run
npx vsce login jongio and paste your PAT
License
MIT

