.NET InsightsMonitor .NET Processes for GC information in real time, or drill into .NET DLLs by viewing the IL and compiled code. Relies on ildasm and a public .NET JIT tool PMI. Installation Launch VS Code Quick Open ( Ctrl+P), paste the following command, and press enter.Copied to clipboard |

.NET InsightsThis extension uses Unsigned tools. This extension is not meant to be used in a production environment An extension for drilling into .NET MSIL and Jitted ASM for managed executables (PE Files). This is a cross platform extension that works on Linux (Ubuntu) OSX and Windows x64. The extension has a few different quality of life improvements. It is intended as an extension to improve .NET development in general. Please see the full feature list below. Future work to include Linux arm64. Currently 32-bit support is not expected to be worked on; however, feel free to contribute. IssuesThere are known issues with the extension. See Bugs for more information. OverviewTOCGC MonitoringThe extension allows for monitoring all .NET Core applications that are running on the target machine. The extension will use TraceEvent to connect to all .NET Core applications 3.x+ to receive GC allocation, start and stop events. It will then compile the information per heap and display it by process.
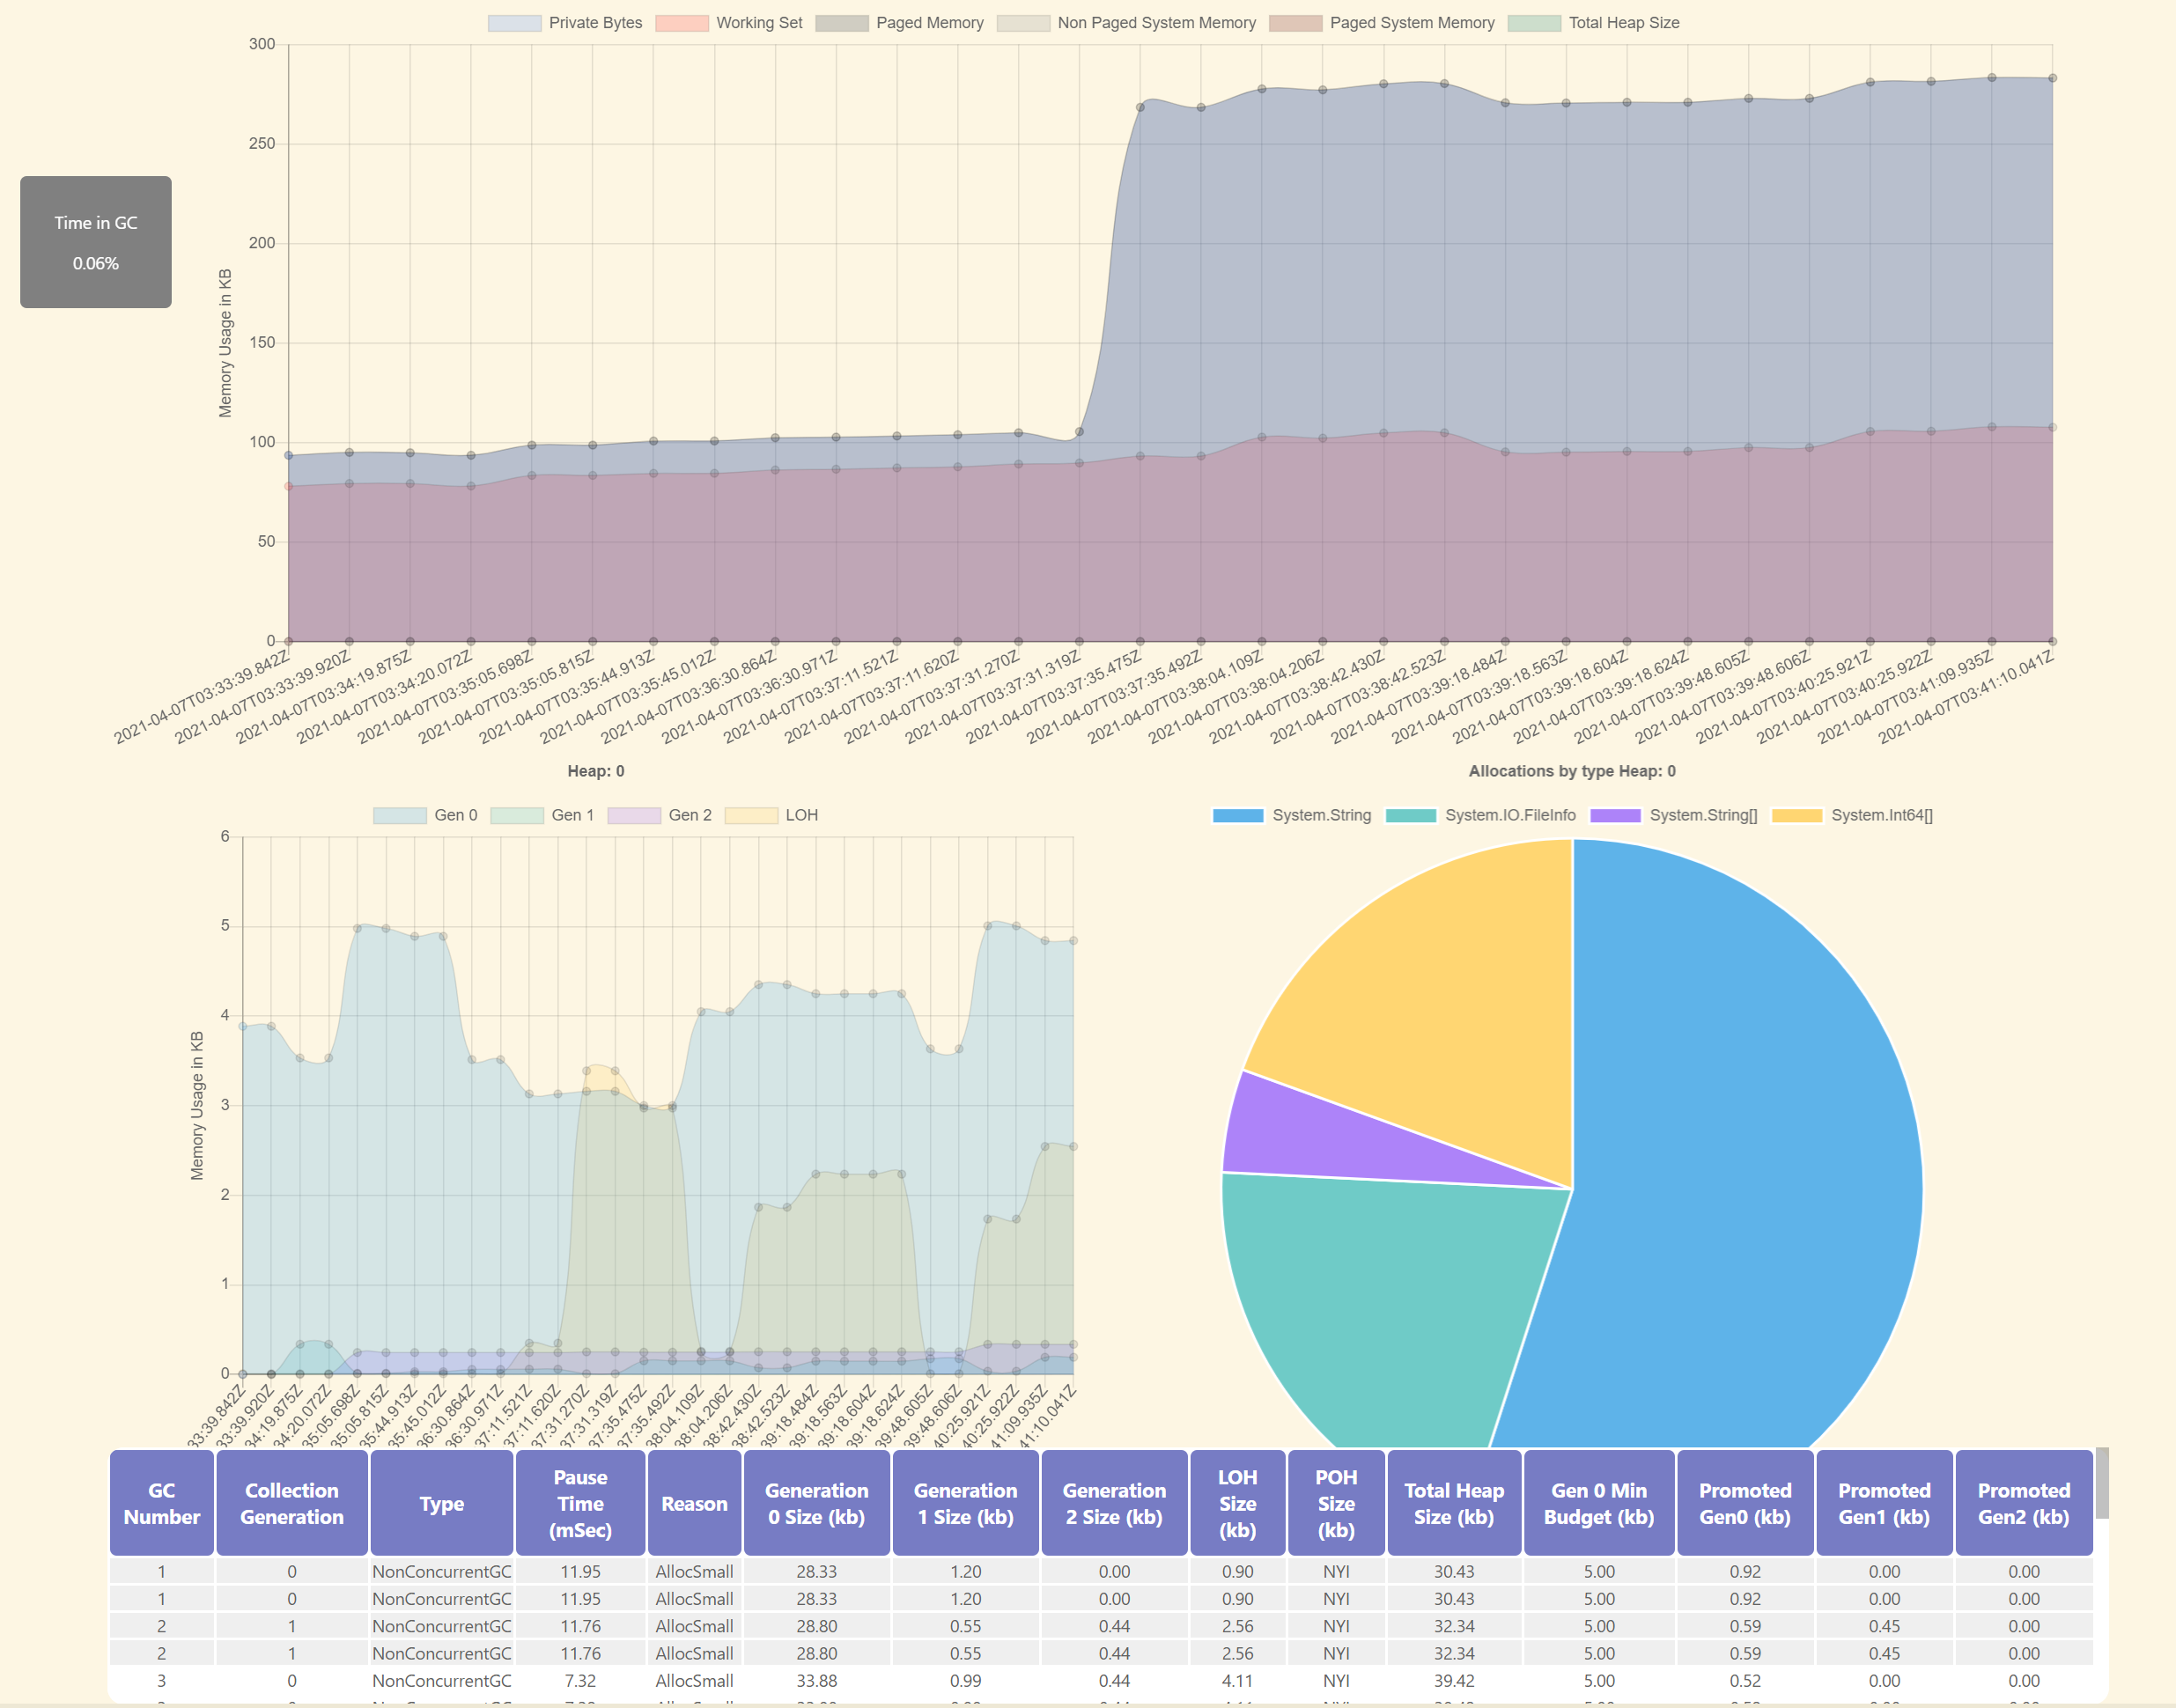
GC Monitoring Usage
At this point you have started a background server which will monitor and communicate back to the .NET Insights extension. This is expensive both for VScode and ALL running .NET Applications on the machine. After monitoring the Stop GC Monitoring Command via ctrl (cmd) + shift + p!Navigate to the When a process is selected a custom view will come up with the GC Statistics for the process during the monitor window. Please remember that the GCs display are only post the monitor command, and pre the stop monitoring command. This is defined to be the monitoring window. While selected, real time information about GCs will continue to update in realtime.
Saving GC Files for later
Reading Raw Data from PerfviewPerfview is an extremely powerful tool for viewing GC data. While the extension will not go into depth on how to collect via perfview, we can instead understand how to capture raw gc data from perfview and visualize it in .NET Insights. An existing or future perfview collection which has GC data can be exported as raw data. An example of this would be the following: `
You will see the gc events visualized similarly to a collection done using the extension. Note that there are a few caveats to this. First, there is no allocation information in the same way there is allocation information with the extension. Second, some events are recorded differently with Perfview and may not have the same fidelity.
IL / DASM on SaveC# Extension is required. Showing IL/Dasm on save allows viewing the IL/ASM for a generated file quickly without inspecting the PE file. It specifically is useful when attempting to optimize a particular method. It is possible to view the IL as it is being changed, and then the optimized ASM that would be produced. Another slightly advanced feature is being able to view the JIT's output for the method JITTed. This advanced feature allows investigating what happened while JITTing the method, and allows understanding why a particular optimization may or may have not fired.
Inspect PE File
NotesDumping the ASM for a Debug built DLL will always dump debuggable code (Tier 0). The first startup of the extension will download five private builds of the .NET runtime 6.0 and 7.0, 8.0, 9.0 and 10.0. This is expected to take ~5 minutes to setup. Future planned work |