Logvane for VS Code
Write and run KQL against Microsoft Sentinel and any Azure Monitor Log Analytics workspace without leaving VS Code.
It is Logvane's engine (the same IntelliSense, lint rules, formatter and query runner as the desktop
app) in a VS Code extension, so it runs on Windows, macOS and Linux.
Free, and read-only unless you switch incident changes on for a workspace. Prefer a standalone app? The same features
are in the Logvane desktop app for Windows, macOS and Linux.
Features
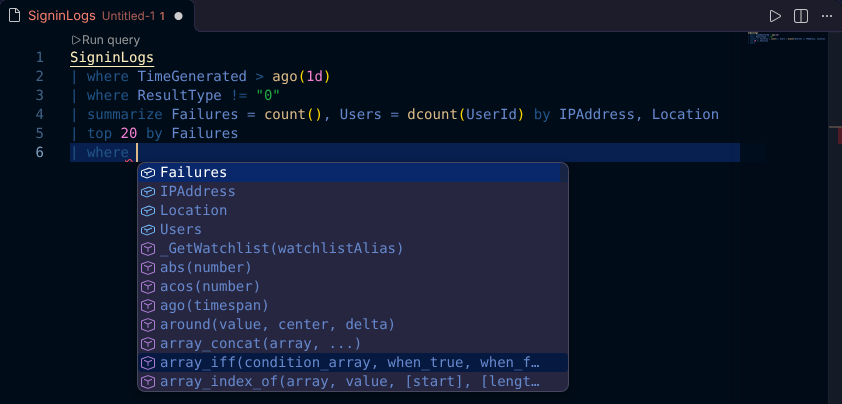
- IntelliSense in
.kql, .csl and .kusto files from Microsoft's own KQL parser: tables, columns (including
ones made by extend, project and summarize), operators, functions and your workspace's saved functions.
- Hover docs with a link to the Microsoft Learn page, and signature help inside function calls.
- Linting: the parser's errors plus the app's rules (no
TimeGenerated filter, a join with no time window,
search or union * across every table, contains where has would do, with a quick fix).
- Format document (Shift+Alt+F) with the parser's formatter.
- Run the query under the cursor (queries are separated by blank lines) or the selection with F5 or Shift+Enter,
the play button in the editor title, or the Run query link above each query.
F5 runs the query only in a KQL editor and not while debugging. To change any shortcut, open Keyboard Shortcuts
(Ctrl+K Ctrl+S) and search for "Sentinel".
- Results in the bottom panel: run time, rows and data scanned, a filter box, sortable columns, Load more for big
results, Copy all (tab-separated, CSV or a Markdown table), Copy as table (a bordered table that pastes into Word or Outlook), Export… (CSV, Excel .xlsx, Markdown or JSON) and Open as JSON. Double-click a cell to copy it, or right-click it for Copy value and Copy row.
When the service's 64 MB size limit cuts a result off, it names the biggest and empty columns, and
Leave columns out adds the
project-away to the query and runs it again.
- Stats and summary for a column: right-click a column header for its rows, distinct and empty values, the range
of numbers or times, and the rows counted per value (top 10, 20 or 40, plus Other)
or per time bin for a datetime, as bars, a pie or a line, with the counts and percentages beside it. Right-click a
value to filter the query to it or leave it out; Add to query writes the same
summarize and render into the
query and runs it. "Summarize by … in the query" on the header menu does that straight away.
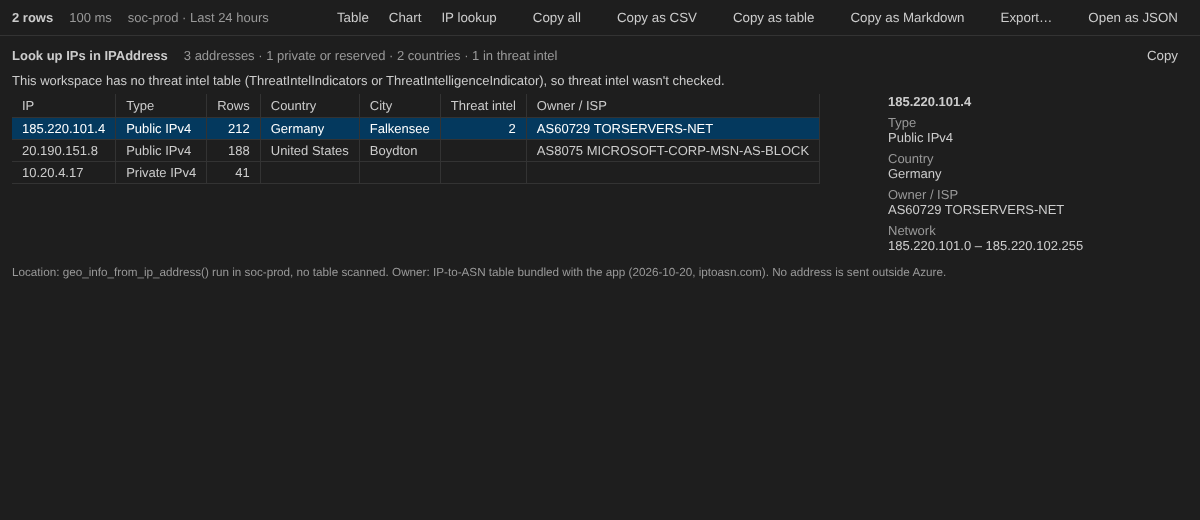
- Look up IP: right-click an IP address cell, or Look up IPs in … on a column header, for each address's
location (from
geo_info_from_ip_address() in the workspace), owner or ISP (from a table bundled with the
extension) and any threat intel indicators in the workspace. Right-click an address to filter the query to it.
Nothing is sent outside Azure.
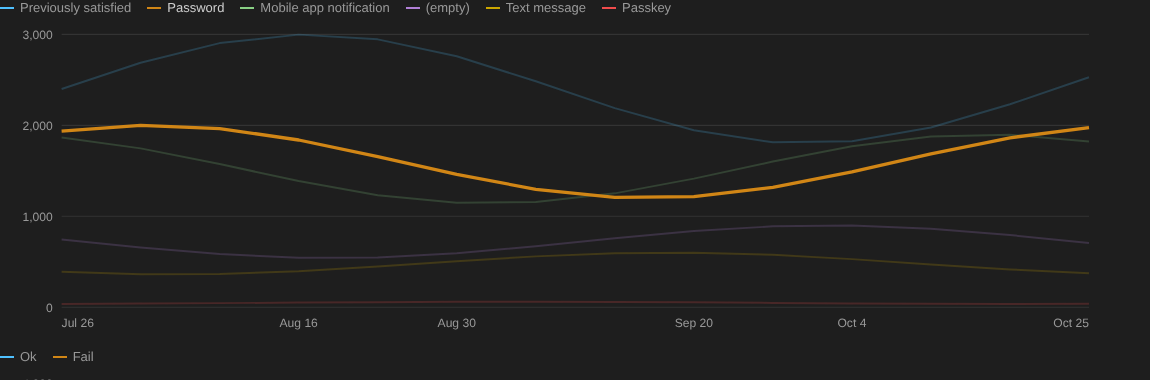
- Chart view of a result (lines over time, bars, or a pie with
render piechart), with Compare to run the query
again over the previous period or the same time last week and draw it dashed under the current lines or bars (a
fainter inner ring on a pie), with how each bar or slice moved ("+39%", "new", "gone"), Sort by change for bars,
and the change in the totals. Drag
across a time chart to run the query again over that time (widened to whole bins; the time range setting stays).
Draw as switches between line, area, stacked area, column, stacked column, scatter, anomalies and pie; Auto
follows the query's render, and a make-series result charts one point per array item.
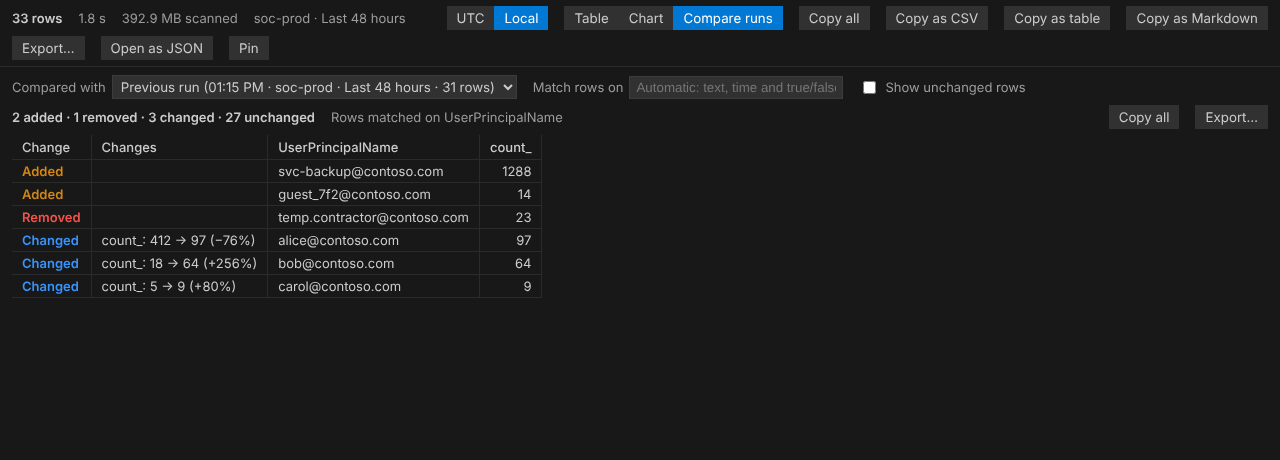
- Compare runs: the result against the previous run or a pinned one (Pin in the results bar), row by row:
added, removed and changed rows, with how each value moved, e.g. "count_: 412 → 97 (−76%)". It runs no query.
- Several accounts and workspaces: add accounts to reach other tenants, and Also run on to run each query on
more workspaces in any tenant, with Workspace and Tenant columns in the results.
- Rule change impact (right-click › Rule change impact): the query at the cursor against the current
version of the rule (an analytics rule in the workspace, with its schedule; this file at its last git commit;
another open query or a saved one), both replayed on the rule's schedule over the last 7, 14 or 30 days, with the
alerts each would have raised by day or by run. Compare rows then shows, for one day, which alerts the change
stops and which it adds, matched on the rule's entity columns.
- Incidents (its own icon in the activity bar): the workspace's Microsoft Sentinel incidents from the SecurityIncident table, open
ones first, filtered by status, severity, period, owner and search text (filters are shared with the desktop app),
refreshed every five minutes while showing, with a badge for new ones. The view's workspace button lists another
Sentinel workspace's incidents without changing the workspace your queries use. Click one for its alerts, entities, timeline
and comments, with buttons that open its rule query over the window it ran, the alert rows, a pivot on an entity,
Look up IP, and Rule change impact on its rule. The incident page's Pop out button moves it into its own window. It is read-only unless you switch incident changes on for the
workspace (Incident changes… in the view's menu): then right-click an incident, or use the incident page's buttons, to
assign, change status or severity, edit labels, comment or close it, and select up to 20 to assign or close together. Every
change asks first.
- Export as analytics rule (right-click › Export as analytics rule): the query at the cursor as a scheduled rule
file, in YAML (the Azure-Sentinel repository format), an ARM template or Bicep, with entities guessed from the
query's columns. It opens as a new file to review and save; nothing is sent to Sentinel.
- Scan estimate in the status bar: about how much data the query at the cursor will read, from each table's
daily volume times the time range, amber above
logvane.scanWarningGigabytes. Basic and Auxiliary tables,
billed per query, are marked in the table explorer, and the linter flags what those tables can't run.
- Workspace functions: hover one to see the start of its code, or Go to Definition (F12) to open all of it.
- Sidebar: your connection, a table explorer grouped by category, and the query library (saved queries and
the built-in common queries). Ctrl+E searches tables and columns.
- Microsoft hunting queries (the search button on the library, or "Search Microsoft hunting queries"): about
2,500 hunting queries from Microsoft's Azure-Sentinel repository, searchable by name, table, MITRE tactic or
technique. Ones that need a table the workspace doesn't have are marked, and each links to its file on GitHub.
- Status bar: workspace, time range and row limit; click any of them to change it.
- Get started walkthrough on the VS Code Welcome page (or "Logvane: Get started"): signing in, choosing a
workspace, running a query, the results, the library and rule checks, each with a button to try it.
- What's new: after an update, a notification offers the notes of every release since the version you last ran;
"Logvane: What's new" shows them any time.
Sign-in and shared settings
Sign in with your Entra ID account in the browser (Logvane: Sign in to Azure). On the same machine the extension and
the desktop app share the sign-in and added accounts, recent and pinned workspaces, the schema cache and saved queries, so switching
between them needs no setup.
Read-only
The extension never changes anything in Azure, except incidents in a workspace you switched incident changes on for
yourself. Its language server sends every request through the same guard as the desktop app, which allows only the
reads it needs (listing workspaces, schemas and analytics rules, and running queries), plus reading, updating and
commenting on one confirmed incident at a time where changes are on, and refuses and logs anything else. Log
Analytics Reader and Microsoft Sentinel Reader are all the roles it needs to read; changing incidents needs
Microsoft Sentinel Responder.
Requirements
The extension's language server runs on .NET 10. The .NET Install Tool extension, installed with this one, provides
the runtime when the machine doesn't have it. To use a specific dotnet, set logvane.dotnetPath.
Settings
| Setting |
Default |
|
logvane.timeRange |
Last 24 hours |
The time range queries run over. "Set in query" lets the query's own filter decide. |
logvane.rowLimit |
10000 |
The most rows a run returns; 0 is the service's maximum of 500,000. |
logvane.performanceLog |
off |
Writes timings (start-up, workspace restore, table loads, query runs) to performance-vscode.log in the Logvane logs folder, to find what is slow. No query text or results. |
logvane.dotnetPath |
|
The dotnet that runs the language server. |
logvane.serverPath |
|
For development: a language server build to run instead of the bundled one. |
| |

