MCP Eavesdrop - Agent MCP Call MonitorMonitor MCP tool calls from AI agents in real time Installation Launch VS Code Quick Open ( Ctrl+P), paste the following command, and press enter.Copied to clipboard |
MCP Eavesdrop Extension
Pronounced "em-see-peevesdrop". What Is This?
When an AI agent (Copilot, Cursor, or any MCP-compatible agent) processes a prompt, the extension shows you what's happening behind the scenes: which tools are being called, with what arguments, how long each call takes, and what was returned. After the agent finishes, you can review the full session timeline.
Why This ExistsAI agents operating in editors are increasingly autonomous — they can read files, run searches, call external services, and chain multiple tool calls together to fulfill a single prompt. This activity is currently invisible to the user. You submit a prompt and eventually get a result, with no insight into what happened in between. This extension addresses that gap by acting as an observable MCP proxy layer between the agent and its tools. Core ConceptsMCP ProxyThe extension manages a shared background daemon ( The user reconfigures their MCP tool endpoints (in Shared IPC DaemonAll open IDE windows (VS Code, Cursor, or any VS Code fork) connect to a single shared daemon process rather than each window running its own proxy. This means:
The daemon writes its state to
|

| Path | Purpose |
|---|---|
~/.mcpEavesdrop/daemon.json |
Daemon PID, proxy port, socket path (written at startup) |
~/.mcpEavesdrop/ipc.sock |
Unix domain socket for per-window → daemon IPC |
~/.mcpEavesdrop/ipc.lock |
Bootstrap lock (prevents duplicate daemon spawns) |
~/.mcpEavesdrop/stdio-wrapper.js |
Deployed wrapper script injected into mcp.json entries |
~/.mcpEavesdrop/logs/{ide}/{date}/{server}.jsonl |
Wrapper-written NDJSON event log (new format) |
~/.mcpEavesdrop/logs/{ide}/{workspace}.jsonl |
Daemon-written NDJSON event log (legacy-compatible format) |
Manual daemon restart
If the daemon gets into a bad state (e.g., stale lock after a crash):
- Kill the daemon:
kill $(jq .pid ~/.mcpEavesdrop/daemon.json) - Remove stale files:
rm -f ~/.mcpEavesdrop/ipc.sock ~/.mcpEavesdrop/ipc.lock - Reload any open VS Code/Cursor window (⌘⇧P → "Developer: Reload Window")
The extension will automatically spawn a fresh daemon on next activation.
Event Stream
The proxy emits a structured event stream (SSE) for every tool lifecycle event: tool_call_started, tool_call_completed, tool_call_failed. Each window's extension subscribes to the daemon's SSE stream and relays events to its local webview panel in real time.
Events carry attribution fields for filtering and display:
ide— which IDE initiated the call (e.g.vscode,cursor)conversationId— the VS Code chat session that triggered the call- Missing
conversationIdvalues are rendered and filterable asnot detected
WebView Panel
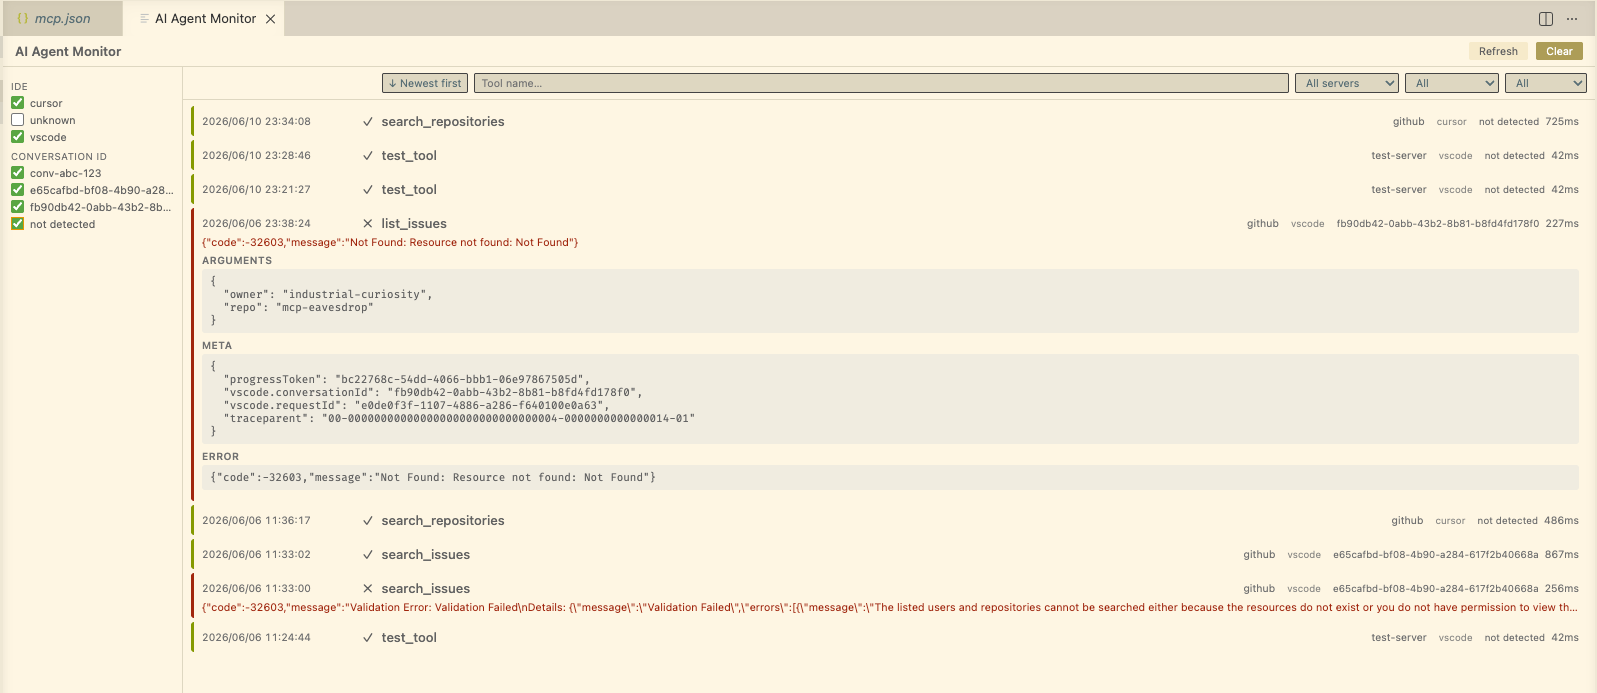
A VS Code WebView panel renders the live activity feed and historical session log. The panel layout has two columns: a connections sidebar on the left and a main content area on the right.
The main content area contains:
- A filter bar with five controls:
- Sort order — toggle between newest-first and oldest-first log ordering
- Tool name — text search for substring matches on tool names (case-insensitive)
- Server — select to show calls from a specific MCP server (populated dynamically as events arrive)
- Status — filter by call status: All, In-progress, Completed, or Failed
- Time range — filter by recency: All, Last hour, or Today
- A log showing the tool call timeline:
- A left-side timestamp column for each call row (local date + time)
- Which tool is currently executing (with a spinner)
- A source column for IDE and a dedicated conversation ID column (
not detectedwhen absent) - A timeline of all tool calls in the current session
- Expandable detail for each call: arguments, response, duration, status, and
metawhen present
The connections sidebar includes IDE and conversation filter groups. Each value has a checkbox to show or hide matching tool calls. Missing conversation metadata appears as not detected. This filter state persists in localStorage across panel reloads. Filter bar state (tool name, server, status, time) resets each time the panel opens.
The toolbar includes a Refresh button (left of Clear) that re-runs the initial panel load behavior (status, connections, history) without closing/reopening the panel.
Compatibility
This extension uses only the standard VS Code extension API (vscode.*) and is intended to be fully compatible with all VSCodium-based editors without modification. VS Code and Cursor are both explicitly supported; both can connect to the same daemon simultaneously.
MCP Monitoring
MCP Eavesdrop can monitor stdio MCP servers by wrapping your user mcp.json entries.
Enable Monitoring
Run MCP Eavesdrop: Enable MCP Monitoring from the Command Palette.
- MCP Eavesdrop detects whether you are running VS Code or Cursor.
- MCP Eavesdrop resolves your user config path (
mcp.json) and shows it before making changes. - You will usually see one trust prompt per MCP server after the file is rewritten.
Disable Monitoring
Run MCP Eavesdrop: Disable MCP Monitoring.
- MCP Eavesdrop restores each wrapped entry back to its original command/args/env.
- If nothing is wrapped, MCP Eavesdrop shows an informational message and leaves files unchanged.
Restart Daemon
Run MCP Eavesdrop: Restart Daemon from the Command Palette.
- MCP Eavesdrop force-restarts the shared daemon process.
- MCP Eavesdrop re-registers the current window and restores panel connectivity/status.
- Use this when daemon state seems stale or panel connectivity is stuck.
If Extension Is Uninstalled Before Disable
This extension includes a vscode:uninstall lifecycle script that attempts to restore wrapped entries automatically and remove ~/.mcpEavesdrop/.
If that hook does not run in your environment:
- Reinstall and run
MCP Eavesdrop: Disable MCP Monitoring, or - Manually restore entries by replacing wrapped
node ~/.mcpEavesdrop/stdio-wrapper.js ...entries with the original values stored inMCPEAVESDROP_REAL_SERVER.
What This Extension Cannot Do
- Observe the model's internal reasoning or chain-of-thought (not exposed by any editor)
- Intercept built-in (non-MCP) tool calls made natively by Copilot or Cursor
- Access LLM API traffic directly (that is handled by the editor, not the extension)
Intended Audience
Developers building or debugging AI agent workflows who want operational visibility into MCP tool usage without leaving their editor.
AI Prompts and Skills
This repository ships OpenSpec workflow prompts and skills for both GitHub Copilot and Cursor.
- Skills live in
.agents/skills/— the Agent Skills cross-client convention, scanned directly by compatible clients.
Skill Quality Analysis on Save
The Chat Customizations Evaluations extension analyzes skill files for issues (ambiguous activation conditions, persona conflicts, missing inline summaries, etc.). To trigger analysis automatically on every save of a SKILL.md file, add this to your keybindings.json (Cmd+Shift+P → "Preferences: Open Keyboard Shortcuts (JSON)"):
{
    "key": "cmd+s",
    "command": "runCommands",
    "args": {
        "commands": [
            "workbench.action.files.save",
            "chatCustomizationsEvaluations.analyzePrompt"
        ]
    },
    "when": "editorTextFocus && resourceFilename == 'SKILL.md'"
}