
T-SQL Step DebuggerPreviewClient-side, interpreter-driven step debugger for T-SQL / MSSQL (SQL Server) stored procedures, functions, and scripts — no engine-side debug support required. Installation Launch VS Code Quick Open ( Ctrl+P), paste the following command, and press enter.Copied to clipboard |

T-SQL Step Debugger
A client-side step debugger for T-SQL stored procedures, functions, and scripts. No
engine-side debug support required — no SSDT, no It comes in two surfaces over the same debugger core:
Targets SQL Server 2016+; the interactive adapter ships self-contained for Windows (x64).
The full design is in Debug T-SQL in VS CodeSet a breakpoint in a Quick start
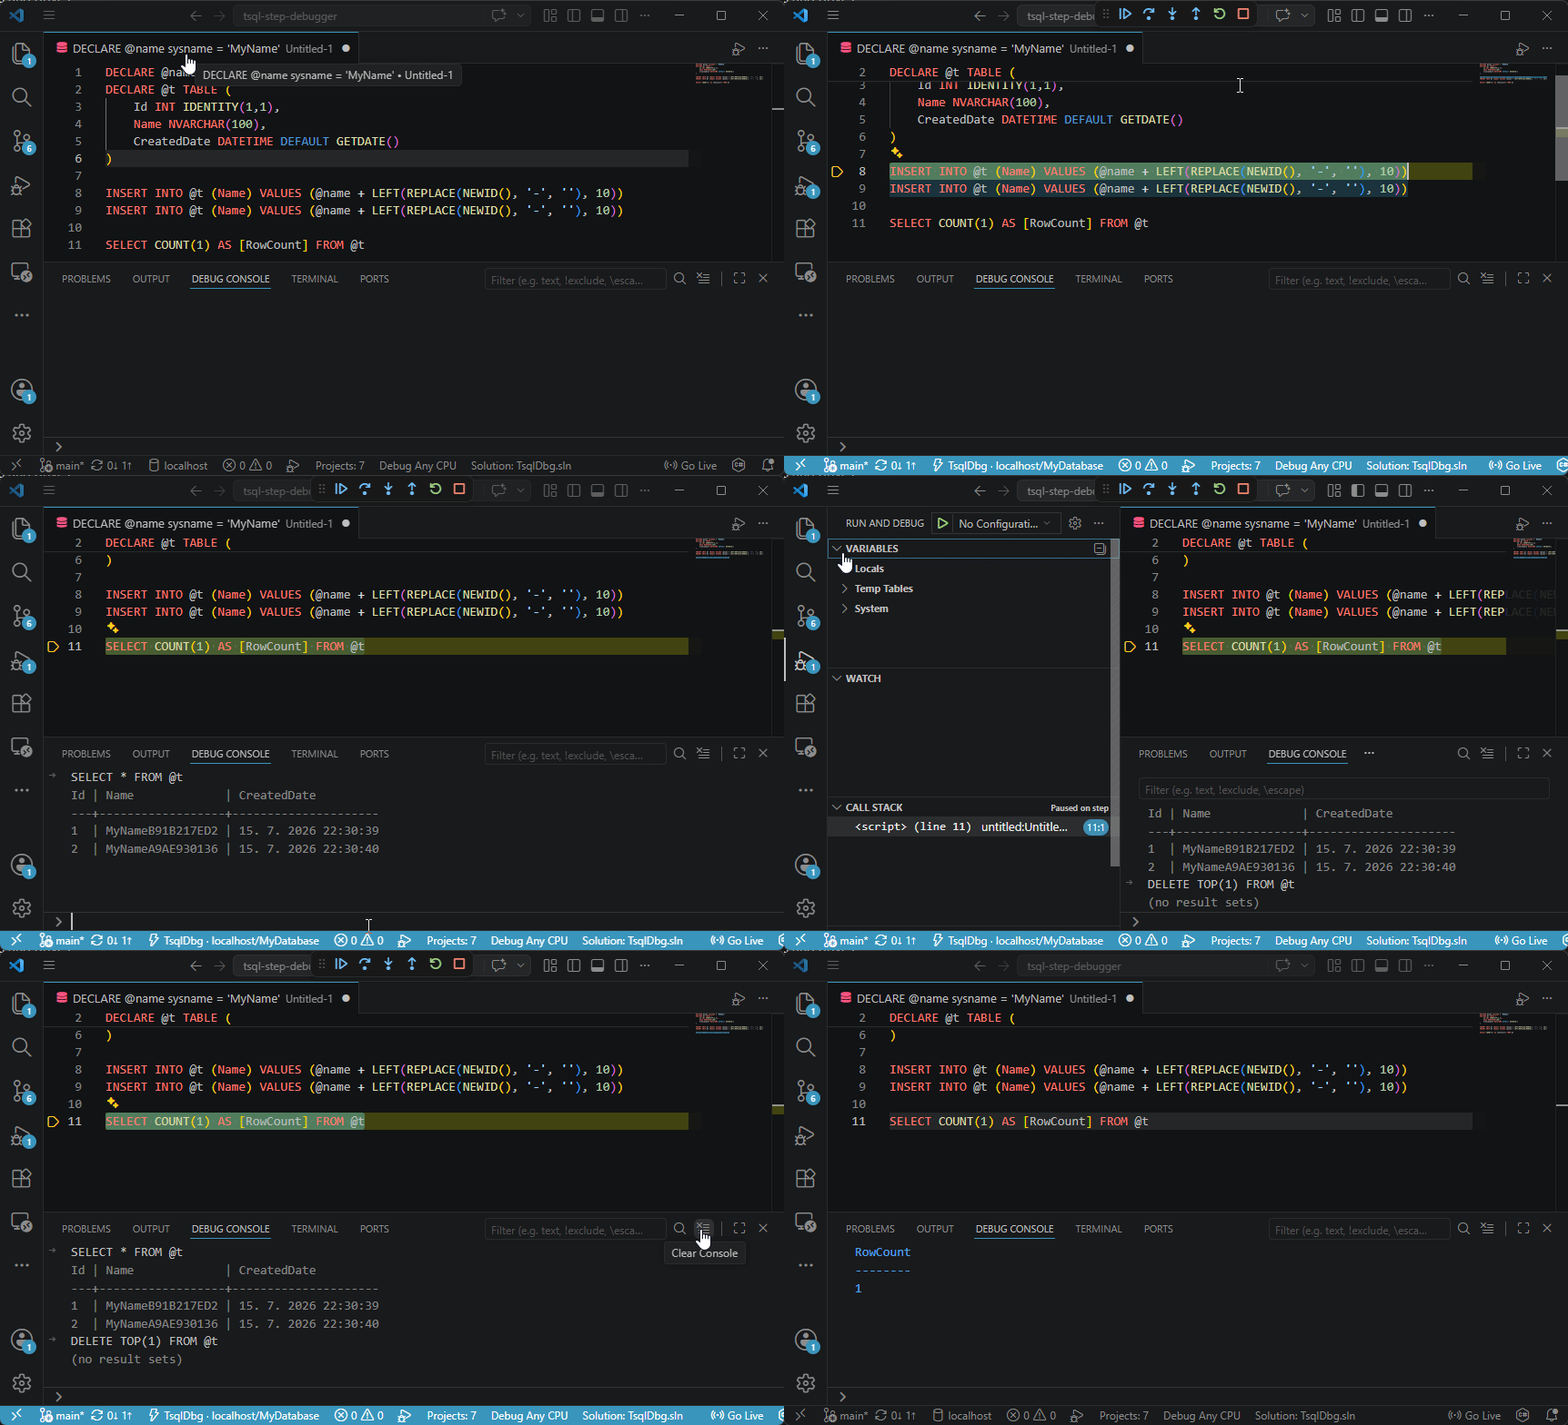
The file doesn't even have to be saved: open a fresh untitled buffer, type some T-SQL, and press F5 — the exact text on screen is debugged in place, nothing is written to disk. File → New File… → T-SQL File gives you such a buffer with SQL syntax highlighting, breakpoints, and the ▷ button already active. FeaturesStepping & inspection
Breakpoints & flow control
Connections & safety
Keyboard shortcuts
Reusing your mssql connectionsIf you already have Microsoft's SQL Server (mssql) extension installed with connections configured, you don't have to re-enter them:
Prefer the T-SQL Debugger's own Connection Manager? Set Safety
Debugging a scriptThe ▷ Debug T-SQL Script button and F5 both debug the active Full
|


| Option | Type | Default | Description |
|---|---|---|---|
mode |
script | procedure |
script |
Debug the active .sql file, or a deployed module. |
server / database |
string | (pick at launch) | Omit (recommended) to choose a saved connection (Connection Manager). |
script |
string | ${file} |
The .sql file to debug (script mode). For an unsaved buffer this is the editor URI, set automatically. |
scriptText |
string | — | Inline script body, run verbatim with no file read. Set automatically for unsaved/dirty buffers — you normally never write this by hand. |
procedure |
string | — | Two/three-part name; required for mode: procedure. |
args |
object | {} |
Parameter → T-SQL literal, e.g. { "@Id": "42" } (procedure mode). |
stopOnEntry * |
boolean | true |
Stop at the first statement before running. |
traceRun |
boolean | object | false |
Run to completion with no stops (breakpoints/stopOnEntry ignored), streaming a per-statement trace and writing a JSONL trace file. Options: { "stepMode": "over"\|"into", "captureTempRowCounts": false, "variableCapture": "changed"\|"full", "file": "path", "view": "panel"\|"console" }. view defaults to the T-SQL Trace panel in VS Code; "console" prints per-statement Debug Console lines instead. The Trace T-SQL Script button uses stepMode: "into". Rolls back unless commitMode: "commit" and the run completed (then the usual confirmation modal). |
commitMode |
rollback | commit |
rollback |
commit keeps changes after a confirmed Stop. |
authType |
integrated | sql |
integrated |
Windows (SSPI) or a SQL login. Best set in the Connection Manager. |
sqlUser |
string | — | SQL login name (when authType: sql). The password is never a config field — it lives in SecretStorage; set it in the Connection Manager. |
encrypt / options |
boolean / string | false / — |
encrypt = Encrypt=Mandatory; options appends a raw connection-string fragment. |
targetsFile |
string | (MSSQL_DEBUG_TARGETS, else ${workspaceFolder}/targets.json) |
Optional per-server metadata (env, connection options). |
boost * |
boolean | false |
Run whole IF/WHILE blocks as one batch under Continue (faster, less granular). |
waitfor * |
skip | honor |
skip |
skip logs WAITFOR DELAY/TIME instead of blocking. |
allowConsoleWrites |
boolean | true |
Let the Debug Console write (DML/DDL/SET @x), not just SELECT. |
sourceMap |
string[] | — | Globs binding a module's server definition to your real .sql files (breakpoints in called procs). |
executeAs |
string | — | EXECUTE AS <clause> at start, REVERTed at end. |
compatLevel |
0 | 150 | 160 | 170 |
0 |
ScriptDom parser version. 0 = auto-detect from the server (SQL 2019 → 150, 2022 → 160, 2025 → 170). |
logLevel * |
normal | verbose |
normal |
verbose also shows the debugger's own diagnostic notes (NOCOUNT, GO-batch, trigger heads-ups). |
commandTimeoutSec |
number | 300 |
Per-statement timeout. |
consoleTimeoutSec |
number | 30 |
Debug Console timeout. |
maxConsoleRows * |
number | 200 |
Debug Console row cap. |
tempTablePageSize * |
number | 50 |
Rows per page in Temp Tables. |
displayValueChars * |
number | 256 |
Max characters shown per value. |
watchBudgetMs * |
number | 2000 |
Per-stop budget for evaluating Watch expressions. |
trace |
boolean | false |
Write a full adapter log (for diagnosing the debugger itself). |
Extension settings (VS Code Settings, tsqlDbg.*):
| Setting | Default | Description |
|---|---|---|
tsqlDbg.defaults.* |
(unset) | Personal defaults for the launch options marked * above (stopOnEntry, waitfor, boost, maxConsoleRows, tempTablePageSize, displayValueChars, watchBudgetMs, logLevel). Applied when a launch config doesn't set the option; launch.json always wins. |
tsqlDbg.mssql.useActiveEditorConnection |
true |
Auto-use the active .sql file's mssql connection when set. |
tsqlDbg.mssql.useConnectionPicker |
true |
At launch, open mssql's own connection picker first. Set false to lead with the debugger's Connection Manager, with mssql as a secondary entry. |
tsqlDbg.adapterPath |
— | Dev override: absolute path to a locally-built TsqlDbg.Adapter. |
tsqlDbg.mcpPath |
— | Dev override: absolute path to a locally-built tsqldbg-mcp (MCP server). The bundled server is registered with VS Code agent mode automatically; this points that registration at a dev build. |
Use it from an AI agent (MCP server)
TsqlDbg.Mcp is a Model Context Protocol server that
exposes the same debugger to an AI agent — so an assistant like Claude Code can debug a
procedure by itself: trace it, set breakpoints, step, and inspect variables. It speaks MCP
over stdio; the agent's client launches it as a subprocess. Full spec: docs/DESIGN.md
§24.
Two ways an agent uses it
- Trace first (recommended).
trace_procedure/trace_scriptrun the target to completion, capture a per-statement JSONL trace (each statement, the variables after it, output, result sets, errors) to a file, and return a summary plus the path. One tool call answers most "why does this do X" questions — cheap, and the agent reads the file offline. - Interactive drill-down. When a trace is ambiguous:
start_session,set_breakpoints,continue/step,get_variables,evaluate— every call returns the current stop state (call stack, current error, transaction state), so the agent always knows where it is.
Safety model
Because there is no human present to consent, the programmatic surface is stricter than the VS Code one:
- Default-deny allowlist. Every session resolves the target against a
targets.jsonallowlist; an unknown server is refused before any connection opens (there is no informed-consent fallback). Point at it with theMSSQL_DEBUG_TARGETSenv var or--targets. - Rollback is the default, always. Every teardown — end, idle timeout, shutdown, error —
rolls back. Committing requires both
commitMode: "commit"and the target'sallowWrites: true; a cancelled or faulted trace never commits partial work. - Writes off by default.
allowConsoleWritesdefaultsfalsehere;evaluateonly reads unless a session opts in and the target allows writes. - Credentials never in a tool argument. A SQL-auth password is read only from the
TSQLDBG_SQL_PASSWORDenv var — never a tool argument (which would land in the transcript), never the trace file. Integrated (Windows) auth needs no password. - Idle sessions self-tear-down. A paused session holds locks; an idle timeout (default 300s) and a max-live-session cap (default 4) bound the exposure with no human watching.
A targets.json is just:
{ "targets": { "localhost": { "env": "dev", "allowWrites": false } } }
The tools
| Group | Tools |
|---|---|
| Lifecycle | start_session, end_session, list_sessions, get_state, get_stack |
| Stepping | step (over/in/out), continue, goto |
| Breakpoints | set_breakpoints (line + optional condition/hit-count), clear_breakpoints, set_exception_filters |
| Inspection | get_variables (locals/system/temp/errorContext), get_temp_rows, evaluate, set_variable |
| Trace | trace_procedure, trace_script |
Build and run
# from the repo root — build, or publish a self-contained exe
dotnet build src/TsqlDbg.Mcp/TsqlDbg.Mcp.csproj
dotnet publish src/TsqlDbg.Mcp -c Release -r win-x64 --self-contained   # → tsqldbg-mcp(.exe)
Server-level options (env or process args): MSSQL_DEBUG_TARGETS (or --targets <path>),
--max-sessions <n> (default 4), --idle-timeout-sec <n> (default 300), --trace-dir <path>
(where trace files go), --trace <path> (the host's own protocol log).
Connecting an MCP client
Pick whichever fits how you got the tool. A is zero-config; B needs no .NET install.
A. VS Code agent mode — automatic (nothing to configure)
If you have the T-SQL Step Debugger VS Code extension installed (VS Code 1.101+), the
bundled MCP server is registered with VS Code's agent mode for you — it appears in the MCP
server list (and to Copilot / any MCP client in that window) with no mcp.json to write. Put a
targets.json at your workspace root and the extension points the server at it automatically;
otherwise set MSSQL_DEBUG_TARGETS in your environment. That's it.
B. Any MCP client — self-contained binary (no .NET runtime needed)
Download the tsqldbg-mcp-<platform> archive from the GitHub release,
unpack it, and point your client's command straight at the tsqldbg-mcp executable. For
Claude Code:
claude mcp add tsql-debugger --env 'MSSQL_DEBUG_TARGETS=C:/path/to/targets.json' -- \
  'C:/path/to/tsqldbg-mcp.exe'
…or the equivalent client config block (~/.claude.json, mcp.json, Claude Desktop, etc.):
{
  "mcpServers": {
    "tsql-debugger": {
      "command": "C:\\path\\to\\tsqldbg-mcp.exe",
      "args": [],
      "env": { "MSSQL_DEBUG_TARGETS": "C:\\path\\to\\targets.json" }
    }
  }
}
C. From a source build — via dotnet
If you built it yourself (dotnet build, framework-dependent), launch the DLL with dotnet:
{
  "mcpServers": {
    "tsql-debugger": {
      "command": "dotnet",
      "args": ["C:\\path\\to\\tsqldbg-mcp.dll"],
      "env": { "MSSQL_DEBUG_TARGETS": "C:\\path\\to\\targets.json" }
    }
  }
}
Windows paths in a bash-like shell: quote them — unquoted, bash eats the backslashes (
C:\path\to\…arrives asC:pathto…). Forward slashes work too (C:/path/to/targets.jsonis accepted everywhere a path is), which sidesteps quoting entirely.
For SQL-auth targets, also set TSQLDBG_SQL_PASSWORD in env (never as a tool argument).
Building from source
Prerequisites: .NET 8 SDK; Node 18+ (for the extension); a reachable SQL Server for the integration tests.
# Build everything
dotnet build TsqlDbg.sln

# Unit tests (no database needed)
dotnet test tests/TsqlDbg.Core.Tests
dotnet test tests/TsqlDbg.Adapter.Tests
dotnet test tests/TsqlDbg.Mcp.Tests

# Integration + fidelity harness (needs a SQL Server; skips cleanly if unset)
TSQLDBG_TEST_CONN="Server=localhost;Database=TsqlDbgScratch;Integrated Security=true;TrustServerCertificate=true" \
  dotnet test tests/TsqlDbg.Integration

# Publish the self-contained hosts (Windows x64)
dotnet publish src/TsqlDbg.Adapter -c Release -r win-x64 --self-contained
dotnet publish src/TsqlDbg.Mcp     -c Release -r win-x64 --self-contained

# Build the VS Code extension
cd extension && npm ci && npm run build

# Package the platform-specific VSIX
npx @vscode/vsce package --target win32-x64
Project layout
tsql-step-debugger/
├── extension/                # VS Code extension shell (TypeScript, esbuild) — DAP client
├── src/
│   ├── TsqlDbg.Core/         # interpreter, rewriter, state, error model — NO DAP/VS Code deps
│   ├── TsqlDbg.Adapter/      # DAP host (stdio) — the interactive surface (VS Code)
│   └── TsqlDbg.Mcp/          # MCP host (stdio) — the programmatic surface (AI agents)
├── tests/
│   ├── TsqlDbg.Core.Tests/       # unit: rewriter, interpreter (fake IStatementExecutor)
│   ├── TsqlDbg.Adapter.Tests/    # unit: DAP host
│   ├── TsqlDbg.Mcp.Tests/        # unit: MCP host + driver tests
│   └── TsqlDbg.Integration/      # integration + fidelity harness (needs a live SQL Server)
└── docs/                     # DESIGN.md (the spec), README.md (developer reference), engine-facts.md
TsqlDbg.Core holds all the debugging logic and has no DAP or VS Code dependency; the
adapter and the MCP server are two thin hosts over it (see docs/DESIGN.md
§3 and §24).
Requirements
- VS Code extension: VS Code 1.101+ on Windows (x64) — the adapter is bundled, so no .NET runtime needed — and a reachable SQL Server 2016+ dev/test instance.
- MCP server / building from source: .NET 8 runtime (or SDK to build); any OS the .NET runtime supports.
- Debugging needs only ordinary
EXECUTE/SELECT+VIEW DEFINITION— nosysadmin.
Support & feedback
Found a bug or have a feature request? Please open an issue on GitHub. This extension is in preview — feedback is very welcome.
Telemetry
This extension collects no telemetry and sends no data anywhere. It talks only to the SQL Server you point it at.
License
MIT © ibaxo.