Claude Code Agent MonitorProfessional integrated dashboard for monitoring Claude Code AI agent activity, token usage, and costs directly in VS Code. Installation Launch VS Code Quick Open ( Ctrl+P), paste the following command, and press enter.Copied to clipboard |

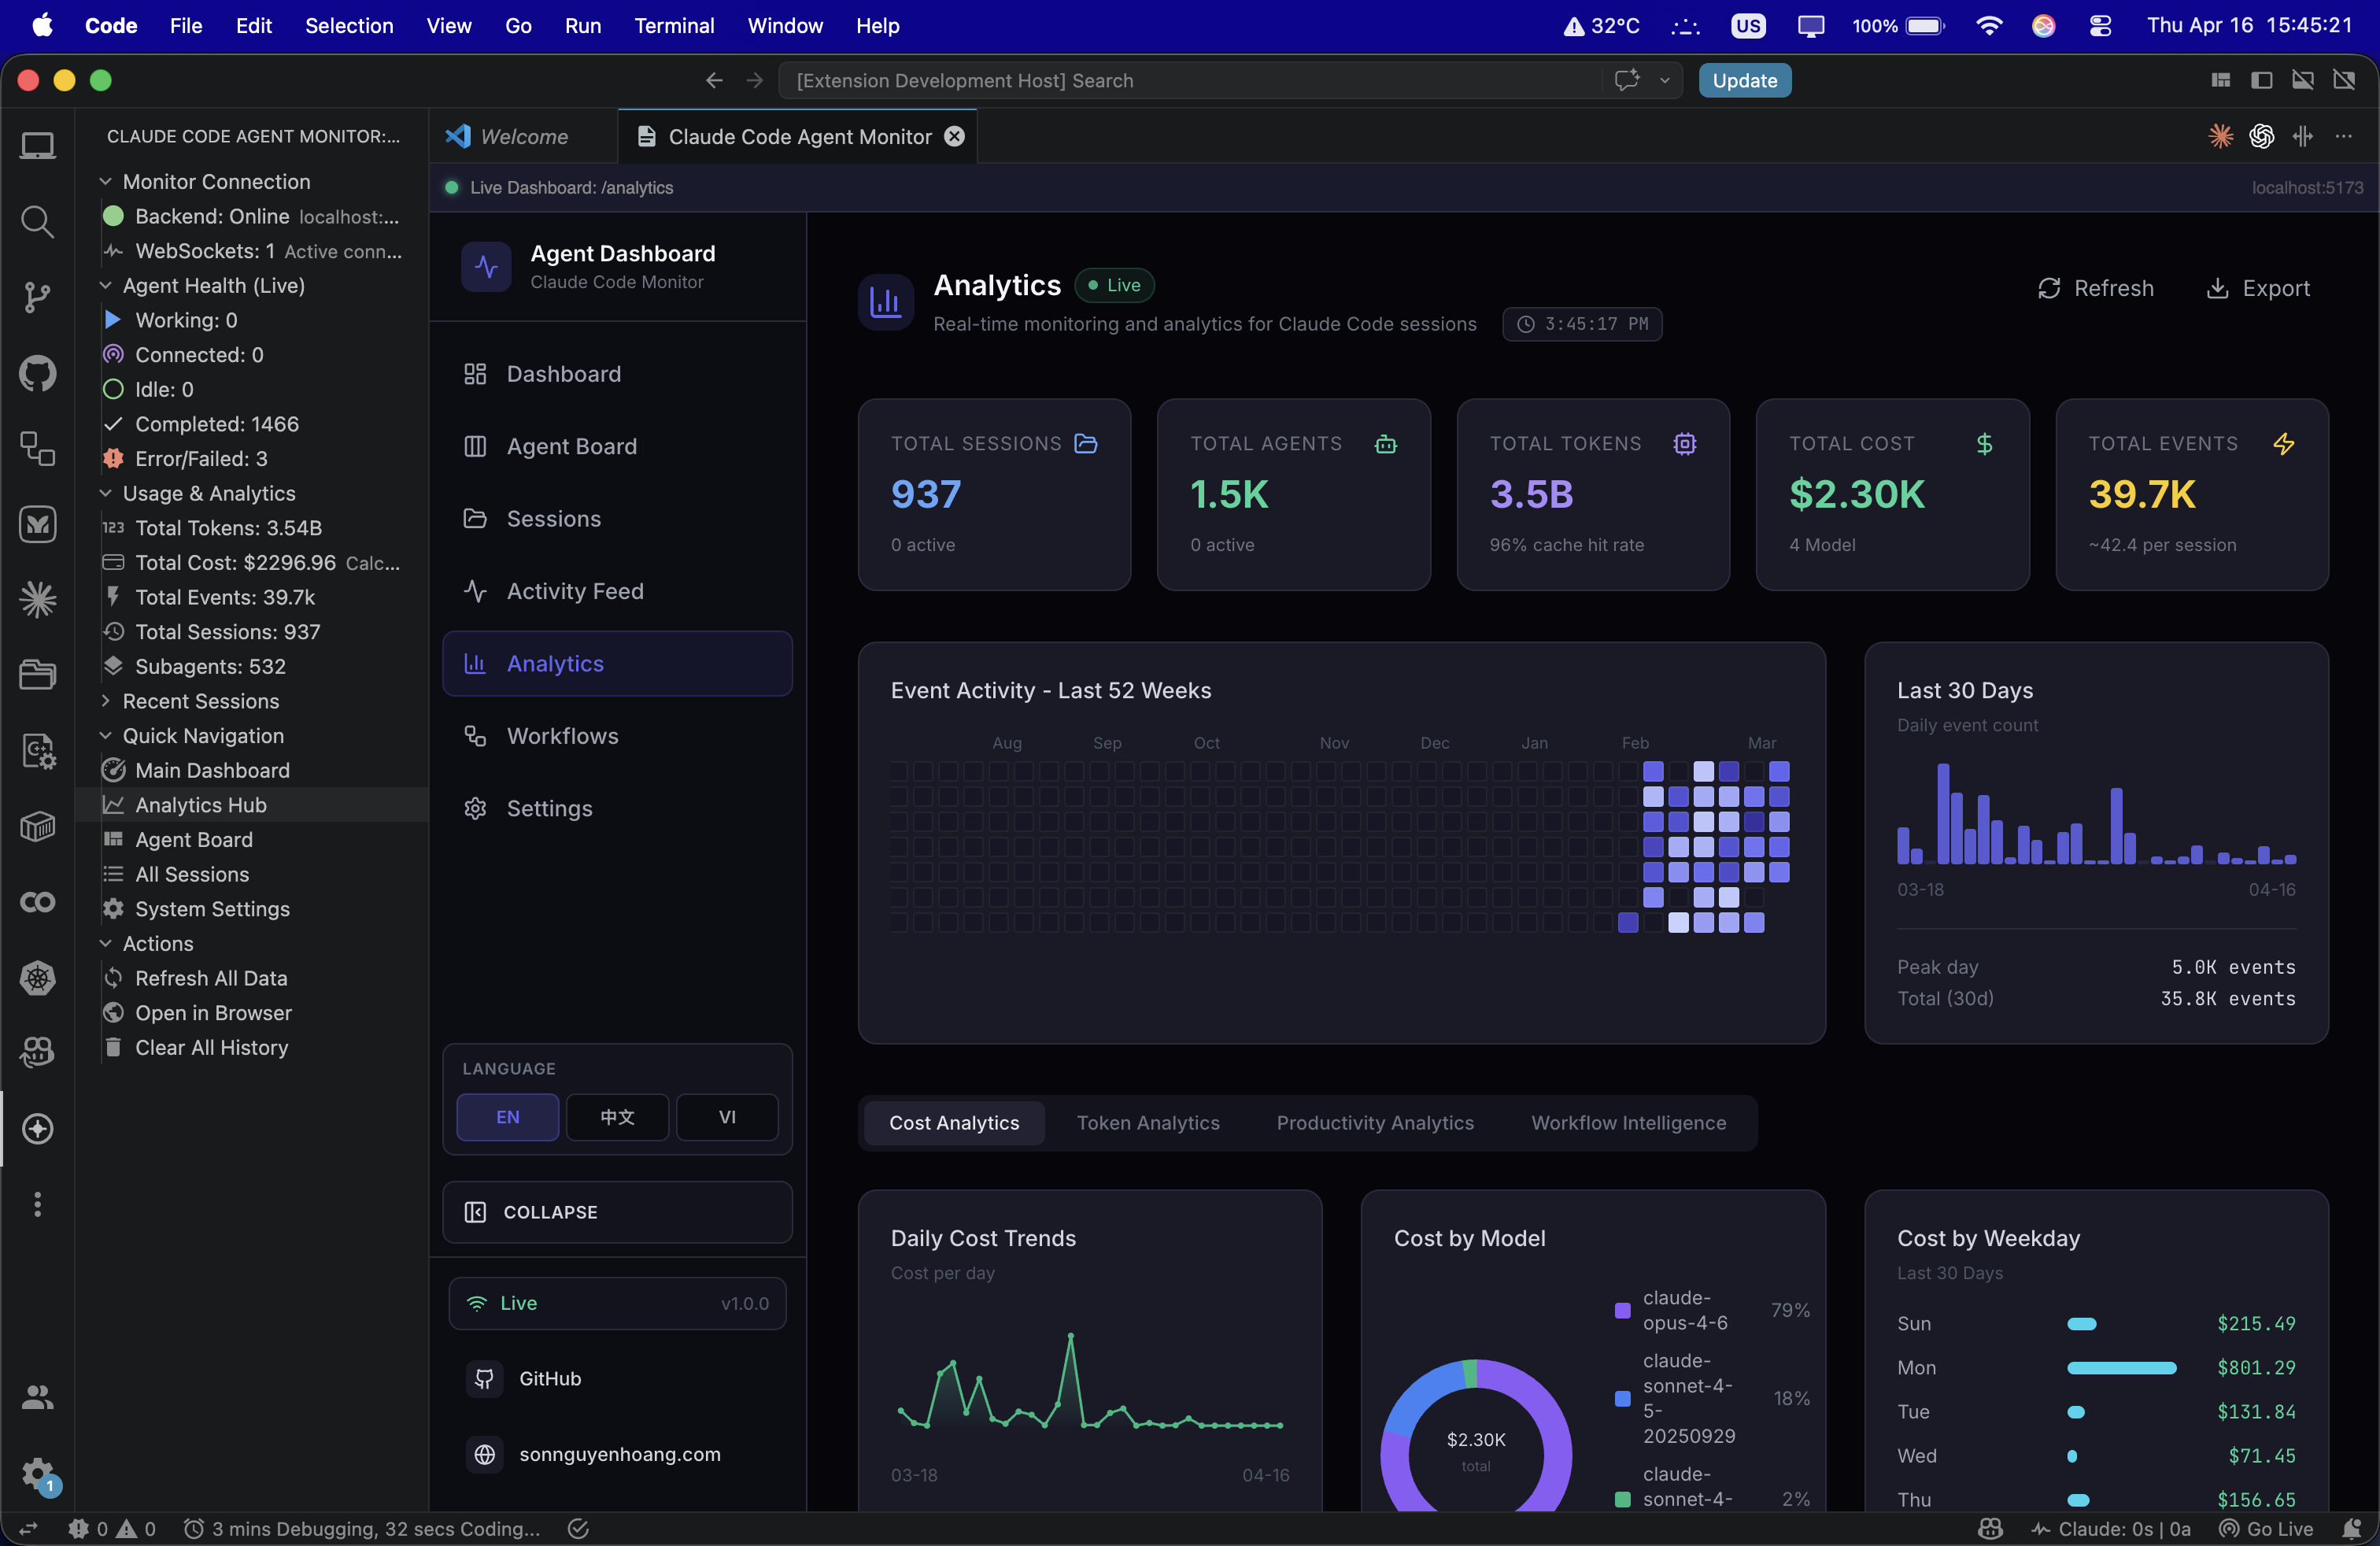
Claude Code Agent Monitor for VS CodeClaude Code Agent Monitor brings a high-fidelity, real-time dashboard for your Claude Code AI sessions directly into your VS Code workspace. Monitor token usage, track agent health, and view deep analytics without switching windows.
🚀 Key Features📊 Integrated DashboardOpen the full agent monitoring dashboard in a dedicated VS Code tab. Supports real-time updates via WebSockets and local-first data storage. 🩺 Live Agent HealthTrack all 5 agent states in your sidebar with color-coded status indicators:
📈 Usage & Analytics
🧭 Deep NavigationJump directly to specific views from the sidebar:
🛠️ Getting Started1. RequirementsEnsure you have the Claude Code Agent Monitor server running locally: 2. Installation
3. Usage
📦 Publishing & DevelopmentTo generate a
📜 LicenseThis extension is licensed under the MIT License. Developed with ❤️ for the AI Engineer community. |