Claude Code Usage
🌐 多語言文檔 | Multi-language Documentation | 多语言文档 | 多言語ドキュメント | 다국어 문서
A comprehensive VSCode extension that monitors Claude Code usage and costs with detailed analytics and interactive visualizations.
🖼️ Screenshot
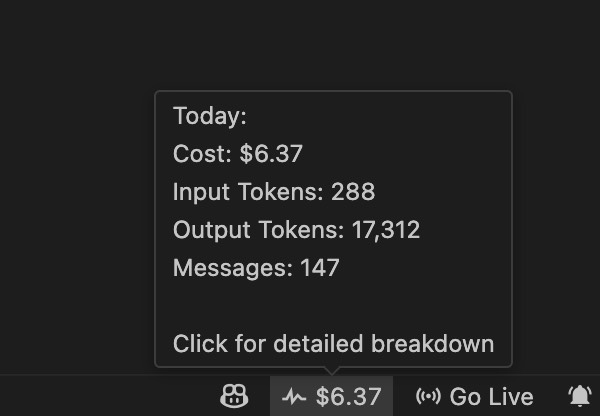
Status Bar

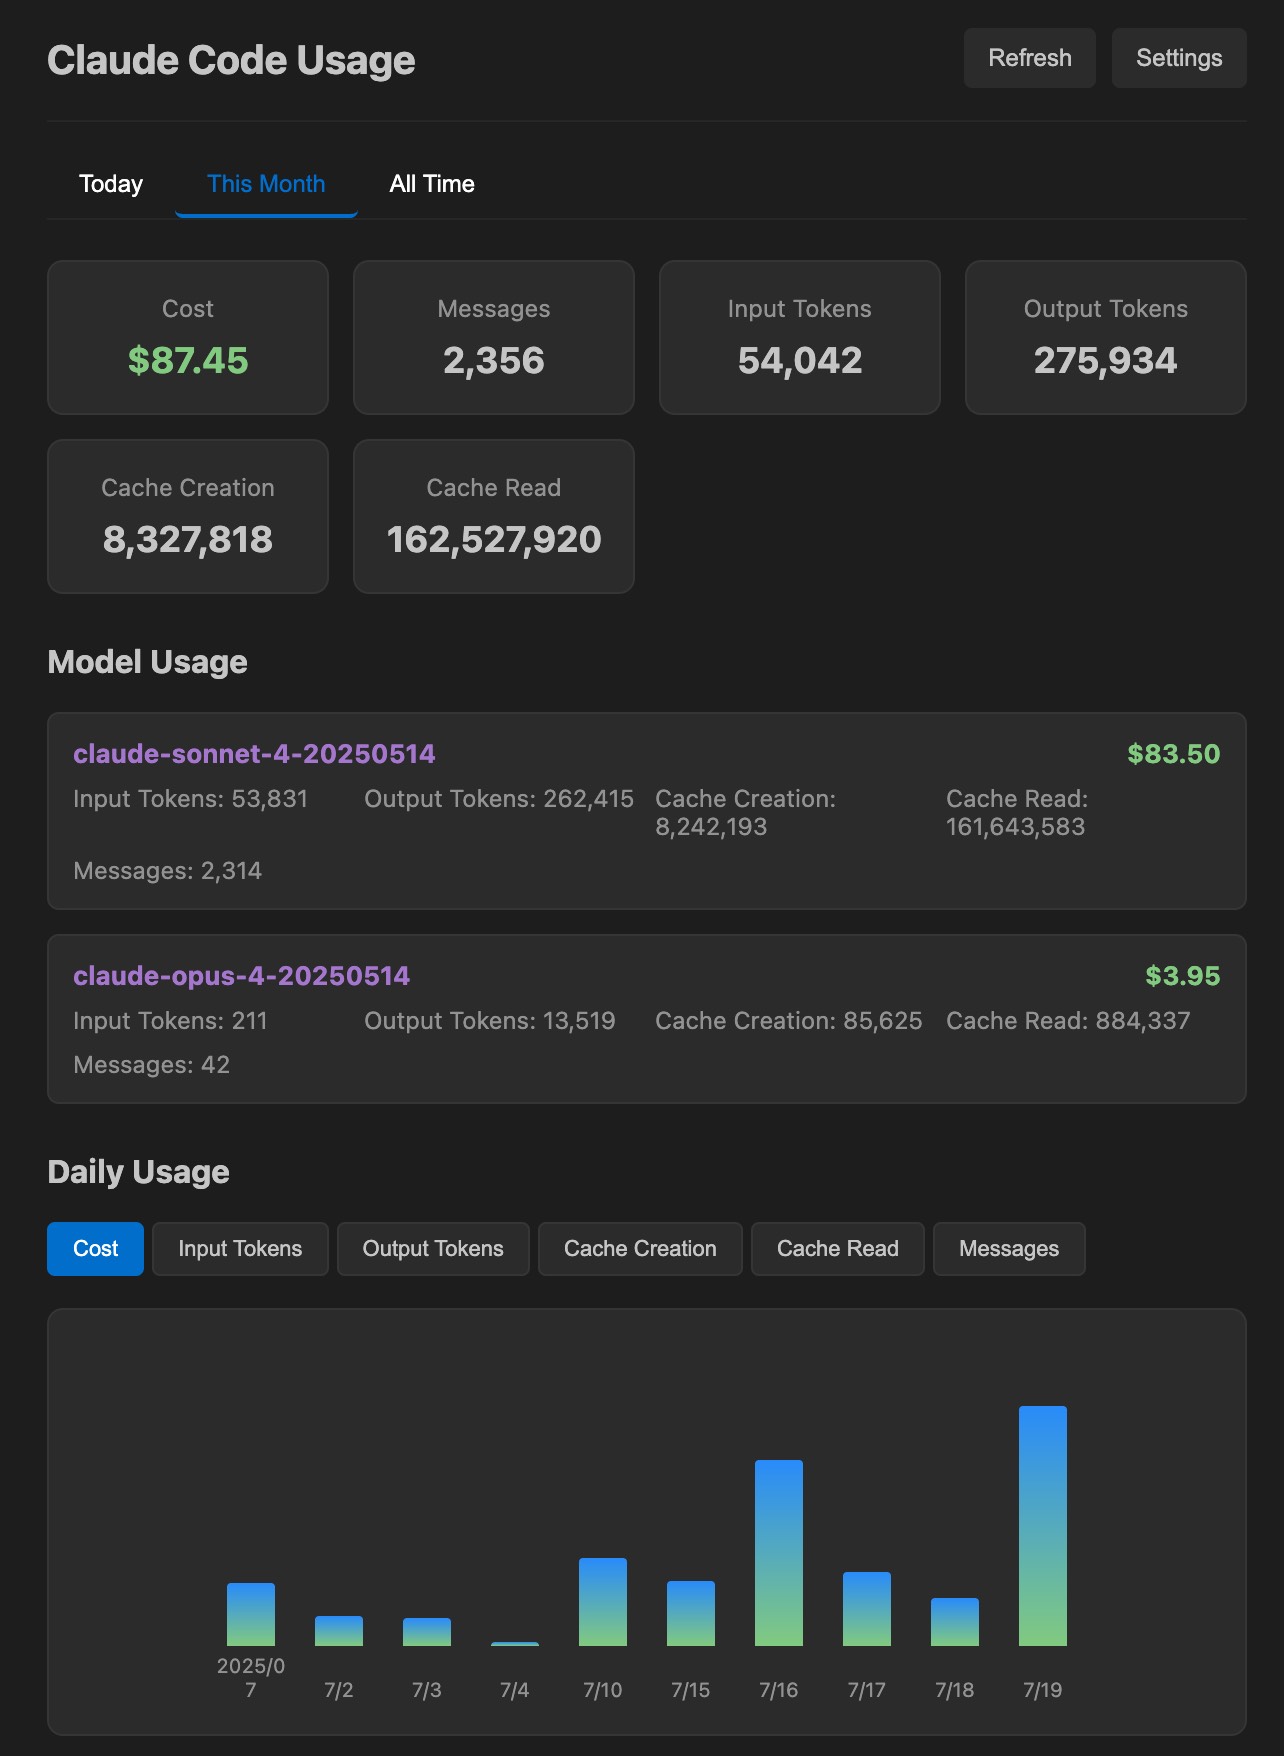
Dashboard

✨ Features
📊 Real-time Monitoring
- Status Bar Display: Shows today's usage costs in the VSCode status bar
- Live Updates: Automatic data refresh with configurable intervals (minimum 30 seconds)
- Zero Dependencies: Built with native Node.js modules for maximum compatibility
📈 Interactive Analytics Dashboard
- Multiple Time Views: Today, This Month, and All Time perspectives
- Interactive Charts: Switchable bar charts with 6 different metrics:
- Cost breakdown
- Input/Output tokens
- Cache creation/read tokens
- Message counts
- Hourly Breakdown: Detailed hourly usage analysis for today and specific dates
- Expandable Monthly Data: Click on any month in "All Time" to view daily breakdown
- Detailed Tables: Comprehensive daily/monthly usage breakdowns with drill-down capabilities
- Model Analysis: Per-model cost and token consumption tracking

🌐 Multi-language Support
- 5 Languages: English, 繁體中文, 简体中文, 日本語, 한국어
- Auto-detection: Automatically detects system language
- Manual Override: Choose your preferred language in settings
🎨 Visual Features
- Bottom-up Charts: Industry-standard chart orientation
- Monthly Trends: All-time view shows monthly aggregated data for long-term analysis
- VSCode Theme Integration: Seamless light/dark theme support
- Responsive Design: Optimized for different screen sizes
📥 Download
VSCode Marketplace

Open VSX Registry (for Cursor / Windsurf / Antigravity)

Installation
- Install the extension from the VSCode marketplace
- The extension will automatically detect your Claude Code data directory
- Start using Claude Code and see your usage appear in the status bar
Configuration
Access settings via File > Preferences > Settings and search for "Claude Code Usage":
- Refresh Interval: How often to update usage data (minimum 30 seconds)
- Data Directory: Custom Claude data directory path (leave empty for auto-detection)
- Language: Display language preference
- Decimal Places: Number of decimal places for cost display
🚀 Usage
Status Bar
- Shows today's usage cost with a pulse icon
- Click to open the detailed analytics dashboard
Analytics Dashboard
- Time Tabs: Switch between Today, This Month, and All Time views
- Chart Metrics: Click tabs above charts to switch between:
- Cost breakdown
- Input/Output tokens
- Cache creation/read tokens
- Message counts
- Hourly Analysis: View hourly usage patterns in "Today" tab
- Expandable Data:
- Click on daily entries in "This Month" to see hourly breakdown
- Click on monthly entries in "All Time" to see daily breakdown
- Interactive Tables: Detailed daily/monthly breakdowns below charts
- Model Analysis: Per-model usage statistics in each tab

📋 Requirements
- Claude Code: Must be installed and running
- VSCode: Version 1.74.0 or later
- Node.js: Built-in modules only (no external dependencies)
🛠️ Troubleshooting
"No Claude Code Data" Error
- Ensure Claude Code is installed and has been used
- Check the data directory setting in extension preferences
- Verify Claude Code is generating usage logs in
~/.claude/projects or ~/.config/claude/projects
Charts Not Updating
- Switch to a different tab and back to refresh the chart
- Check if the time period has actual usage data
- Verify cache tokens are available in your Claude usage
- Increase refresh interval if experiencing slowdowns
- Extension uses 1-minute caching to minimize file I/O
License
MIT
📝 Changelog
v1.0.8 (2025-11-28)
- 📝 Converted all code comments from Traditional Chinese to English
- 🌍 Improved code internationalization standards
- 🔧 Enhanced code readability and maintainability
v1.0.7 (2025-11-28)
- 🌐 Added multilingual translation support for hourly usage labels
- 🔧 Removed hardcoded Chinese text from code, replaced with i18n translation system
- ✨ Ensured multilingual consistency across user interface (English, Traditional Chinese, Simplified Chinese, Japanese, Korean)
v1.0.6 (2025-08-10)
- 🆕 Added support for Claude Opus 4.1 model pricing
- 🔄 Updated pricing data to include
claude-opus-4-1-20250805 and claude-opus-4-1 model IDs
- 📊 Pricing remains the same as Opus 4 ($15/1M input, $75/1M output tokens)
v1.0.5 (2025-01)
- ⏰ Added hourly usage statistics and visualization
- 📈 Enhanced dashboard with hourly breakdown functionality
- 🔧 Improved data processing for hourly aggregation
v1.0.4 (2025-01)
- 📊 Added all-time data calculation functionality
- 🎨 Updated UI to display all-time usage data with charts and labels
- 🔄 Fixed data update logic to support new data structure
- 🌐 Added "All Time" translations to multi-language support
v1.0.3 (2025-01)
- 🔗 Updated GitHub repository URL
- 🖼️ Fixed README image links to point to new repository location
- 📦 Version bump and repository migration
v1.0.0 (2025-01)
- 🎉 Initial complete release
- 📊 Real-time Claude Code usage monitoring in status bar
- 🌐 Multi-language support (English, 繁體中文, 简体中文, 日本語, 한국어)
- 📈 Interactive analytics dashboard with charts and tables
- 🎨 VSCode theme integration and responsive design
- ⚙️ Configurable refresh intervals and settings
Contributing
Issues and pull requests are welcome on the GitHub repository.
| |


