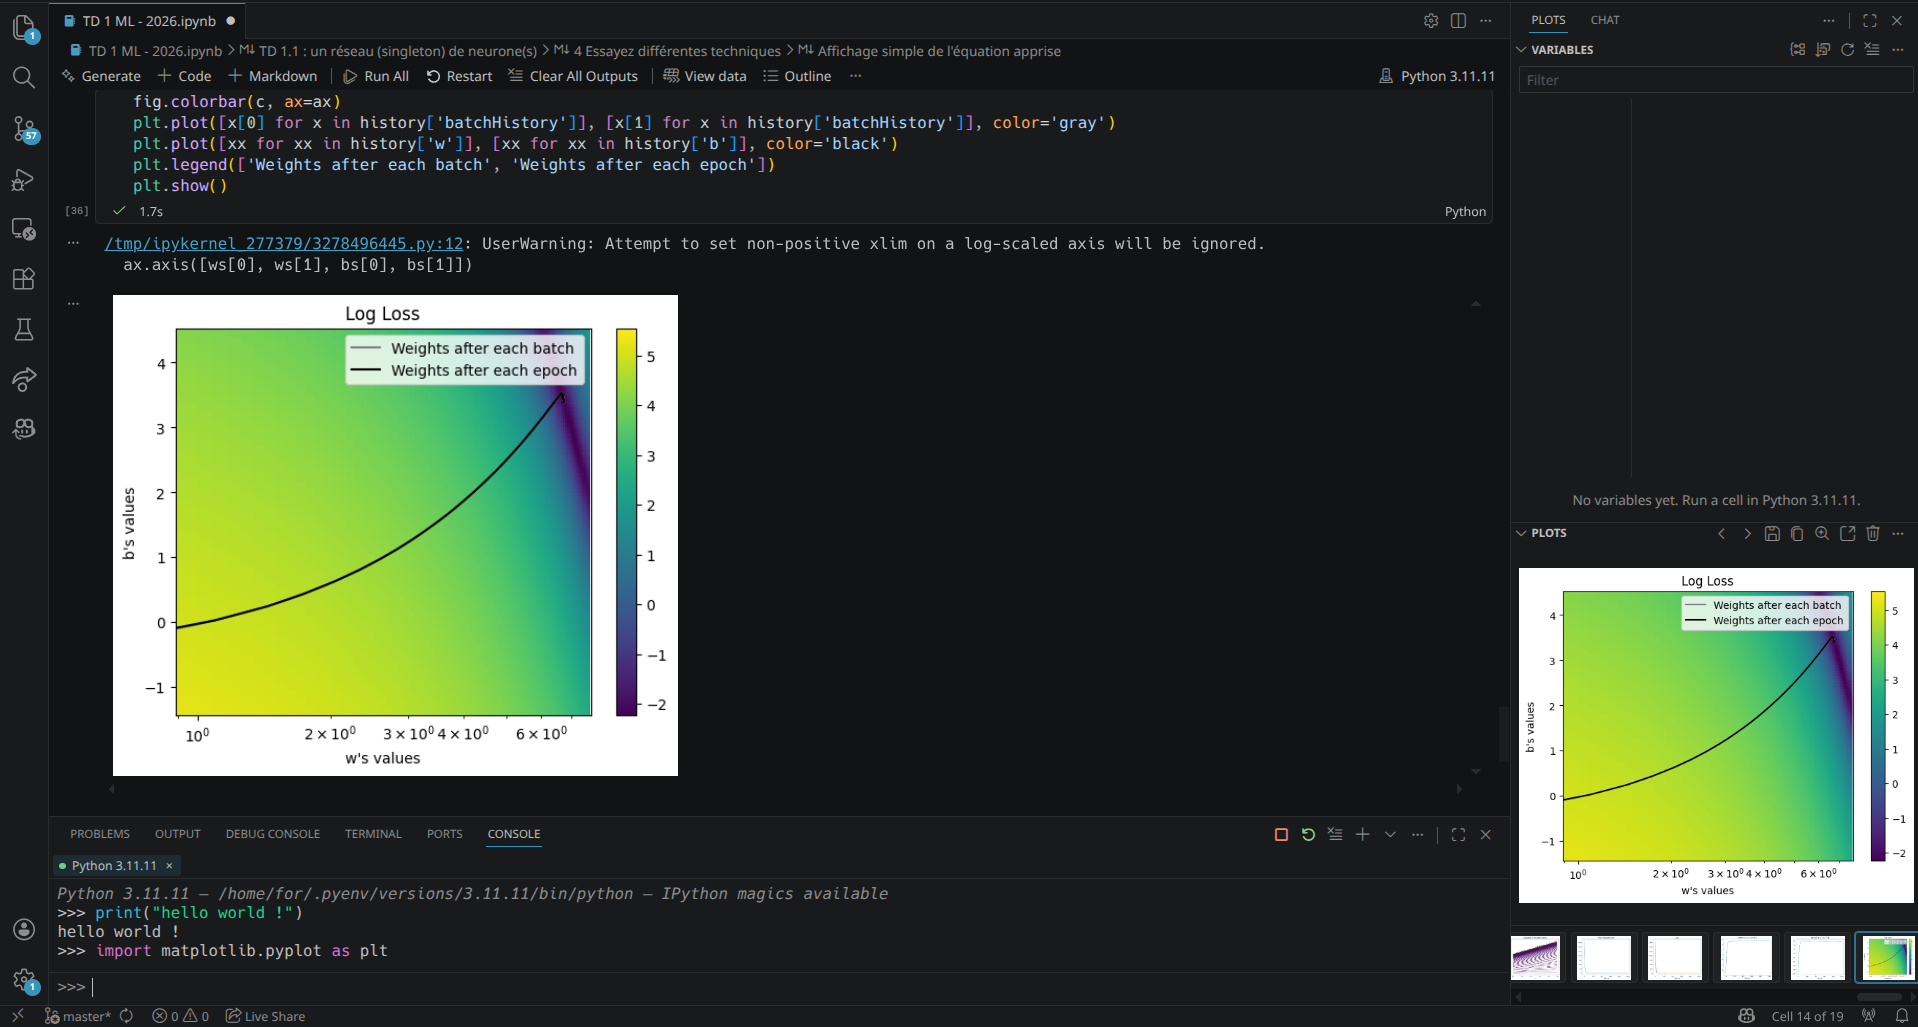
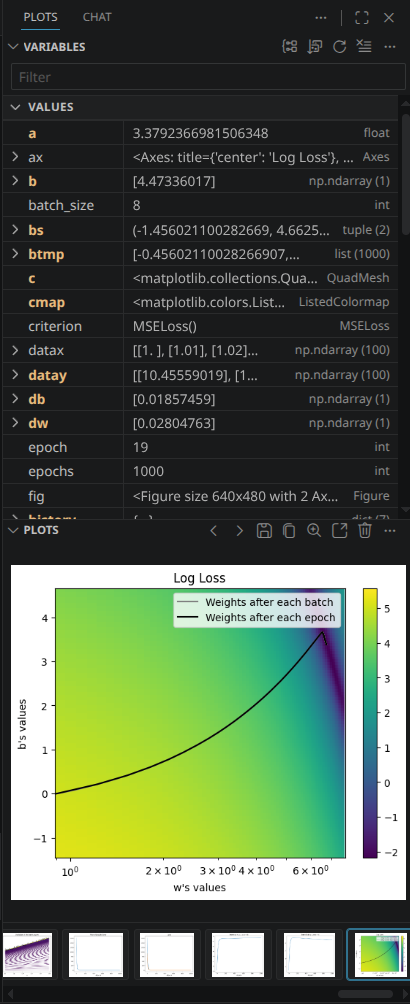
Plot PanelA plots pane, a variables explorer and an interactive console for VS Code, so notebook work feels less like scrolling through a log. If you use notebooks for data work, you know the pattern: you plot something, run three more cells, and now the figure you wanted is somewhere above, between two stack traces. Plot Panel keeps every figure your kernel produces in one pane, shows your variables in another, and gives you a real Python or R prompt at the bottom of the window.
The plots paneFigures land there by themselves, from notebooks and from the Interactive Window. The current one is shown large, the whole session sits underneath as thumbnails, and the strip marks where each run started so you can find the figures from a given run without counting. The history survives a restart, and each project keeps its own. Open another repository and you get a clean strip; come back and your figures are still there.
The title bar carries the usual things: previous and next, save, copy, zoom presets, and a menu to open a plot in an editor tab or a floating window. There is a dark filter for figures that are too bright against a dark theme, and a Plot Code menu that copies the code behind a figure, jumps to the cell that made it, or runs it again. The variables viewAfter a cell finishes, the view lists what the kernel holds. Two columns, name and value, with a small type on the right. The line between them is a real divider you can drag, and it sizes itself to your longest variable name to start with. Rows open. A DataFrame opens into its columns, a column into its values, a list
into its items, a dict into its keys. Values are shown the way you would want to
read them: a frame as You can group by kind or by size, sort by name, size or recency, and filter by name. Variables that changed during the last run are marked, so a long Run All does not leave you comparing lists by eye. The console
A Python prompt in the bottom panel, next to the terminal. Enter runs, Shift and
Enter add a line, Tab indents, and the arrows walk back through what you typed.
Completions come from the session itself, so
If IPython is available, magics work, including Running something in a console makes the variables view follow it, and clicking back into a notebook hands the view back. RequirementsThe Jupyter extension, for notebooks and their kernels. The Python extension is
optional and used to find your interpreters. R sessions need Nothing is bundled: the extension has no runtime dependencies, makes no network requests, and collects nothing. Getting the side-by-side layoutThe two views ship in one container, Variables above Plots. VS Code has no API
to place a container in the secondary sidebar, so it takes one drag by hand:
open the secondary sidebar ( What it cannot doWorth knowing before you rely on it. The console runs its own interpreter, so it does not see the variables in your notebook's kernel. Running code inside a notebook kernel and reading the result back is reserved by the Jupyter extension to a short list of publishers. That restriction is also why expansion in a notebook is limited: the view only gets truncated text descriptions, which stop nesting after two levels and cut every nested item at 128 characters. A DataFrame inside a list shows its shape but usually will not open further. A console session has no such ceiling, because the process belongs to the extension. For the same reason, functions and classes in a notebook are read from the source of the cells you ran rather than from live objects, so what you see is their signature. Imported classes do not show up at all. A console lists them properly. Figures drawn by plotly, bokeh or ipywidgets never reach the notebook as an image, so there is nothing to capture and the pane says so instead of going quiet. Identical figures are stored once: re-running code that produces exactly the same image selects the existing entry rather than adding a copy. Variables cannot appear while a cell is still running. The introspection that lists them runs on the kernel, so it waits its turn behind your code. Settings
With If your figures come out with a dark background, that is
CommandsEverything is on the title bars, and all of it is in the command palette under
TrademarksAn independent project, not affiliated with, endorsed by or sponsored by Posit Software, PBC or Microsoft. Positron and RStudio are trademarks of Posit Software, PBC, named here only to describe the layout this extension reproduces. No Positron source code was consulted or used: the implementation is original, and the behaviour it matches was derived from public behaviour and from the VS Code and Jupyter extension APIs. |