Skip to content
| Marketplace
Sign in
Visual Studio Code>Other>dapvizNew to Visual Studio Code? Get it now.
dapviz

dapviz

FH Salzburg Creative Technologies

|
1 install
| (0) | Free
Visualizes running programs
Installation
Launch VS Code Quick Open (Ctrl+P), paste the following command, and press enter.
Copied to clipboard
More Info

dapviz

Screenshot of dapviz debugging a program, visualizing a graph of objects in memory

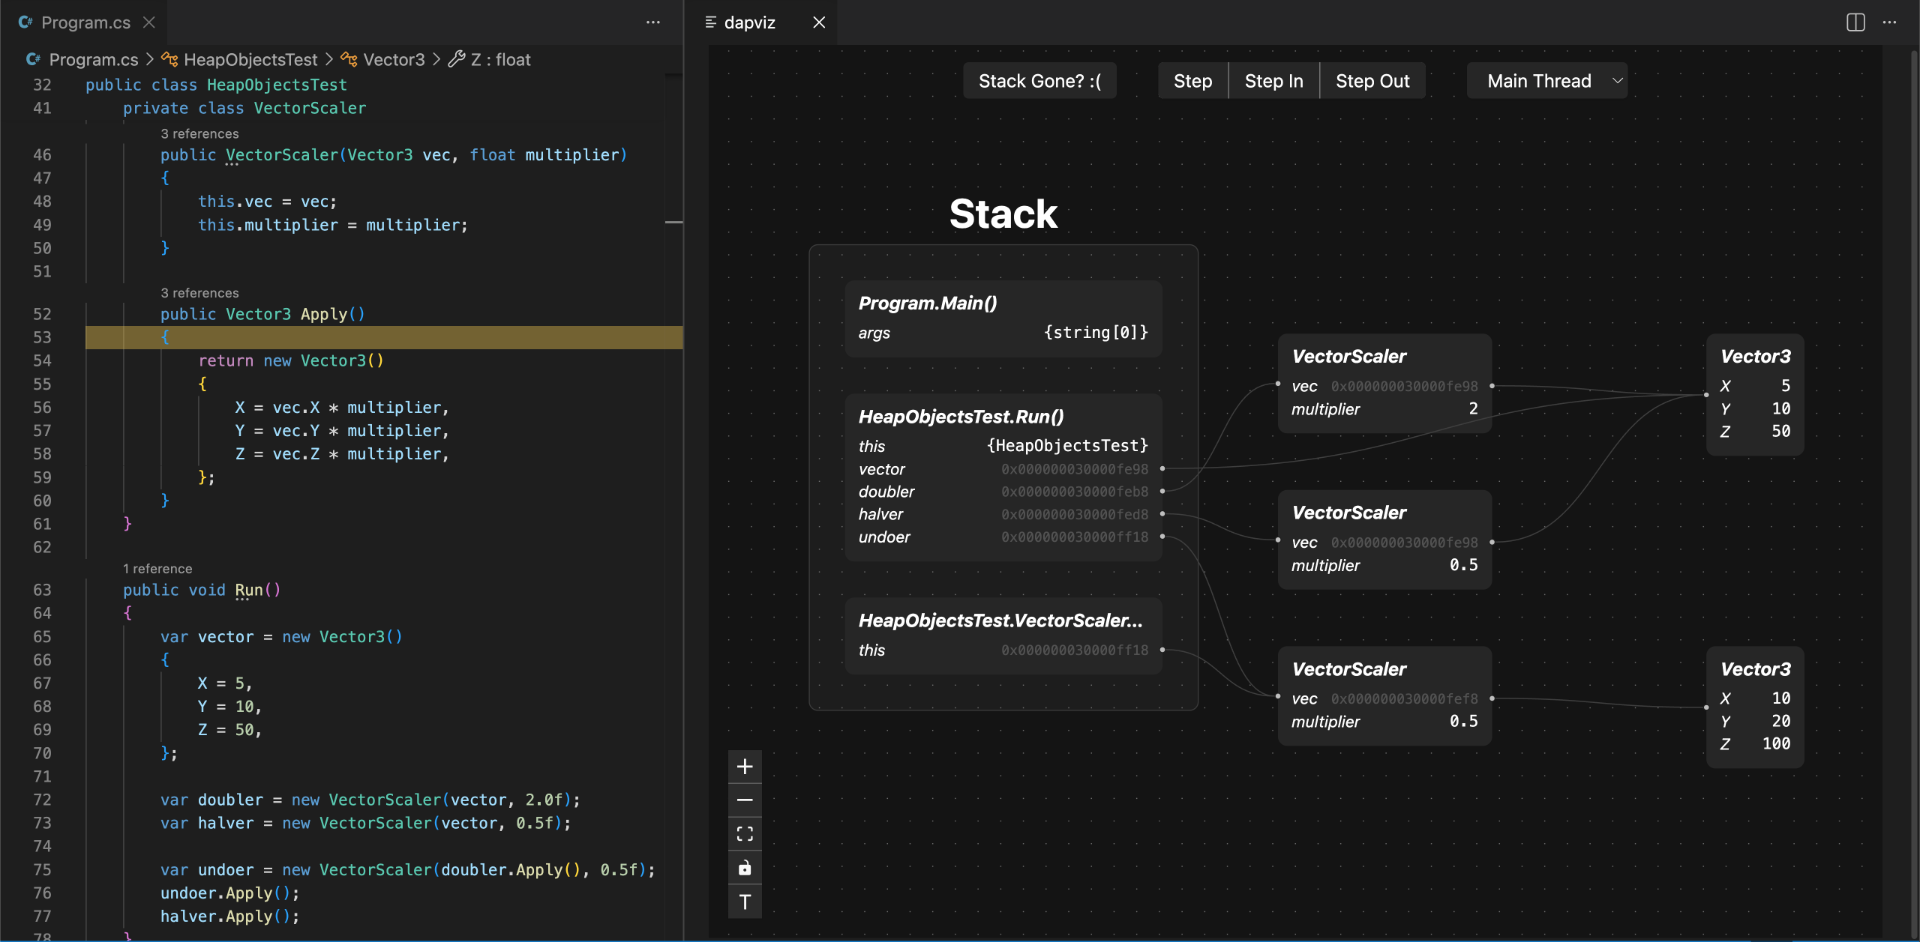
dapviz is a debugger that visualizes a running program’s memory as a graph, showing how stack variables and heap objects are laid out and connected.

It is designed as a learning tool to help beginner programmers understand the concepts of reference and value types.

Usage

Install Debug Adapter

Run command dapviz: Install a debug adapter.

Select the adapter for the language you want to debug: Currently supported languages:

  • C# -> netcoredbg

Run a Program

  1. Run command dapviz: Start session.
  2. Select the debug adapter backend.
  3. Choose the program to debug.

[!IMPORTANT]
For C# programs, choose the *.dll file, not the *.exe file.

Update dapviz

Run command dapviz: Install/Update dapviz backend.

Requirements

  • Windows 10 or newer
  • Apple Silicon Macs (M1 or newer)

Currently Linux is not supported.

  • Contact us
  • Jobs
  • Privacy
  • Manage cookies
  • Terms of use
  • Trademarks
© 2026 Microsoft