Killer Bug AI Debugger
Let your AI assistant debug your code automatically for accurate runtime context
An MCP-powered debugging extension that gives VS Code Copilot, Cursor AI, Claude Desktop, ChatGPT, and other AI assistants complete control over VS Code's debugger. AI can now set breakpoints, step through code, inspect variables, and find bugs—all without you touching the keyboard.
🎬 See It In Action
⚡ Quick Start
Install the extension from VS Code marketplace
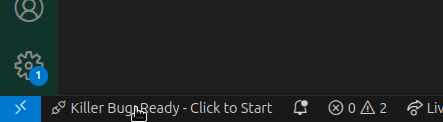
Start the Debugger (for each project):
- Click the "Killer Bug: Ready (Click to Start)" button in the status bar (bottom left)
- Or press
Ctrl+Shift+P (or Cmd+Shift+P on Mac) and run: Killer Bug: Start AI Debugger
Configure (first time only):
- The extension auto-detects your IDE (VS Code or Cursor)
- Choose the port for the MCP server (usually 3100)
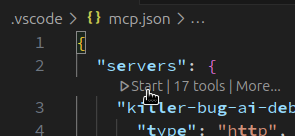
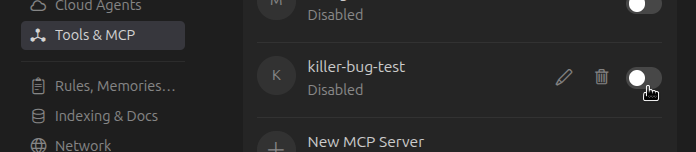
Connect your AI:
- VS Code: Open
mcp.json → Click "Start" icon on top of "killer-bug-" in servers
- Cursor: Go to Settings → Enable MCP Server "killer-bug-"
Start debugging: Chat with your AI: "Debug this code and find the bug"
That's it! Your AI debugger is ready.
💡 Tip: The extension auto-starts when you open a configured project (can be disabled in settings). For unconfigured projects, just click the status bar button to get started!
🎯 What It Does
🎬 Live Debugging
Your AI can:
- Start debugging any file (Python, JavaScript, TypeScript, etc.)
- Set breakpoints and conditional breakpoints
- Step through code line by line
- Inspect variables and the call stack
- Evaluate expressions in real-time
[GIF: AI Setting Breakpoint and Stepping Through Code]
🔗 Remote Debugging
- Attach to running servers (FastAPI, Node.js, Flask, etc.)
- Debug over the network or in containers
- Use your existing
launch.json configurations
- Perfect for production debugging
[GIF: AI Attaching to Running FastAPI Server and Inspecting Variables]
🧠 AI-Powered Bug Hunting
- AI automatically explores your code
- Sets strategic breakpoints
- Finds and explains bugs
- Suggests fixes
[GIF: AI Finding and Explaining a Bug]
📚 How It Works
Your AI → MCP Protocol → Killer Bug → VS Code Debugger → Your Code
The extension runs an HTTP server that implements the Model Context Protocol. Your AI connects and controls the debugger through 17 specialized tools.
Session Control
- Start debugging any file (auto-detects language)
- Stop debug session
- Check execution state
- List and use existing
launch.json configurations
- Attach to running processes
Breakpoints
- Set breakpoints with conditions
- Remove breakpoints
- List all breakpoints
Execution
- Continue to next breakpoint
- Step over/into/out of functions
- Pause execution
Inspection
- View call stack with function names & line numbers
- Inspect variables in current scope
- Evaluate expressions safely
🚀 Installation & Setup
Marketplace (Recommended)
- Open VS Code → Extensions
- Search
Killer Bug AI Debugger
- Click Install
Development
git clone <repo>
cd vscode-debug-mcp
npm install
npm run build
# Press F5 to launch
Starting the Debugger:
- Click "Killer Bug: Ready (Click to Start)" in the status bar, OR
- Press
Ctrl+Shift+P / Cmd+Shift+P and run: Killer Bug: Start AI Debugger
- If not configured yet, select your IDE (VS Code or Cursor) and choose a port
- Done! The MCP server is now running
Connecting your AI client:
- Go to your AI client's MCP settings
- Add the Killer Bug server (if not auto-detected)
- Start debugging!
Or manual configuration for your MCP client:
{
  "mcpServers": {
    "killer-bug-debugger": {
      "type": "http",
      "url": "http://localhost:3100/mcp"
    }
  }
}
Settings
Auto-Start Configuration:
- Setting:
killerBug.autoStart (default: enabled)
- When enabled: MCP server automatically starts when you open a project that's already configured
- When disabled: Server won't start automatically; click the status bar button to start
- Configure per-workspace in VS Code Settings under "Killer Bug AI Debugger"
💬 Usage Examples
Basic Debugging:
"Debug the file app.py and set a breakpoint at line 42"
Step Through Code:
"Step through the calculate_total function and show me the variables"
Inspect State:
"What's the current call stack? Show me the value of user"
Remote Debugging:
"Attach to my FastAPI server running on port 5678 and debug the /api/users endpoint"
Using Configurations:
"Start debugging using my 'FastAPI Debug' configuration from launch.json"
Supported Languages
Automatically debugs:
- Python (
.py)
- JavaScript/TypeScript (
.js, .ts, .jsx, .tsx)
- And any language with VS Code debug adapter support
❓ FAQ
Q: Is my code safe?
A: Yes. The debugger only reads variables and evaluates safe expressions. No code modification without explicit AI request.
Q: Works with any AI?
A: Yes! Works with VS Code Copilot, Cursor AI, Claude Desktop, ChatGPT, and any AI/LLM that supports MCP protocol.
Q: What about privacy?
A: The server runs locally. All debugging happens on your machine. No data sent anywhere.
Q: Can I use it for production?
A: Yes! Remote debugging is perfect for debugging live servers safely.
🐛 Troubleshooting
Extension not starting?
- Check Output → Extension Host for errors
- Ensure port 3100 is available
AI can't connect?
- Run:
curl http://localhost:3100/health
- Verify MCP client configuration
Debugging tools not working?
- Start a debug session first
- Check Debug Console for logs
� Contributing
This project is open source and we'd love your help!
Have ideas for new features? Found a bug? Want to improve the code?
- Fork the repository - https://github.com/fellowabhi/Killer-bug
- Create a feature branch -
git checkout -b feature/your-feature
- Make your changes and test thoroughly
- Submit a Pull Request - We review all PRs and love community contributions!
All contributions are welcome, from bug fixes to new debugging features to documentation improvements.
�📄 License & Open Source
GPL-3.0-or-later - Free and Open Source Software
This program is free software: you can redistribute it and/or modify it under the terms of the GNU General Public License as published by the Free Software Foundation, either version 3 of the License, or (at your option) any later version.
What this means:
- ✅ Source code is publicly available on GitHub
- ✅ You can modify and redistribute it
- ✅ Any modifications must also be open source
- ✅ No warranty, but completely transparent
See LICENSE file for full details.
Source Code: https://github.com/fellowabhi/Killer-bug
Happy debugging! 🚀