Speedscope VS Code Extension
Open 🔬Speedscope profiles in VS Code and jump to the source code of the profiled functions.
Features
Open a speedscope profiles from VS Code Explorer

Menu item available for .json, .txt, .log, .prof, .cpuprofile and .heapprofile extensions.
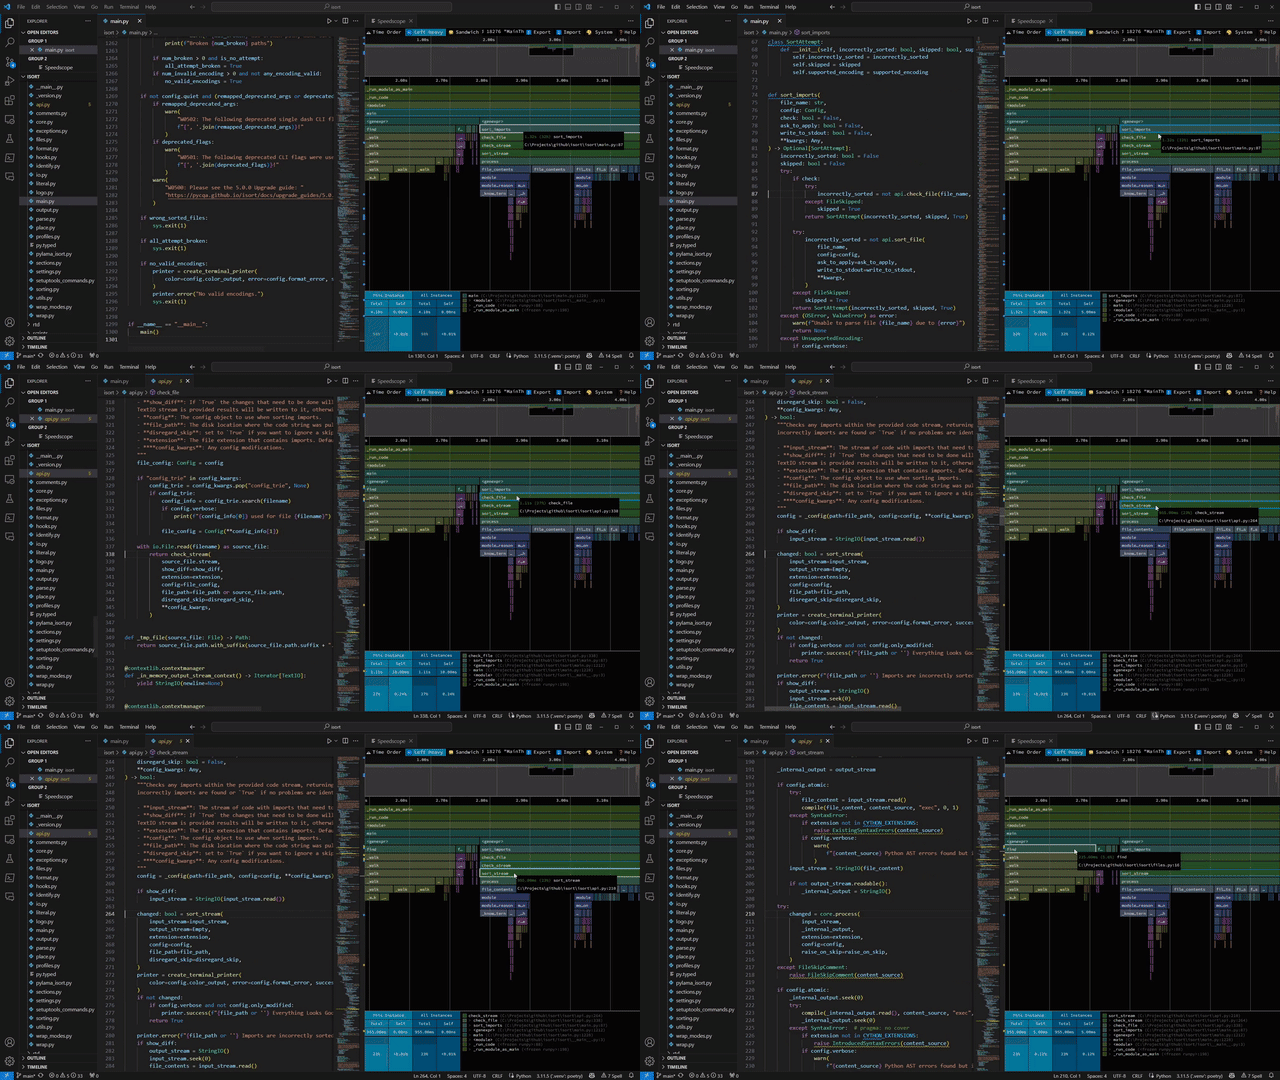
Jump to the source code of the profiled functions

Use Crtl+Click on the function name in the flamegraph to jump to the source code.
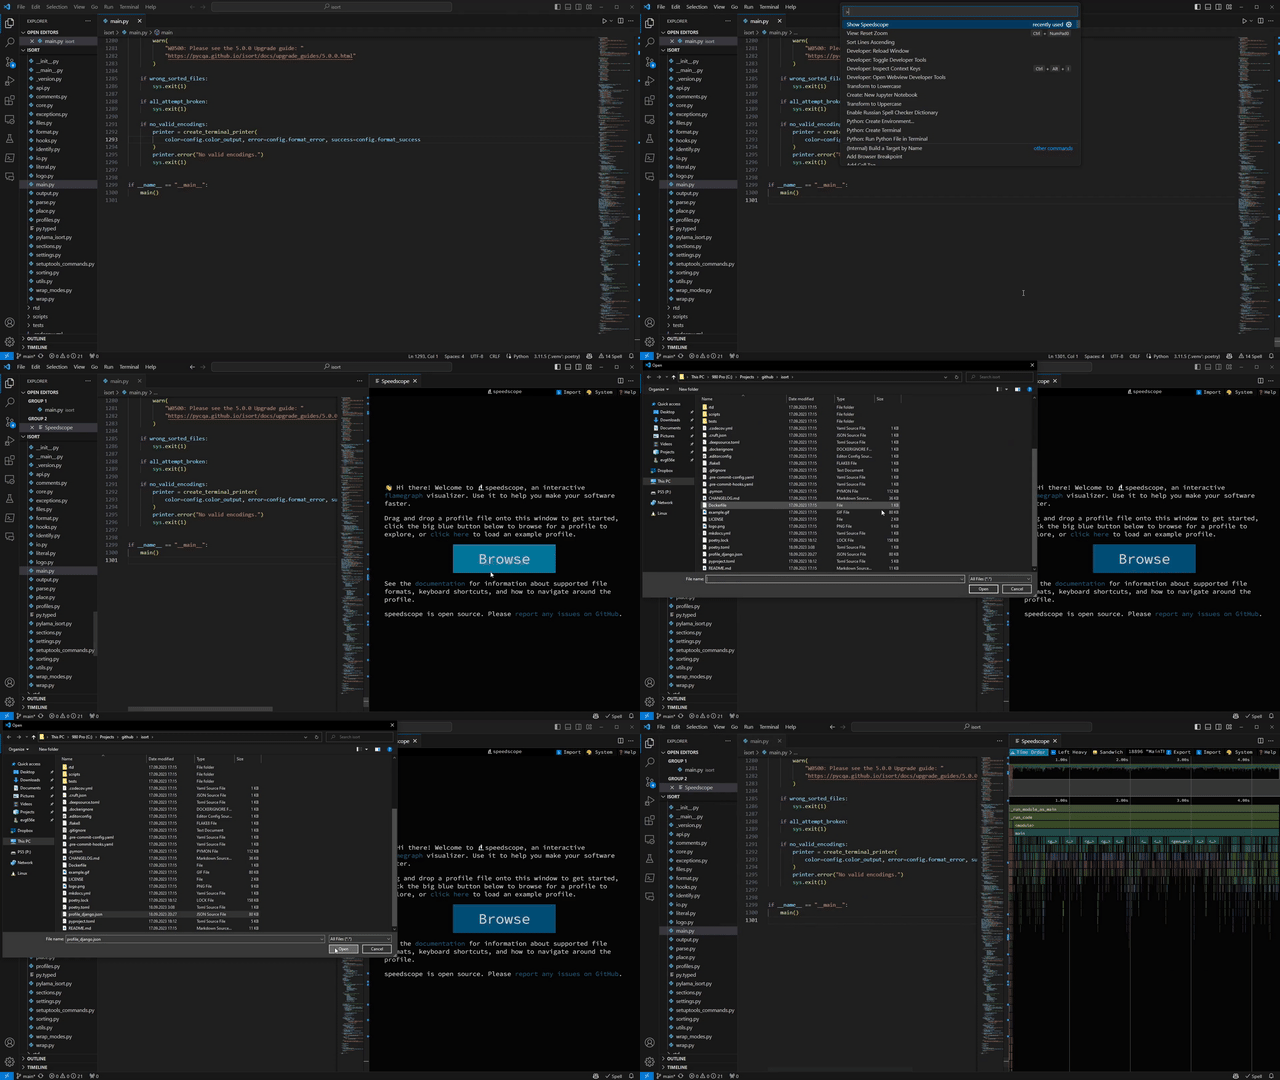
Show speedscope app in side view with ability to open local files

Use Ctrl+Shift+P and type Show Speedscope to open speedscope in side view.
Usage examples
Profiling with py-spy
Here is example of profiling automation with py-spy. Add following lines to your tasks.json file:
{
    // See https://go.microsoft.com/fwlink/?LinkId=733558
    // for the documentation about the tasks.json format
    "version": "2.0.0",
    "tasks": [
        {
            "label": "Profile isort",
            "type": "process",
            "command": "${env:LOCALAPPDATA}/Programs/Python/Python311/Scripts/py-spy.exe", // correct path for your system
            "args": [
                // py-spy arguments
                "record",
                "--output", "${workspaceFolder}/profile.json",
                "--format", "speedscope",
                // profiled app arguments (isort)
                "--",
                "${workspaceFolder}/.venv/Scripts/python.exe", // venv for profiled app (setup needed)
                "${workspaceFolder}/isort",
                "--diff",
                "--check",
                "--verbose",
                "C:/Projects/django/django", // running isort on django repo to collect profile samples
            ],
            "problemMatcher": []
        },
    ]
}
Now you can run this task and open the profile in VS Code speedscope view with ability to jump to the source code of the profiled functions.

