Emulicious DebuggerThis extension enables debugging with Emulicious in VS Code. Installation Launch VS Code Quick Open ( Ctrl+P), paste the following command, and press enter.Copied to clipboard |

Emulicious-debugger READMEThe "emulicious-debugger" extension enables debugging with Emulicious in VS Code. This extension requires Emulicious. For breakpoints to work you need a language extension for the language you are using. For usage instructions see Usage. Known issues are listed in Known Issues. If you encounter any other issues please inform about them so they can be fixed. If anything is unclear please also inform about that so the explanations can be improved. RequirementsThe "emulicious-debugger" extension requires Visual Studio Code (VS Code) or VSCodium and Emulicious. For breakpoints to work you need a language extension for the language you are using. If you are using C you can for example use the C language extension that is built into VS Code. For other languages you should be able to find a corresponding language extension in VS Code's Extension Marketplace. For example if you are developing for the Game Boy (Color) with RGBDS you can find Donald Hays's RGBDS Z80 extension. UsageIf you want to attach to a running debug session in Emulicious or want to launch a debug session in a running instance of Emulicious, you need to enable If you want VS Code to start Emulicious when you launch the Emulicious Debugger, you need to specify the path to Emulicious in your configuration.
You can either set it globally in your user/workspace settings via CTRL+, -> Extensions -> Emulicious Debugger or locally for your project only via a launch configuration. You can let After that is set up, you have multiple ways in VS Code to start debugging with Emulicious:
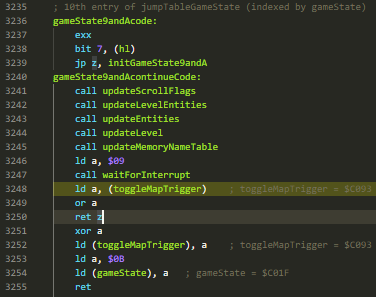
Option 3) is the preferred one because it allows building and launching with a single press of a button (F5). When building your program, make sure that debug symbols get generated. For assembler code, this typically is a *.sym or *.lst file. For C code with SDCC, this is a *.cdb file. Please consult the documentation of your assembler/compiler to determine how to generate such files. For example when using FeaturesThe "emulicious-debugger" extension enables source level debugging for assembler code and C code (SDCC). Source-level SteppingStep through your own ASM source code.
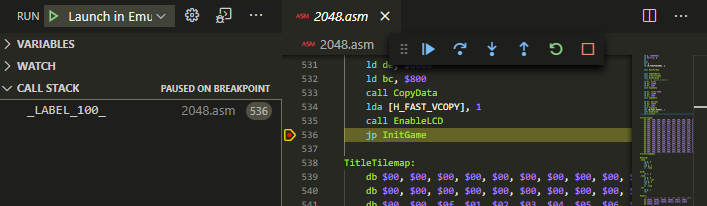
Source BreakpointsBreak on breakpoints in your ASM source code.
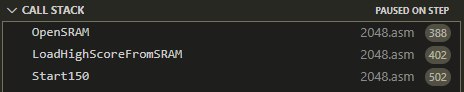
CallstackKeep an eye on your callstack.
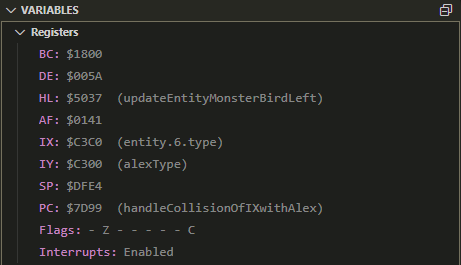
Investigate RegistersInvestigate registers annotated with symbols.
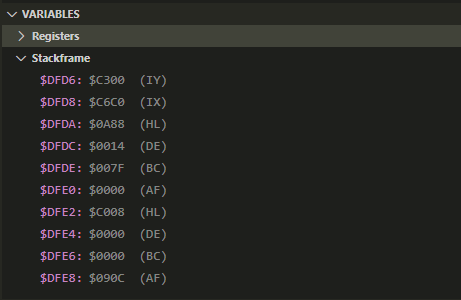
Investigate StackframesInvestigate stackframes.
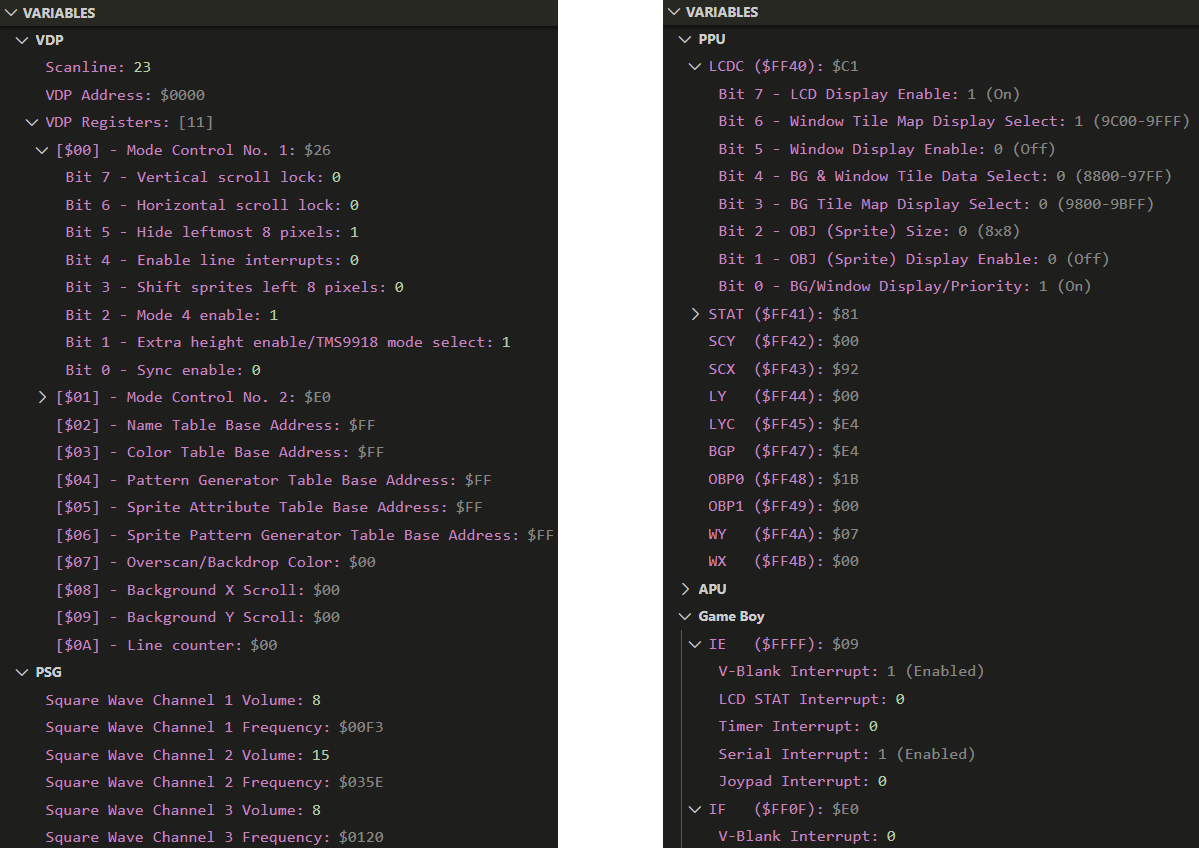
Investigate System StateInvestigate system state.
Inspection on HoverInspect symbols on hover.
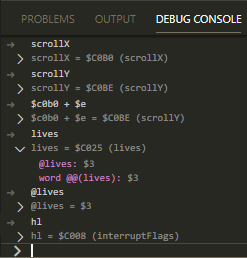
Debug ConsoleEvaluate expressions in debug console
DisassembleDisassemble with Emulicious and step through the disassembly in VS Code.
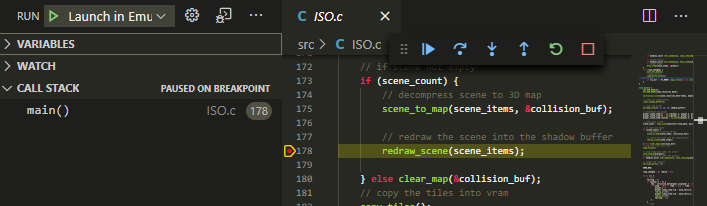
C-level SteppingStep through your C source code line by line, into procedures or out of them.
C-level BreakpointsBreak on breakpoints in your C source code.
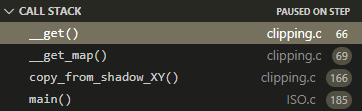
C CallstackKeep an eye on your C callstack.
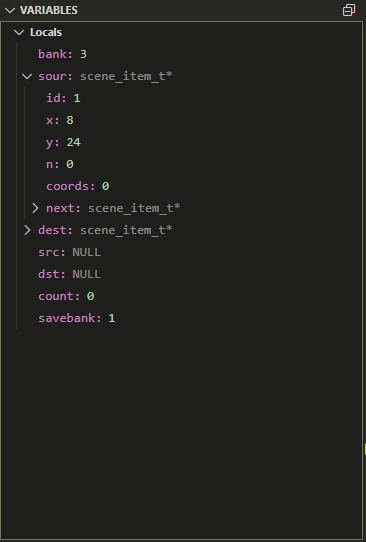
C Local VariablesKeep track of your local variables.
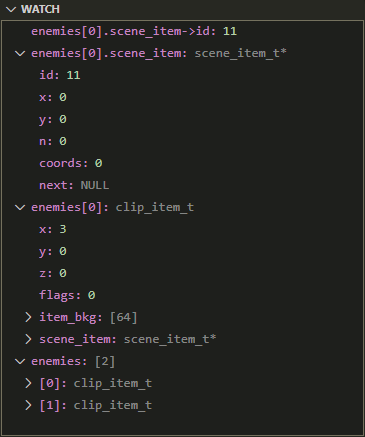
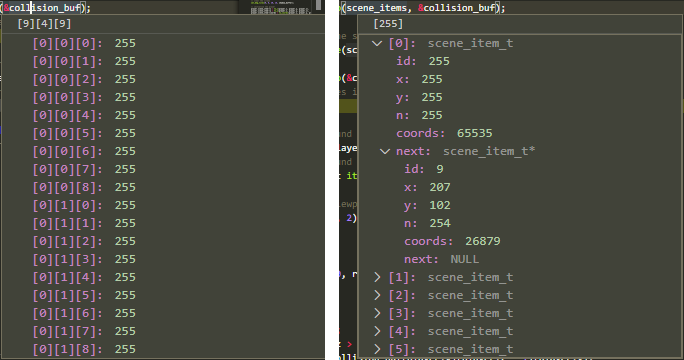
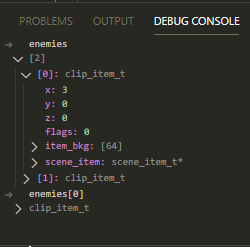
C Inspection of Structured TypeInspect your C arrays and structs via Watch expressions, on hover or via the debug console.
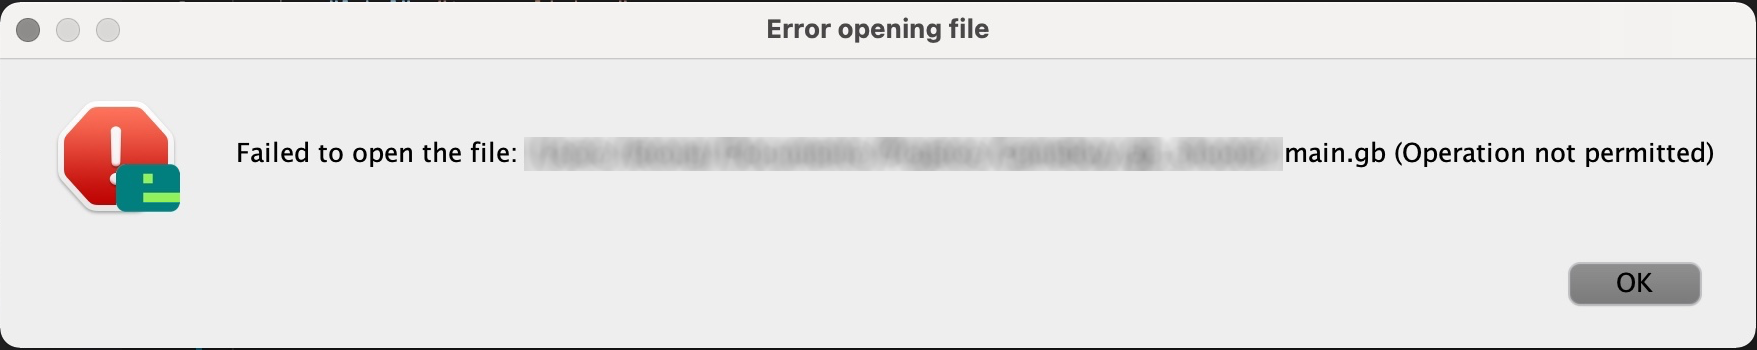
Known IssuesOperation Not PermittedOn Mac OS, you might see the following error message:
This error is caused by missing permissions. You can fix this error by granting the required permissions to Missing Exception BreakpointsDue to the way how VS Code handles exception breakpoints, you need to start another debug session to make the list of exception breakpoints update. Unexpected Behavior In C DebuggingWhen debugging C code, you might notice that sometimes the debugger does not behave the way you would expect. This is not really an issue of the debugger or your program. The unexpected behavior is caused by optimizations done by SDCC. SDCC makes changes to your code which provide a performance gain without altering the semantics of your code. So it is possible that (unused) variables get eliminated and that the order of instructions is swapped. Another optimization done by SDCC is called register allocation. That means that some variables live in CPU registers. For their values, the debugger shows the note Please consult the documentation of SDCC if you want to disable these optimizations or want to learn more about them. Debugging code that uses EmuliciousEmulicious is a free to use multi-system emulator for Windows, Linux, Raspberry Pi OS, Mac OS(X) and any other operating system supporting Java SE. It is focused on reverse-engineering, ROM hacking and development. For that it provides several tools such as a debugger with a smart disassembler (splitting code from data). Emulicious emulates the Game Boy and Game Boy Color, the MSX1 and the Master System and the Game Gear. Release Notes1.3.0Added an error message if no port is specified Added Fixed typos in some error messages 1.2.0Added Added 1.1.2Added fallback to run Emulicious from PATH if 1.1.1Fixed unnecessary delays caused by stdio 1.1.0Added support for launching Emulicious from VS Code Added Added 1.0.5Added Added better error message for when Emulicious is not running README improvements 1.0.4Added description of Emulicious and added gamegear keyword 1.0.3Added some missing keywords and improved some screenshots 1.0.2README improvements 1.0.0Initial release of "emulicious-debugger" |