Copilot Usage

Supported versions: VS Code Stable, VS Code Insiders — usage is automatically discovered and aggregated across both.
Local-first analytics for your GitHub Copilot Chat token usage in VS Code. All processing happens on your machine — no data is sent externally.
Contributors
- Sachi Harshitha Liyanagama — project creator and maintainer
- Steven Maglio — VS Code Insiders support foundation (originated in PR #4)
Features
- Billing & Developer Lenses — Switch either dashboard between two views of the same window:
Billing (default) reports the model rounds and metered AI Credits Copilot actually charged for,
read from Copilot's debug logs; Developer reports the request-level prompt/output token estimates
from your chat sessions. A confidence badge shows how much of the range the metered data covers.
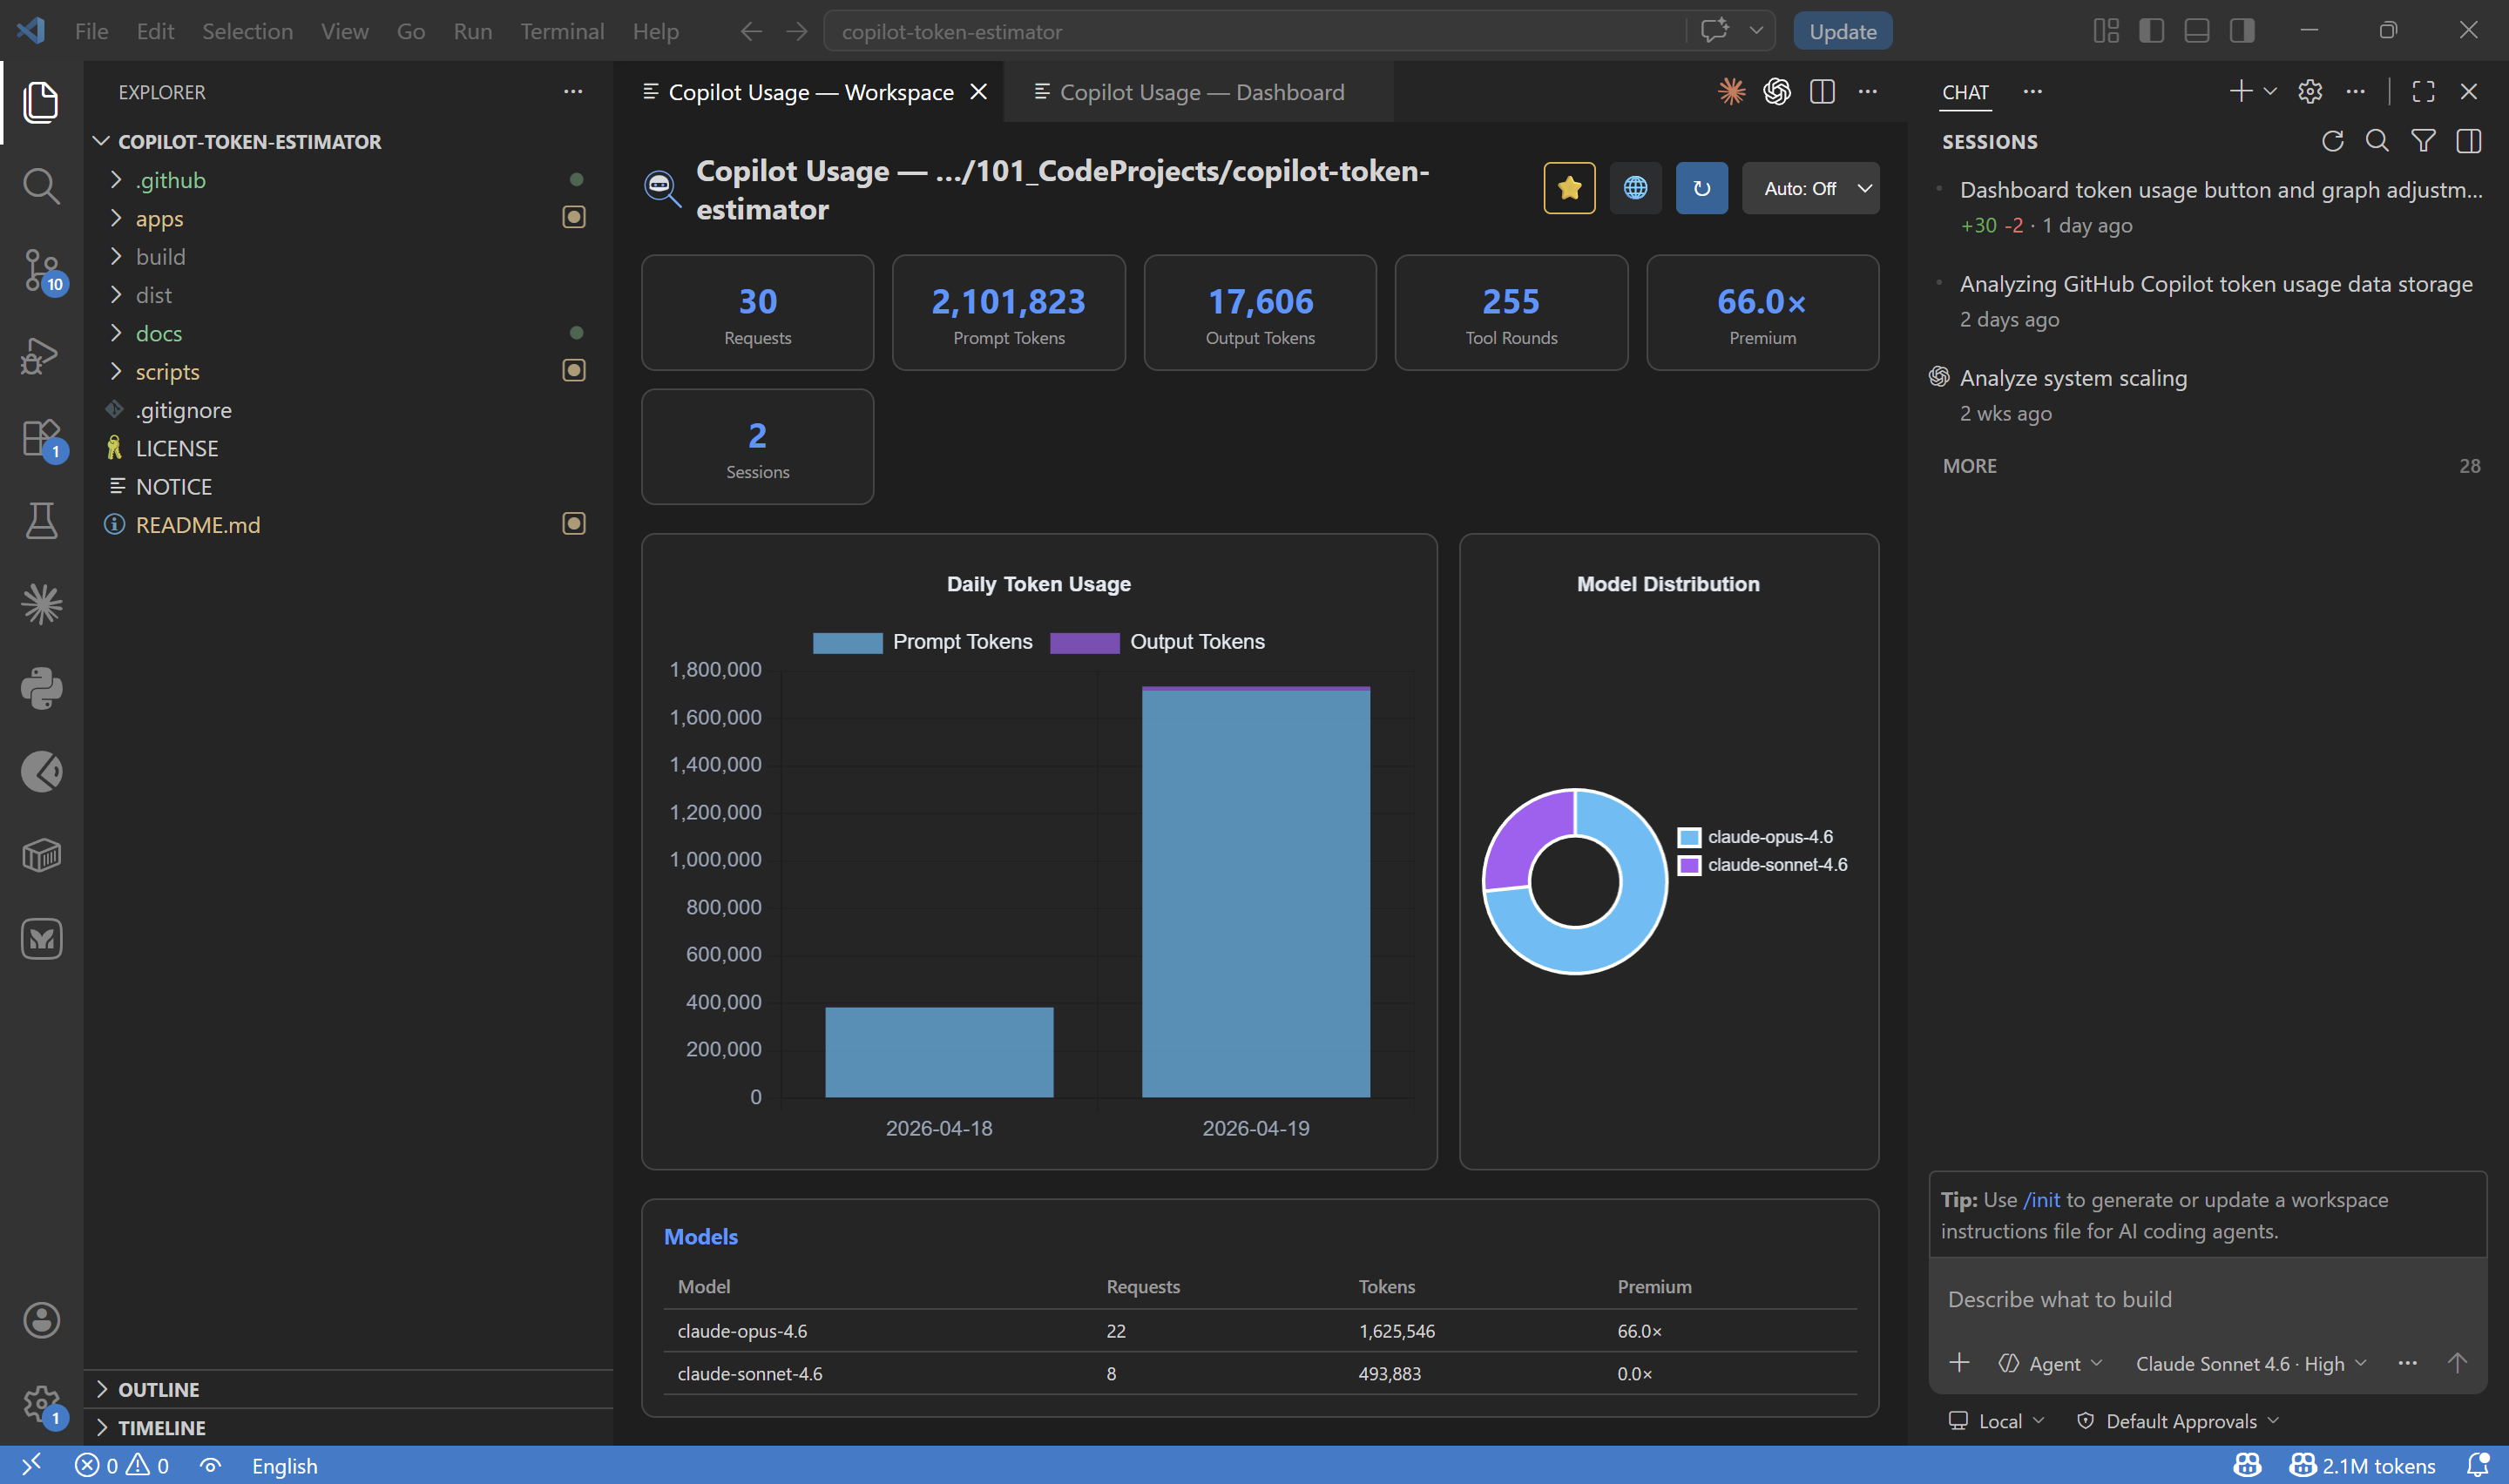
- Workspace Analysis — Token usage, model distribution, and daily trends for the current workspace
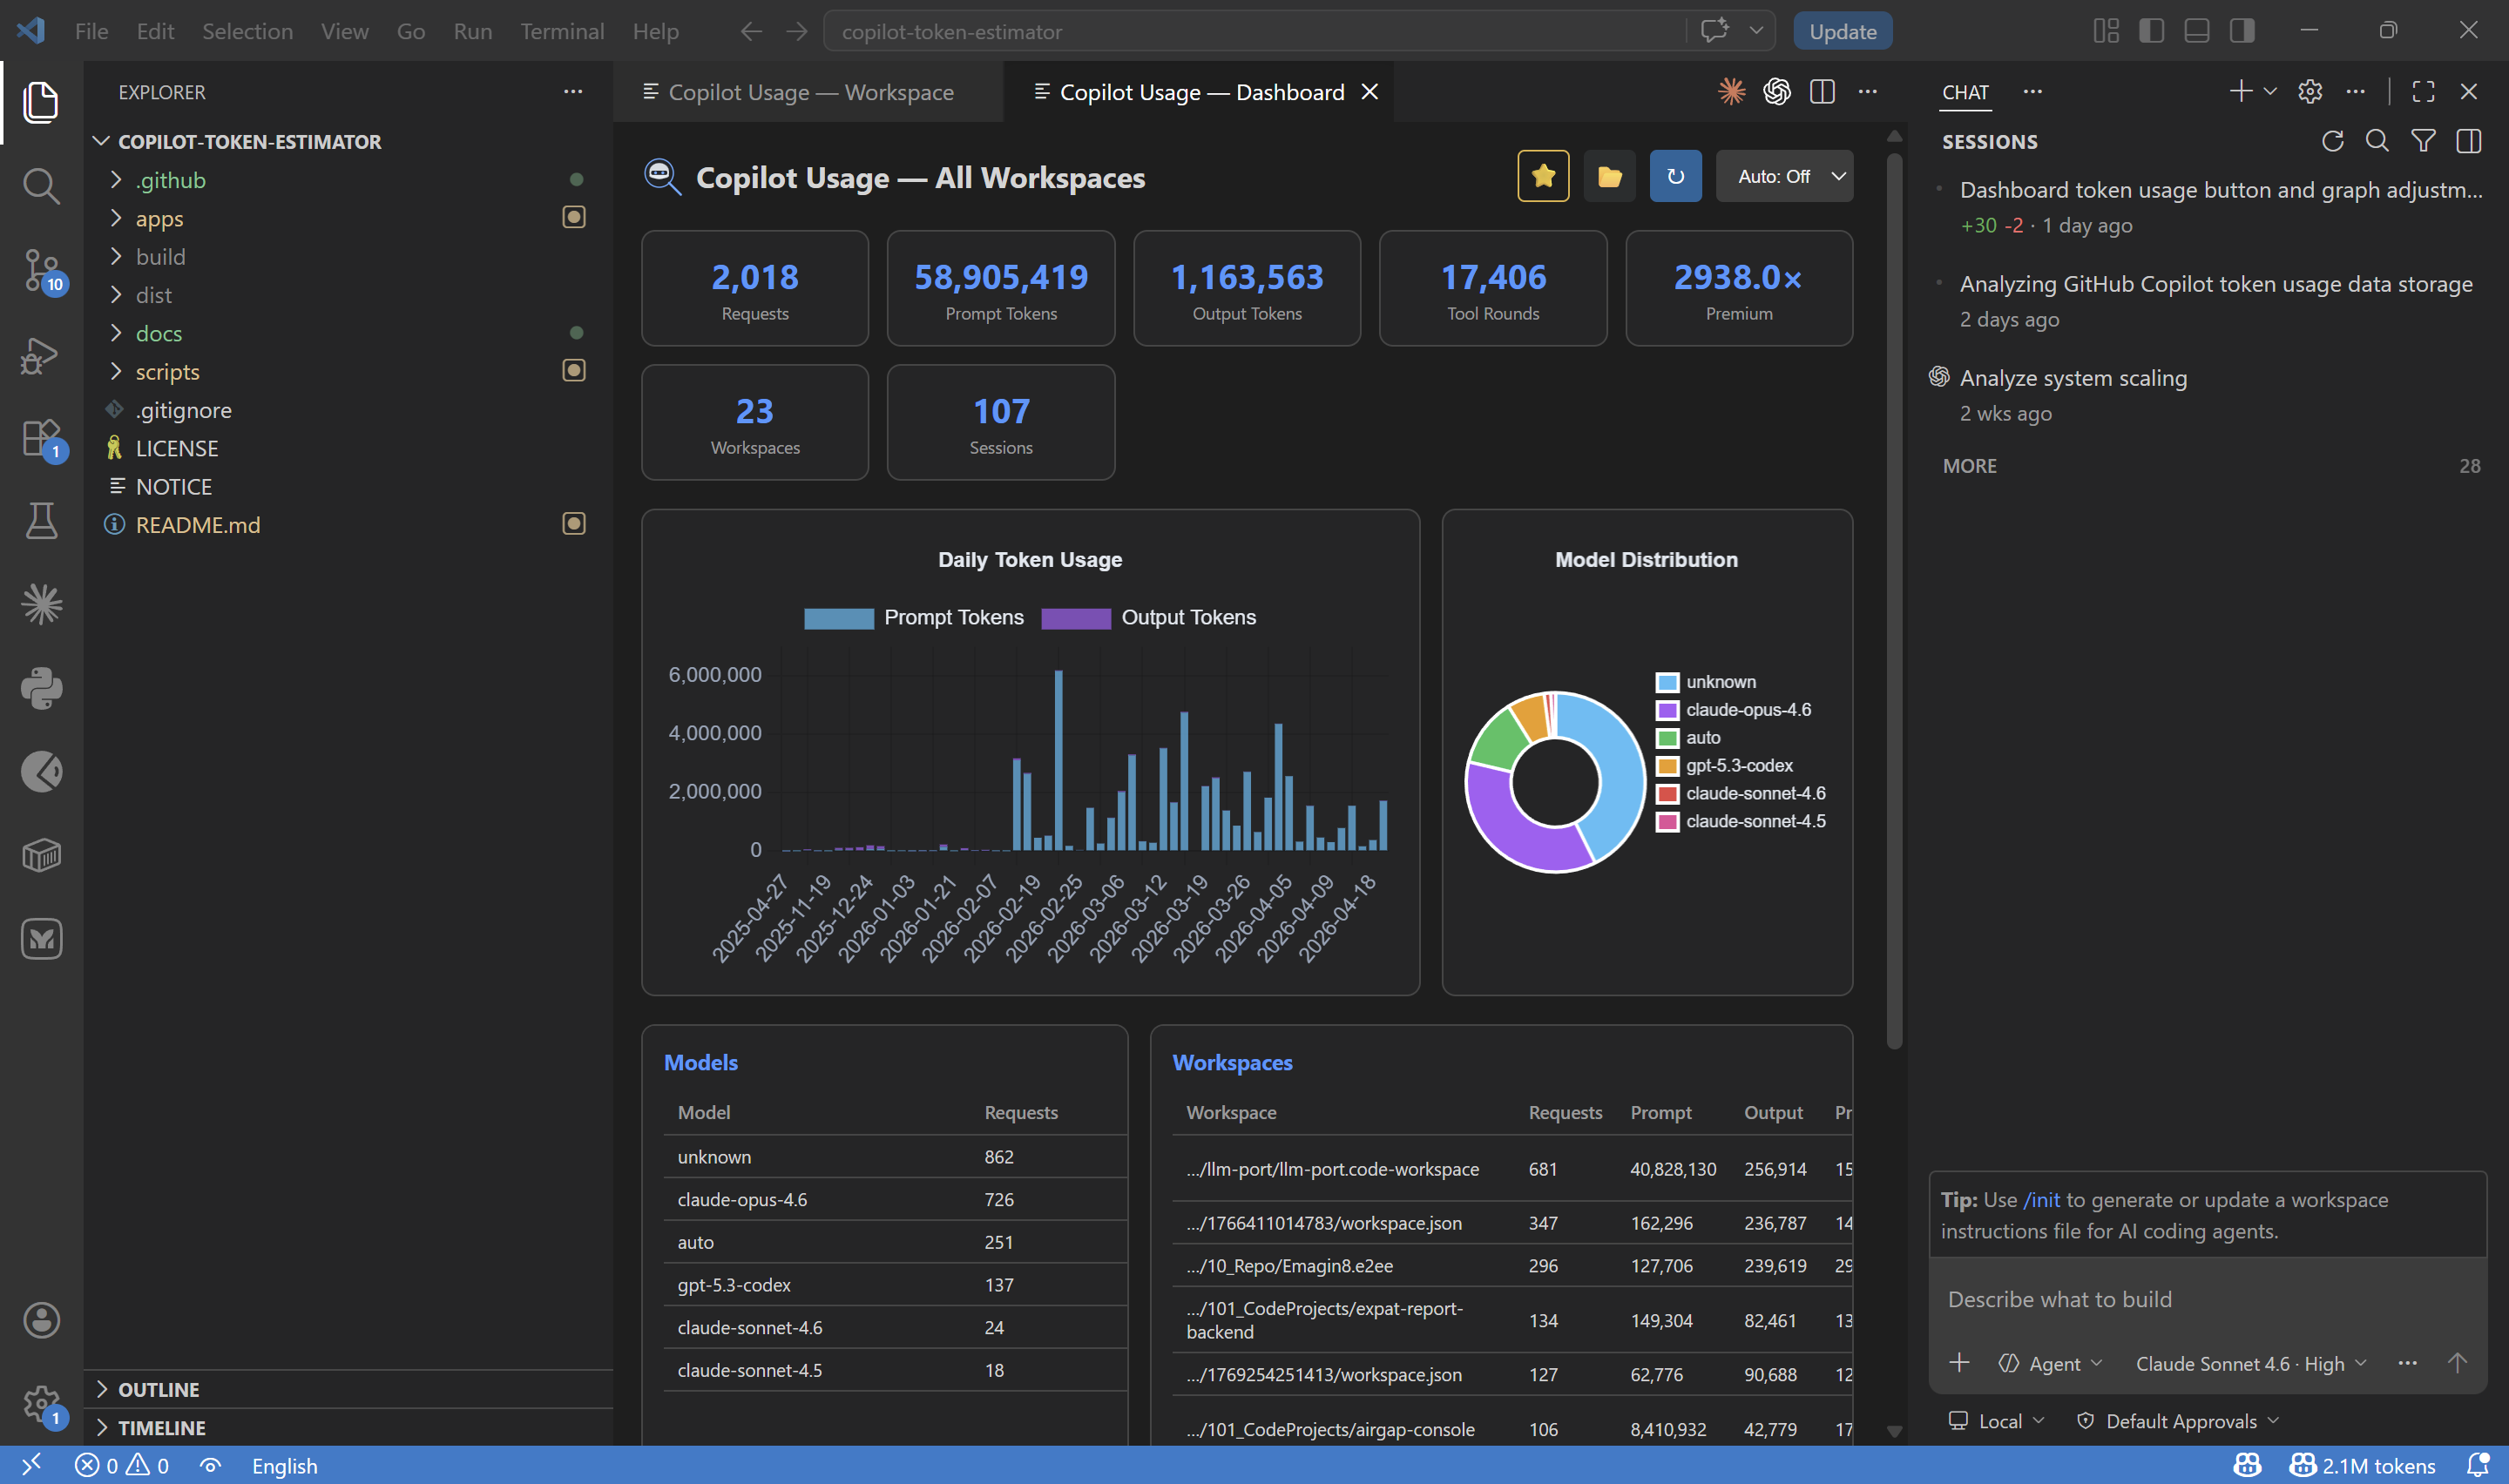
- Global Dashboard — Aggregated stats across all workspaces: KPIs, daily chart, model breakdown, workspace comparison, and repository-level breakdown
- Dashboard Toolbar — Change the date range straight from the panel, and reach export, refresh and settings without leaving the view
- Excel Report Export — Download the global dashboard as a formatted
.xlsx workbook with a Dashboard slide plus Models, Repos, Workspaces, DailyData and Metadata sheets
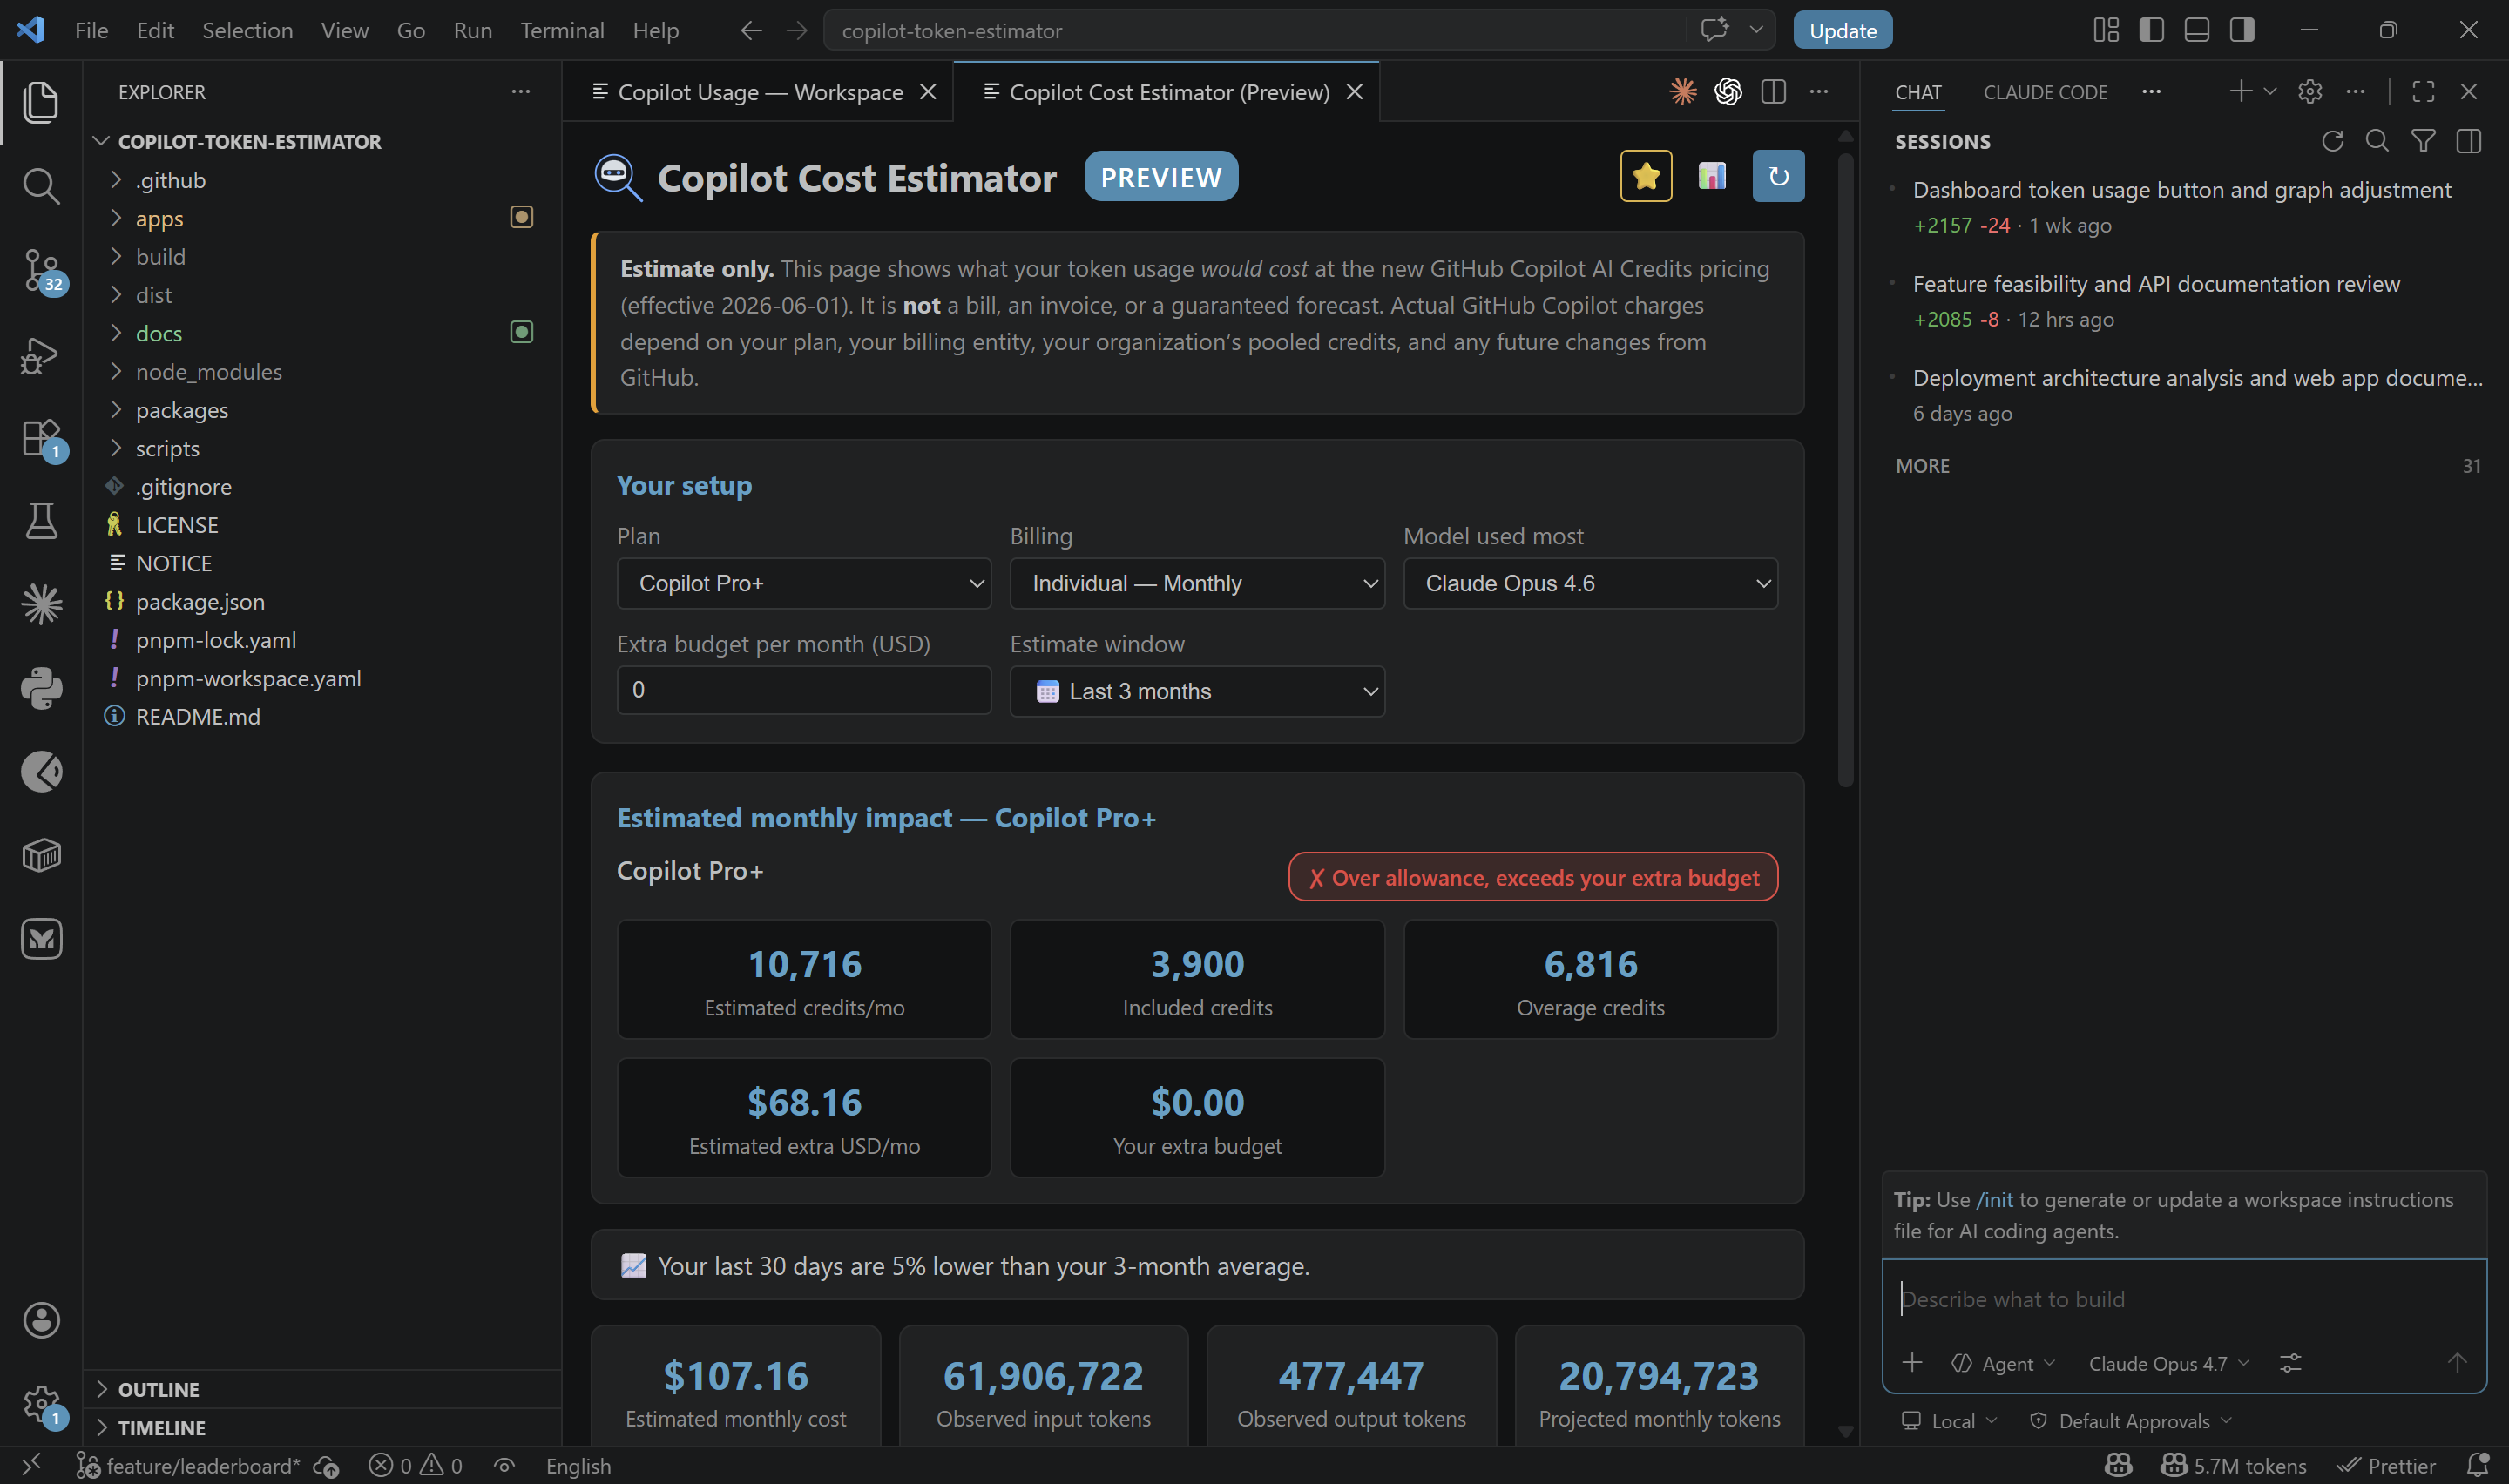
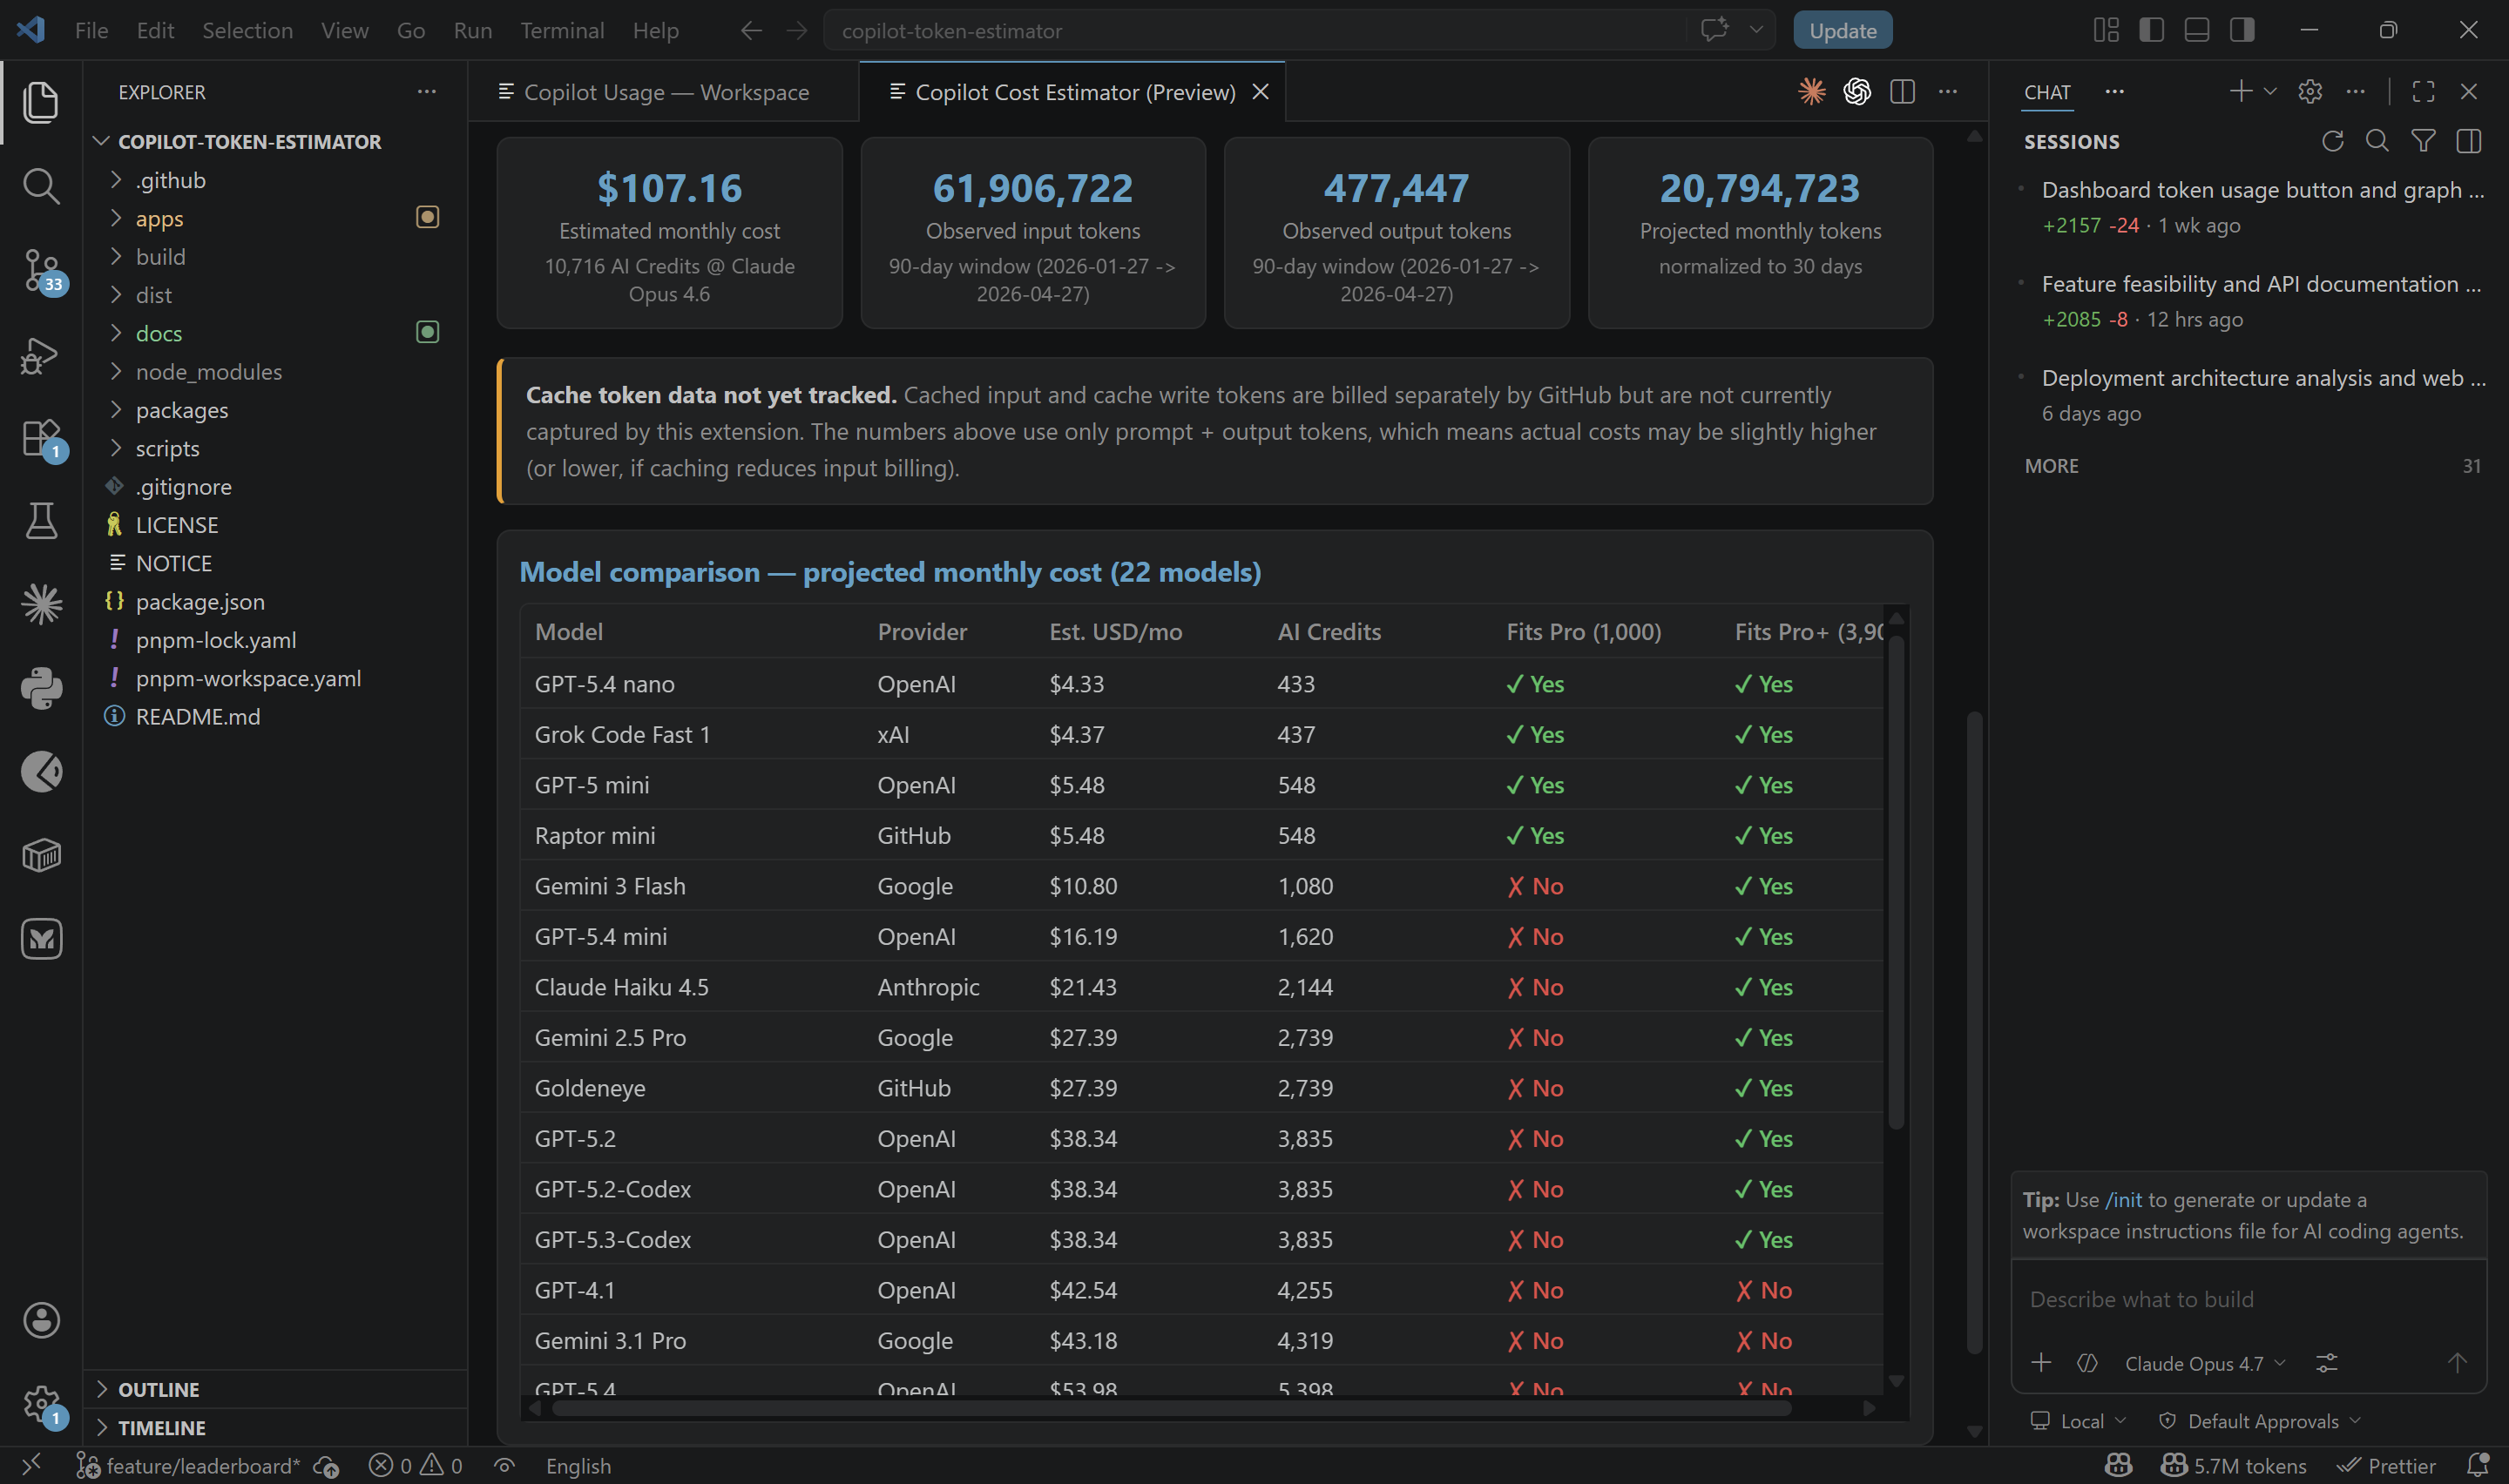
- Cost Estimator (Preview) — Estimate monthly Copilot AI Credits usage and compare model costs
- Capability-aware Provider Comparison — Compare provider options using model family and tier coverage, capability risk labels, grouped recommendations, and savings-vs-baseline signals with a near-current buffer
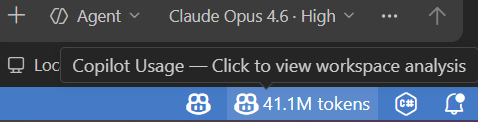
- Status Bar — Live token count for the current workspace; click to open analysis
- Tool Call Rounds — Track how many agentic tool-call rounds Copilot uses per session
- Auto-refresh Timer — Set a 30s / 1m / 2m / 5m interval to keep dashboards up to date
Screenshots
Global Dashboard
KPIs, daily token usage chart, model distribution, per-workspace breakdown, and repository-level breakdown across all your projects.
Workspace View
Focused analysis for the current workspace — token usage, daily trends, and model stats.
Cost Estimator (Overview)
Estimated monthly impact based on your observed usage window, selected plan, and selected model.
Cost Estimator (Model Comparison)
Compare projected monthly cost and AI Credits across available models.
Cost Estimator (Provider Comparison - Capability-Aware)
Evaluate provider portfolios with fit score, substitution coverage, capability risk, and savings vs baseline.

Cost Estimator (Provider Comparison - Recommendation View)
See grouped recommendation cards and a decision-oriented table to identify comparable portfolios and cheaper-but-riskier alternatives.

Status Bar
Always-visible token count in the status bar. Click to open the workspace analysis panel.
Commands
| Command |
Description |
Copilot Usage: Workspace Analysis |
Open workspace-scoped token analysis panel |
Copilot Usage: Global Dashboard |
Open cross-workspace dashboard |
Copilot Usage: Export Excel Report |
Export the global dashboard as an .xlsx workbook |
Copilot Usage: Cost Estimator (Preview) |
Open monthly AI Credits cost estimator |
Copilot Usage: Refresh Data |
Manually refresh status bar data |
Copilot Usage: Open Copilot Debug Log Setting |
Jump to the Copilot setting that enables debug file logging |
Settings
| Setting |
Default |
Description |
copilot-usage.dashboard.lens |
billing |
Which lens the dashboards open in — billing (metered credits) or developer (request estimates) |
copilot-usage.metered.enabled |
true |
Parse Copilot debug logs for metered analytics |
copilot-usage.metered.minCoverage |
0.95 |
Fraction of rounds that must carry credit data before the confidence badge reads Exact |
copilot-usage.dashboard.dateRange |
30d |
Date range the Global Dashboard opens with |
copilot-usage.workspaceAnalysis.dateRange |
30d |
Date range the Workspace Analysis panel opens with |
copilot-usage.dashboard.autoRefreshSeconds |
0 |
Auto-refresh interval for the dashboard; 0 disables it |
copilot-usage.workspaceAnalysis.autoRefreshSeconds |
0 |
Auto-refresh interval for workspace analysis; 0 disables it |
copilot-usage.statusBar.duration |
all-time |
Window the status bar counts — daily, monthly or all-time |
copilot-usage.export.shortenWorkspacePaths |
true |
Shorten workspace and repository paths in the exported report |
Excel Report Export
Click ⤓ Report in the Global Dashboard header (or run Copilot Usage: Export Excel Report) to save
a workbook containing:
| Sheet |
Contents |
Dashboard |
KPI cards and four charts — daily token usage, model share, top repositories, top workspaces |
Models |
One row per model: requests, prompt/output/total tokens, premium units, credits, token share |
Repos |
One row per repository, using the same weighted attribution the dashboard shows |
Workspaces |
One row per workspace, with its top model |
DailyData |
One row per day: requests, tokens, tool rounds, premium units, credits, sessions |
Metadata |
Schema and extension version, generation time, timezone, date range, and privacy settings |
The Models and DailyData sheets carry a second block of metered columns — rounds, input, output and
cached tokens, credits, and coverage — whenever debug-log data is available for the range. They are left
empty rather than filled with zeros when it is not.
The export mirrors exactly what the dashboard is displaying, including the active date-range filter.
Every day in range is written to DailyData; the daily chart plots the most recent 90 days so it stays
readable. Workspace and repository paths are shortened to their last two segments by default — set
copilot-usage.export.shortenWorkspacePaths to false to write full paths.
The workbook contains aggregate counts only. No prompt text, response text, or source code is exported.
Troubleshooting: Numbers Not Showing
If token numbers are missing, stuck at 0, or much lower than expected:
- Open VS Code Settings and search for
github.copilot.chat.agentDebugLog.fileLogging.enabled.
- Enable GitHub › Copilot › Chat › Agent Debug Log › File Logging.
- Reload VS Code (the setting requires reload to fully apply).
- Run Copilot Usage: Refresh Data.
- Trigger at least one new Copilot Chat request in the target workspace and refresh again.

If needed, run Copilot Usage: Open Copilot Debug Log Setting to jump directly to the correct setting.
How It Works
Two local sources feed the dashboards, and neither ever leaves your machine.
The Developer lens parses JSONL and legacy JSON chat session files from VS Code's workspace storage
directory (workspaceStorage/{hash}/chatSessions/), extracting prompt tokens, output tokens, model
identifiers, tool-call rounds, and timestamps.
The Billing lens parses Copilot's own debug logs
(workspaceStorage/{hash}/GitHub.copilot-chat/debug-logs/), which record every model round Copilot
issued along with the input, output and cached token counts and the credits it was metered at. Because
one chat request can fan out into many rounds, this is the view that lines up with what you are billed
for — which is why a confidence badge reports how much of the selected range actually carries credit data.
Disclaimer
Copilot Usage is an independent, community-built project. It is not affiliated with, endorsed by, sponsored by, or approved by Microsoft or GitHub.
The Cost Estimator uses this project's own methodology based on local usage data and publicly available pricing references. It is not an official Microsoft or GitHub billing calculator and does not constitute billing, accounting, tax, legal, or financial advice.
GitHub and Microsoft names and trademarks are the property of their respective owners.
Links
Enjoy!

