Nokia EDA (Event Driven Automation) - VS Code Extension
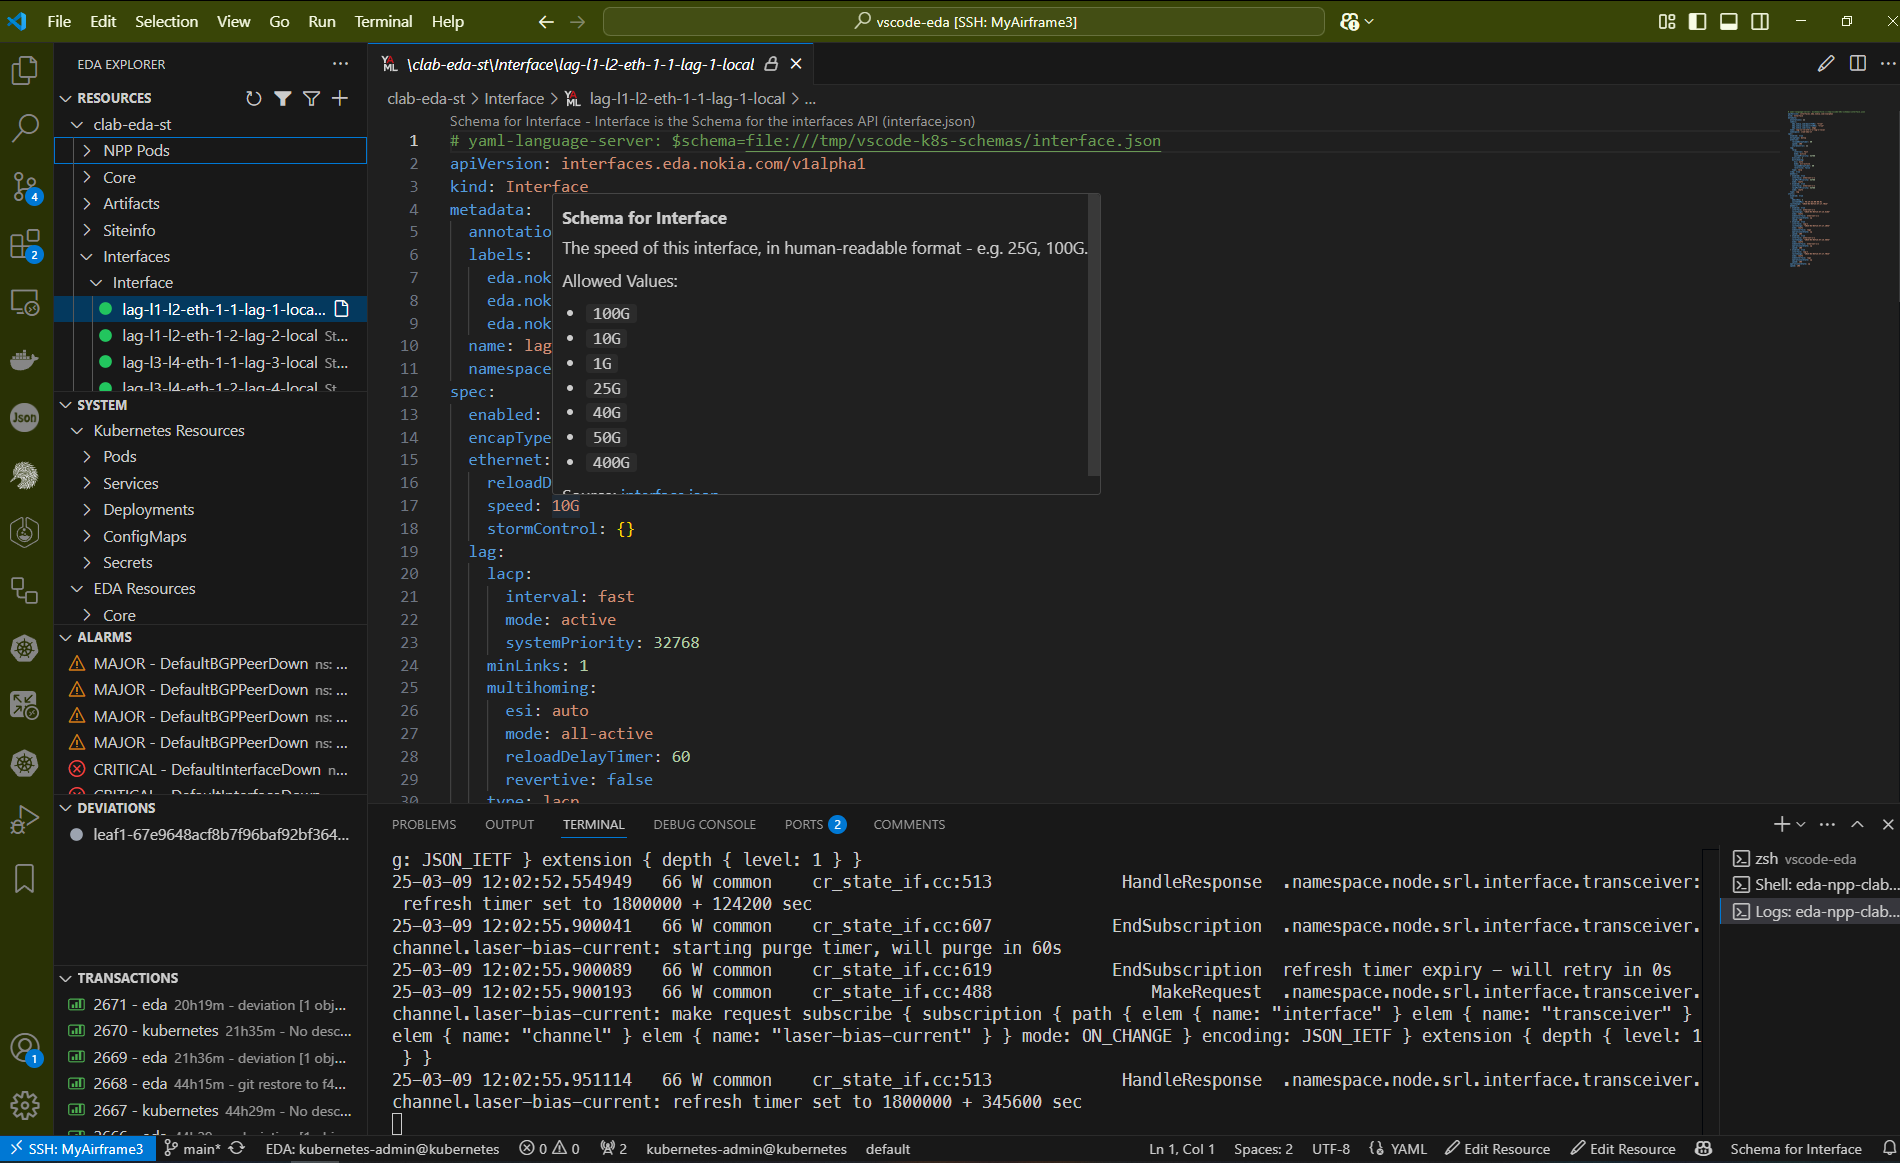
Manage and monitor EDA (Event Driven Automation by Nokia) resources directly through the EDA API from Visual Studio Code. Whenever possible data is streamed over WebSockets for a more responsive experience. This extension provides a convenient UI to view EDA namespaces, CRDs, system components, pods, alarms, deviations, and transactions — plus handy commands for editing and applying resources.

Features
EDA Namespaces and Resources
- Browse resources in each EDA-managed namespace.
- Create new resources from CRD skeletons.
- Switch to edit mode with a single click — then apply or dry-run your changes.
- YAML-based autocompletion and validation for EDA resources.
- Real-time updates using watch streams (no manual refresh).
Kubernetes
- Kubernetes namespaces and resources are listed under a top-level "Kubernetes" item in the Resources view.
- Uses a distinct icon to differentiate from EDA resources.
Alarms & Deviations
- See active alarms
- View deviations and reject them individually or all at once
Transactions
- Browse the most recent transactions streamed from EDA (50 by default).
Use the Set Transaction Limit action in the Transactions view to adjust
how many are loaded. The extension will restart the stream and reload the
initial transaction list when you change the limit.
- View detailed information for a transaction directly from the EDA API.
- Stage multiple operations in a transaction basket for commit or dry-run.
Pod & Deployment Actions
- Open a terminal to a Pod, view logs in a terminal, or delete/describe a Pod.
- Restart deployments or delete resources directly from the tree view.
Node Configuration Viewer
- Inspect running node configs with color-coded syntax highlighting.
- Copy lines or toggle color mode as needed.
Filtering
- Quick filter at the top-level views (
Alt+Shift+F by default).
- Clear filter to revert to full tree.
Help Links
- Access documentation, product page, community Discord and GitHub repositories.
Installation
Prerequisites
- Access to an EDA API server. The extension communicates directly with EDA so a Kubernetes cluster is not required.
- Optional: a
kubeconfig file to enable Kubernetes features such as listing cluster resources.
Install from VSIX or Marketplace
Reload VS Code to finalize activation.
Authentication
If no EDA targets are configured on first activation, the extension launches a setup wizard to collect your EDA and Keycloak passwords.
The credentials are stored in VS Code's Secret Storage and are keyed by the target's host. Use the EDA: Update Target Credentials command to update passwords for a specific target.
Usage
Open the Explorer
Look for EDA Explorer on the activity bar. This is the main UI.
Browse and Filter
Expand the desired view, or press Alt+Shift+F to filter.
Edit Resources
Right-click a resource → "View Resource". Then press the switch-to-edit icon (or command) to make changes.
Apply or Dry-Run
Use the checkmark icon or the commands in the editor title bar to apply changes or validate with a dry-run.
Check Logs and Terminal
Right-click a Pod to open logs or a shell.
Configuration
In VS Code settings (File → Preferences → Settings), navigate to Extensions → EDA Explorer:
vscode-eda.logLevel
Adjust logging verbosity.
debug = Debuginfo = Info (default)warn = Warningerror = Error
vscode-eda.nodeConfigColorMode
Adjusts syntax highlighting for node configuration views.
full = full color (default)less = only highlight key states and numbersnone = no color highlighting
vscode-eda.edaTargets
Map EDA API URLs to optional Kubernetes contexts and credentials. Each value may be a simple context string or an object. Use skipTlsVerify: true to bypass TLS certificate validation for a specific target. You can also set EDA_SKIP_TLS_VERIFY=true to disable TLS verification for all targets:
The optional coreNamespace property sets the EDA Core namespace for a target and defaults to eda-system.
{
  "https://eda-example.com/": {
    "context": "kubernetes-admin@kubernetes",
    "edaUsername": "admin", // your EDA-realm username for this URL
    "kcUsername": "admin", // your Keycloak (KC) admin username
    "skipTlsVerify": false, // optionally skip TLS verification
    "coreNamespace": "eda-system" // EDA core namespace for this target
  },
  "https://10.10.10.1:9443": {
    "context": "kind-eda-demo",
    "edaUsername": "admin", // whatever user you’ve set up in EDA
    "kcUsername": "admin", // your Keycloak admin user
    "skipTlsVerify": true,
    "coreNamespace": "eda-system"
  }
}
Contributing
Contributions are welcome via GitHub pull requests or issues. For major changes, please open an issue first to discuss what you would like to change.
Connect with us on Discord for support and community discussions.


