CallSight — Interactive Call-Flow Diagrams
CallSight parses your codebase and renders an interactive, whiteboard-style call-flow diagram right inside VS Code. Fully local, no cloud, no LLM, no telemetry. This aims to massively improve PR - reviews and agentic code generation reviews through deterministic approach missing nothing.

Supported Languages
| Language |
Functions |
Calls |
Components/Hooks |
| TypeScript |
✅ |
✅ |
✅ |
| JavaScript |
✅ |
✅ |
✅ |
| TSX |
✅ |
✅ |
✅ |
| JSX |
✅ |
✅ |
✅ |
| Python |
✅ |
✅ |
— |
| Go |
✅ |
✅ |
— |
Demo (Click below to watch on youtube)
Watch the demo on youtube
Features
- Visualize your entire codebase — every function becomes a node, every call becomes an edge
- Language support — TypeScript, JavaScript, TSX, JSX, Python, Go
- Interactive canvas — drag, zoom, pan, and explore your code's call flows
- Flow partitioning — automatically groups functions into independent execution flows
- Minimap — navigate large graphs at a glance
- Sidebar — browse flows and functions, sort, search, and multi-select
- Isolate by node — type in the canvas search to isolate a function and its direct neighbours
- Go to Root — jump to any entry-point node from the canvas toolbar dropdown
- Fully local — deterministic analysis powered by Tree-sitter, no network calls
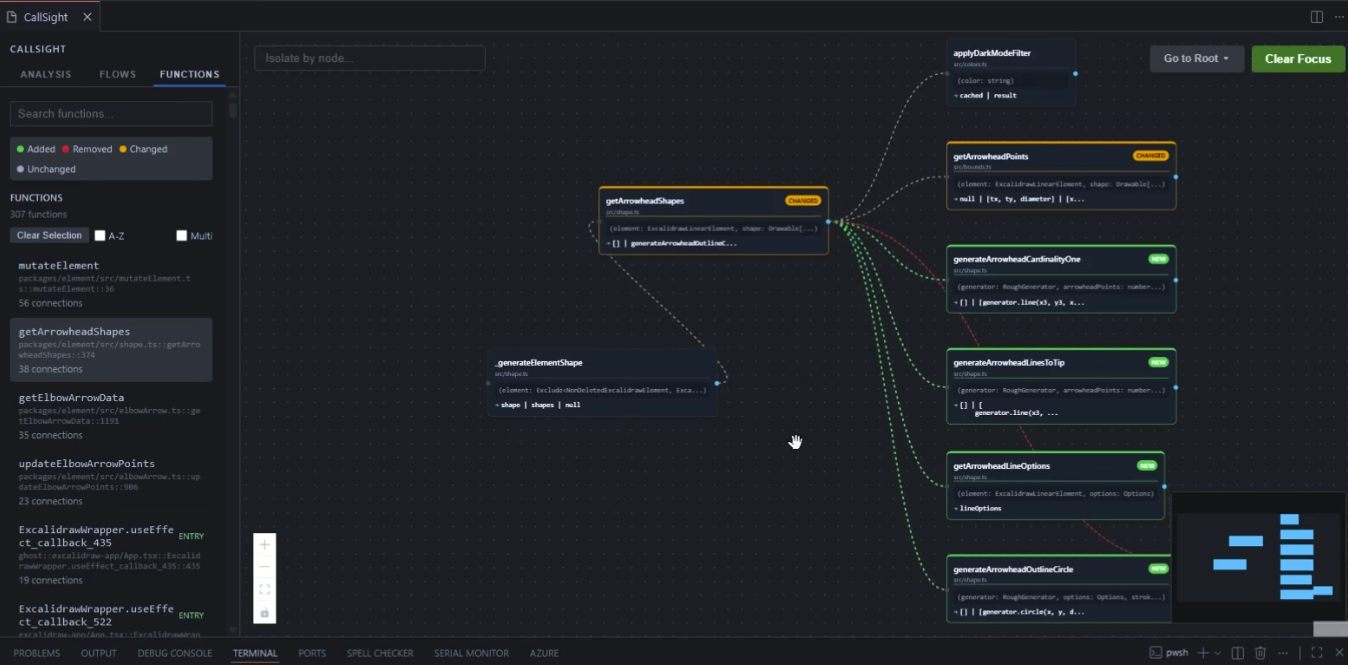
Git Diff Shows How Function flows changed
Instantly see how your changes impact the overall architecture by highlighting added, removed, and modified functions and calls.
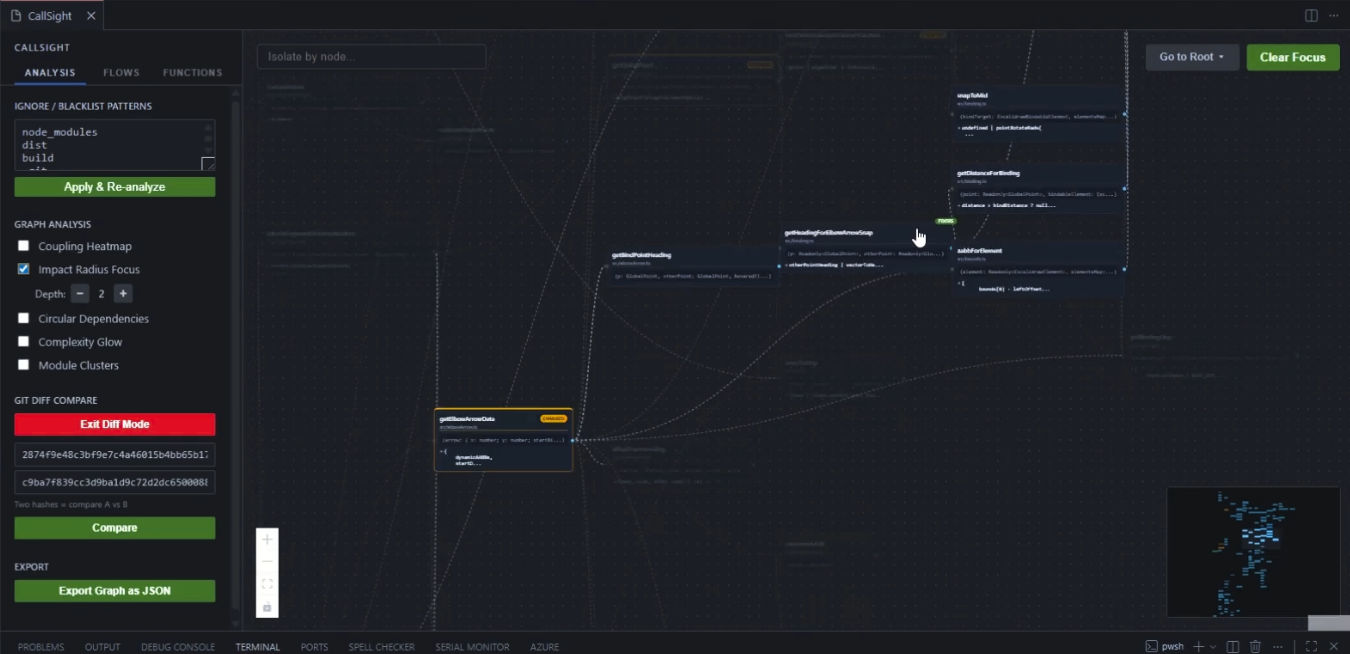
Check Impact Radius of a Function
Understand the ripple effect of a change by visualizing all downstream dependencies and affected workflows.
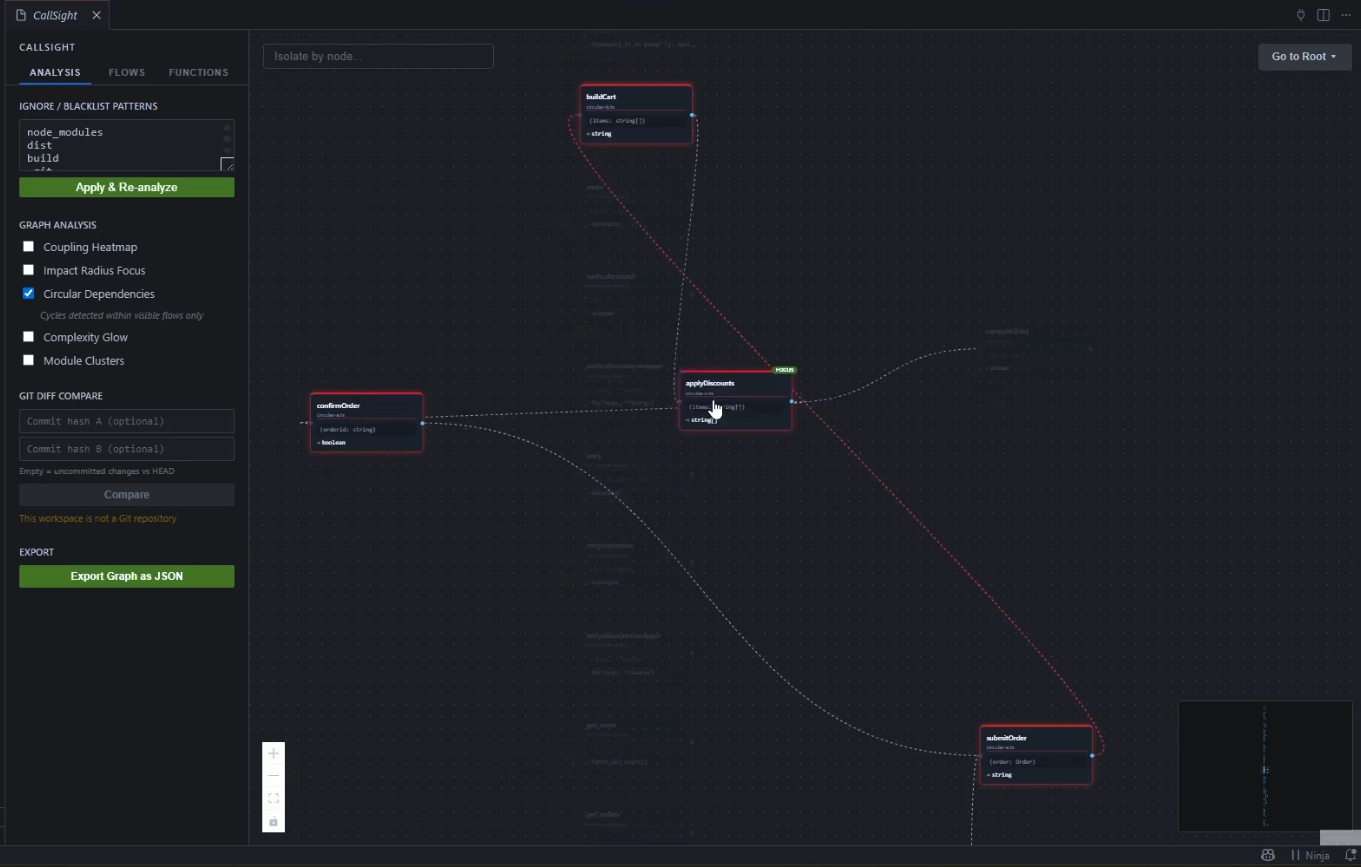
Circular Function Calls Across Files
Identify and untangle complex dependency loops that can lead to maintenance headaches and architectural decay.
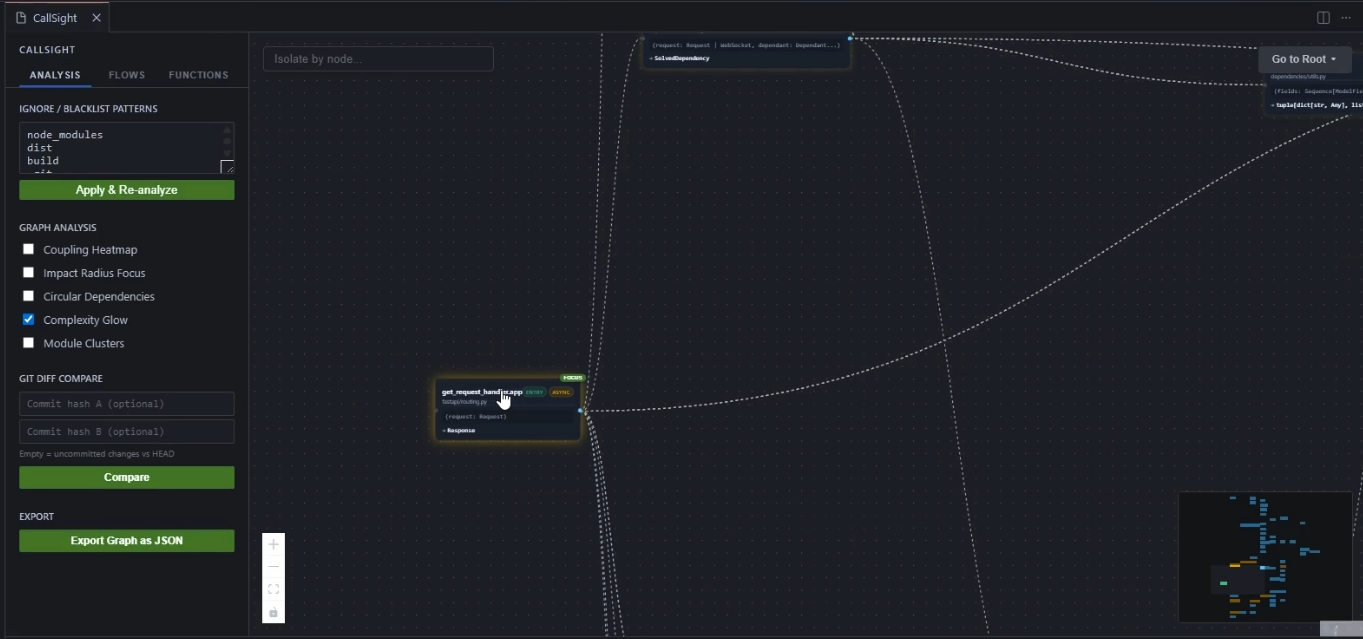
Cyclomatic Complexity Hotspots
Pinpoint high-risk, overly complex functions that are prime candidates for refactoring and require extra testing.
Module Clusters Recommendation as per relative flow
Discover natural boundaries in your code to better organize files into logical modules based on actual execution patterns.
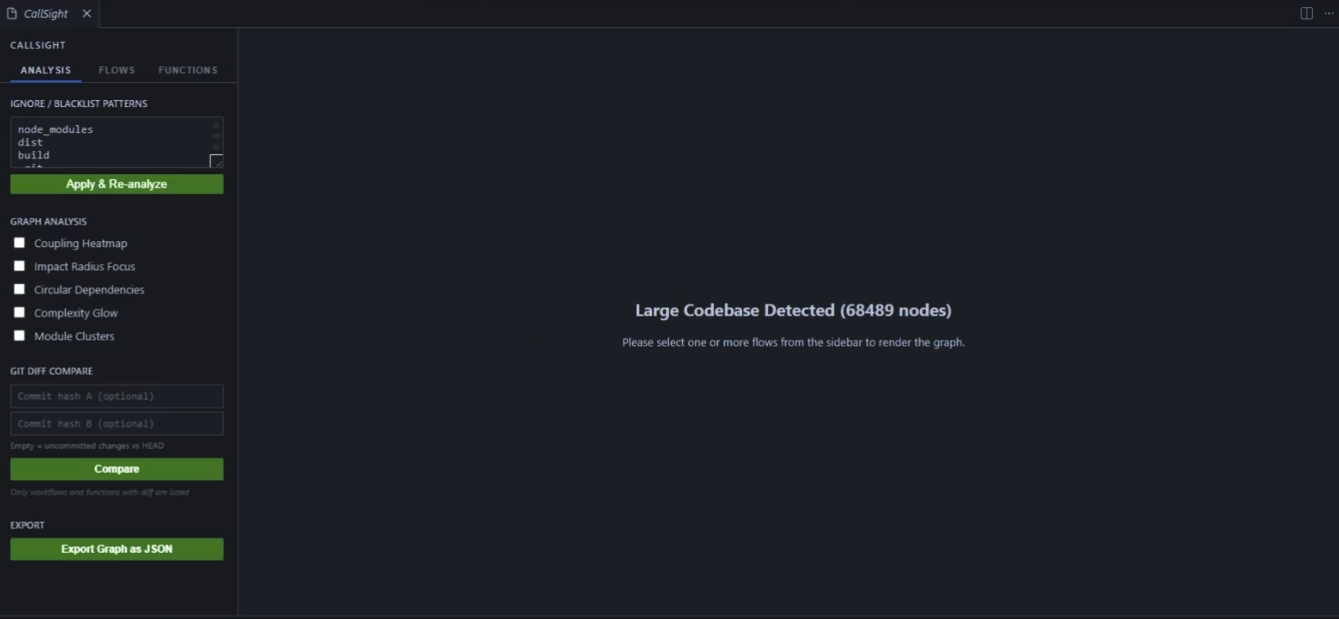
Works on very large codebases e.g running it on vscode repository
Scale effortlessly to millions of lines of code while maintaining high-performance interactive exploration.
Commands
| Command |
Description |
CallSight: Visualize Entire Codebase |
Scan all supported files in the workspace and open the diagram |
CallSight: Visualize Current File |
Analyze only the active editor file |
CallSight: Launch / Reopen |
Reopen CallSight instantly with the last scan — or trigger a fresh scan if none exists |
Tip: If you navigate from a node into source code and the panel closes, run CallSight: Launch / Reopen from the Command Palette (Ctrl+Shift+P) to get back without rescanning.
MCP setup tip: Open the Command Palette with Ctrl/Cmd+Shift+P and run MCP: List Servers → flowmap → Start Server.
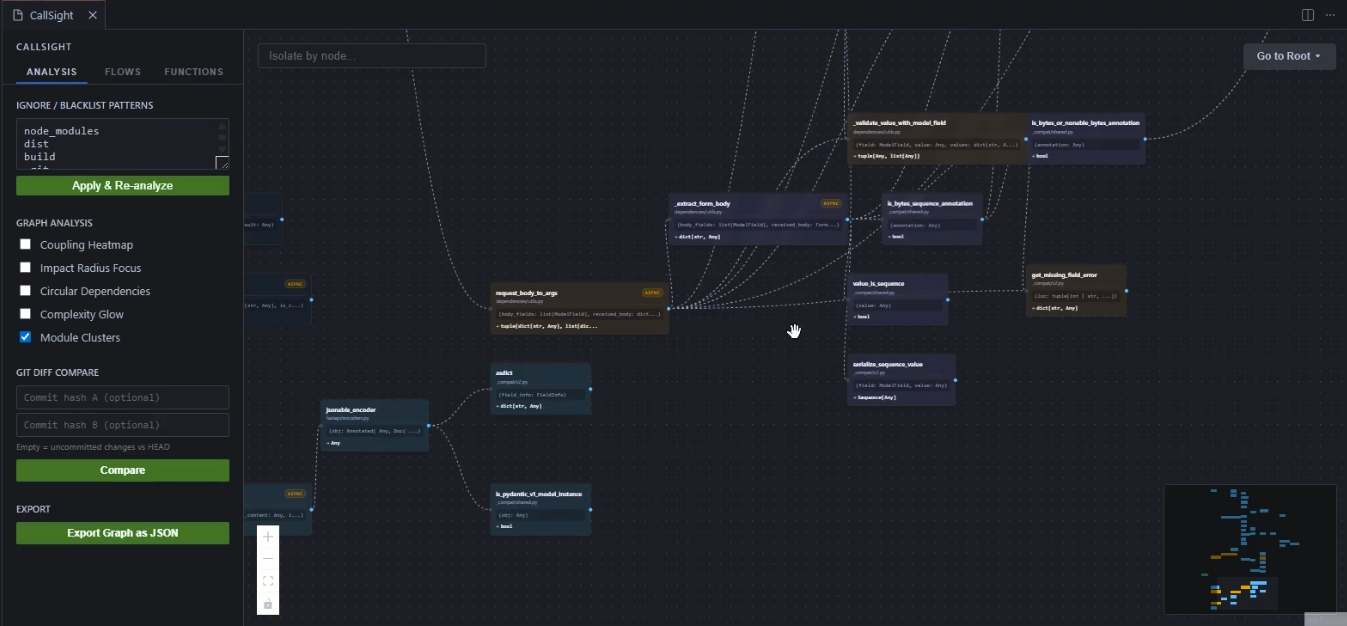
The sidebar's Analysis tab gives you several overlays you can toggle independently:
| Feature |
What it shows |
| Coupling Heatmap |
Highlights highly-connected nodes using border colour intensity |
| Impact Radius Focus |
Hover or focus a node to BFS-highlight everything it affects up to a configurable depth |
| Circular Dependencies |
Detects and highlights cycles within the visible flows |
| Complexity Glow |
Glows nodes by cyclomatic complexity — brighter = more complex |
| Module Clusters |
Tints nodes by their inferred module group |
Git Diff Compare
Compare any two git commits (or uncommitted changes vs HEAD) and see only the functions and workflows that changed. Added, removed, and modified nodes and edges are highlighted with distinct colours. The sidebar automatically filters to show only diff-affected flows and functions.
After clicking Compare, only workflows and functions with a diff are listed in the sidebar.
- Flows tab — click a flow to render it on the canvas; selecting a flow automatically clears any focused function
- Functions tab — click a function to focus it and dim everything outside its direct call context; selecting a function clears the active flow selection
- Connections count — shows total degree (callers + callees) across the full workspace graph, not just the current view
- Faded nodes/edges — when a function is focused, nodes and edges outside its immediate 1-hop neighbourhood are dimmed to 15% opacity
Notifications
After a workspace scan completes, a persistent notification appears:
CallSight: Scan complete (N files in Xs) [Show CallSight]
Click Show CallSight at any time to reopen the panel without rescanning.
Settings
| Setting |
Default |
Description |
callsight.exclude |
["node_modules", "dist", ...] |
Glob patterns to exclude from analysis |
callsight.maxNodes |
500 |
Warn if graph exceeds this many nodes |
callsight.layout |
"LR" |
Diagram layout direction (LR or TB) |
callsight.blacklist |
[] |
Additional glob patterns to exclude |
callsight.whitelist |
[] |
If non-empty, only files matching these patterns are scanned |
callsight.scanBatchSize |
50 |
Files parsed in parallel per batch. Lower = fewer OS file handles; higher = faster scans |
How It Works
CallSight uses Tree-sitter WASM grammars to parse source files. It extracts functions and call relationships, builds a call graph, detects entry points, and partitions the graph into independent execution flows — all locally and deterministically. Files are parsed in configurable parallel batches for fast scanning even on large codebases.
The core analysis engine is available as a standalone npm package: @codeflow-map/core
Use it to build your own MCP servers, CLI tools, or integrations on top of the call-graph analysis.
Contributing & Source Code
CallSight is open source!
License
MIT
